S&P 500 Index 2026 Analyst Consensus Forecast: In-depth Analysis of Drivers and Reliability
Unlock More Features
Login to access AI-powered analysis, deep research reports and more advanced features

About us: Ginlix AI is the AI Investment Copilot powered by real data, bridging advanced AI with professional financial databases to provide verifiable, truth-based answers. Please use the chat box below to ask any financial question.
Related Stocks
As of December 27, 2025, the S&P 500 Index closed at 6,929.95 points, the SPY ETF price was $690.31, and the price-to-earnings (P/E) ratio reached 27.84 times, which is at a relatively high valuation level [0].
Based on the latest market data, the
- Morgan Stanley: 7,800 points (implied upside +15%)
- Capital Economics: 8,000 points (+16.6%)
- JPMorgan Chase: 7,500 points (+10.9%)
- UBS: 7,500 points (+10.9%)
- CFRA: 7,400 points (+9.4%)
- Bank of America: 7,100 points (+5.0%)
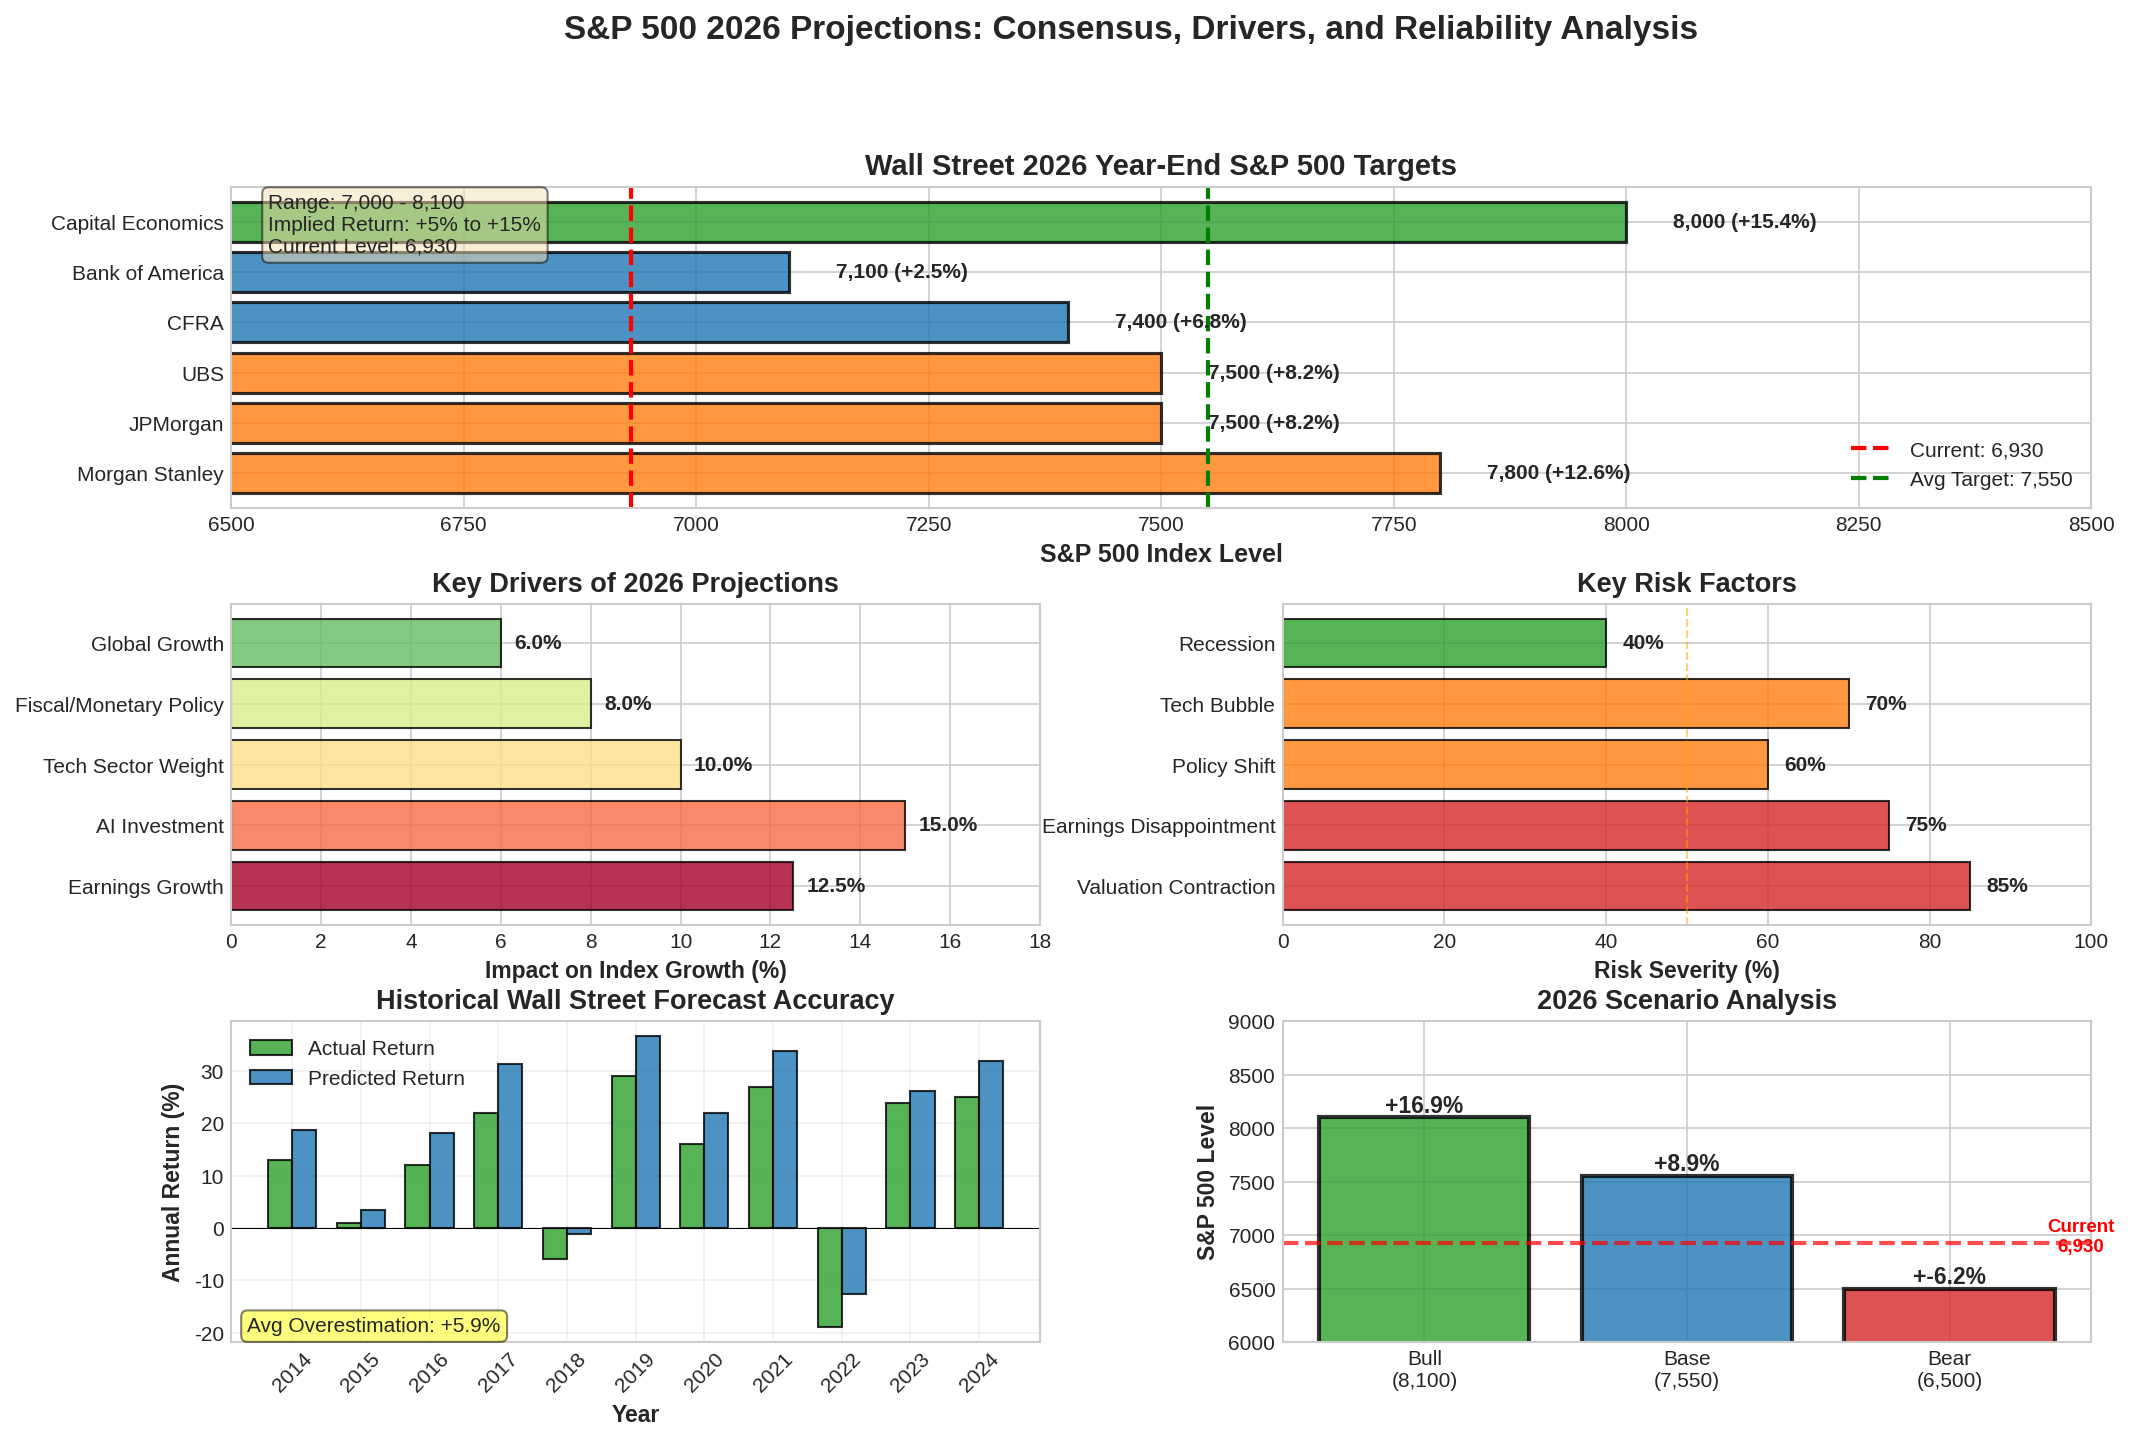
Chart shows: Top left is a comparison of target levels from various institutions; top right is key drivers; bottom left is historical forecast accuracy; bottom right is scenario analysis (optimistic/benchmark/pessimistic)
Analysts generally expect the S&P 500 earnings per share (EPS) to grow by
- Morgan Stanley: Forecasts 2026 EPS at $317, up 17%
- Market consensus: EPS around $306-$310, up 12.5-12.8%
- Revenue growth: Expected to reach 7%, accompanied by moderate margin expansion [1][2]
- Tech giants (accounting for about 25% of the index’s market capitalization) are expected to contribute most of the earnings growth
- Accelerated commercialization of AI infrastructure investments
- Sustained strong demand for cloud computing [2][3]
- AI-related stocks account for nearly 50% of the S&P 500’s weight
- It takes time for enterprises’ spending on AI infrastructure to translate into actual revenue growth
- Substantial contributions from AI investments to earnings are expected to be seen in 2026 [2][4]
Analysts have significant分歧 on valuation multiple expectations:
- Believe current high P/E ratios are reasonable, supported by the AI revolution
- Expect P/E multiples may rise further but acknowledge “bubble” risks [5]
- Predict P/E multiples may contract by 10%
- Rely on earnings growth to drive index gains, “climbing the wall of worry on valuations” [1]
- Current P/E of 27.84 times is in the historical high range [0]
- The Federal Reserve is expected to maintain a loose policy stance
- The real interest rate environment is favorable for risky assets [5]
- Deregulation is expected to boost corporate earnings
- AI-related productivity gains have not been fully priced in [5]
Historical data shows that in years following consecutive years of gains:
- The S&P 500 rose by an average of 10.6% in the year after a year of 20% gains
- In the third year after two consecutive years of 20% gains, the average gain reached 20%
- Over the past 15 years, the S&P 500 has posted positive returns in 13 years, with an 87% probability [6]
- Since 2004, Wall Street has overestimatedyear-end forecasts by an average of7%
- Over the past 20 years, only 7 years have underestimated actual returns [6]
- The forecast range at the start of 2025 was 6,000-7,100 points, with an average target of 6,614 points
- As of December 2025, the actual level has approached 6,930 points
- Most institutions were forced to raisetheir forecast targets within 2025 [6]
- High market concentration: The top seven tech giants (Magnificent 7) have an excessive impact on the index
- Valuations are in extreme ranges: High P/E makes forecasts highly sensitive to changes in earnings
- Uncertain timing of profit conversion from AI investments: The cycle from capital expenditure to profit realization is difficult to predict accurately
Based on historical model analysis, the
- Current P/E is 27.84 times, significantly higher than the historical average
- If P/E contracts to 22 times (current forward P/E is about 22x), index returns will be limited even if earnings growth meets expectations
- In the worst case, a contraction to 18 times P/E could lead to an index correction to 5,080 points (-26%) [5][7]
- The current market has priced in an expected 12.8% EPS growth in 2026
- Historical data shows uncertainty in the actual return on AI investments
- Slowing earnings in the tech sector may drag down overall index performance [2][7]
- Some institutions have explicitly used the term “bubble” to describe current tech stock valuations
- Capital Economics notes that valuations may rise further: “If there is a bubble, it will get bigger before it bursts” [5]
- Historically, tech-led market cycles often end with sharp corrections
###4.
- If inflation reaccelerates, the Federal Reserve may be forced to tighten policy
- Rising bond yields will pressure high-valuation stocks [1]
###5.
- Although the probability is currently low, it cannot be completely ruled out
- In a recession scenario, earnings and valuations may contract doubly [7]
##5. Scenario Analysis and Probability Distribution
Based on current data and risk factors, we have constructed three scenarios:
###
- Hypotheses: EPS growth of15%, P/E expands slightly by2%
- Trigger conditions: AI investments deliver unexpected returns, Federal Reserve remains loose, earnings surprises continue
###
- Hypotheses: EPS growth of12%, P/E remains stable
- Trigger conditions: Meets current consensus expectations, moderate growth environment
###
- Hypotheses: EPS growth of8%, P/E contracts by2x
- Trigger conditions: Valuation contraction, earnings miss expectations, policy tightening
##6. Implications and Recommendations for Investment Decisions
###
- ✅ Suitable: As a reference indicator formarket sentiment and consensus trends
- ✅ Suitable: As a macro background reference forcross-asset allocation
- ❌ Not suitable: As a basis forprecise timingorshort-term trading
- ❌ Not suitable: For predictingspecific market points(high historical error rate)
###
- High credibility of directional judgment: The market has risen in most years historically, and2026 is likely to continue the trend
- Extreme uncertainty in point forecasts: An average overestimation error of7% means the actual range for the7,555-point target could be7,026-8,083 points
- Over-reliance on tech/AI: Forecast quality is highly dependent on the performance of tech giants, with high single-factor risk
- Valuation double-edged sword effect: High valuations have already discounted part of the growth, but also reflect high expectations for the AI revolution
###
- Maintain balanced allocation, avoid over-concentration in tech/AI sectors
- Emphasize earnings qualityrather than pure growth expectations
- Build a margin of safety, moderately lower return expectations at current valuations
- Be vigilant about potential valuation contraction in the first half of2026
- Focus on earnings expectation adjustments(especially for tech giants)
- Closely track monetary policy signalsandbond yield changes
- Set reasonable stop-loss/take-profitlevels
- Consider hedging strategies(e.g., protective options)
- Maintain portfolio diversificationto reduce single-factor exposure
##7. Summary
Wall Street’s consensus forecast for the2026 S&P500 Index reflects market optimism about
[0] Jinling API Data - S&P500 Index Real-time Quotes, SPY ETF Data and60-day Historical Performance
[1] Visual Capitalist - “Prediction Consensus: What the Experts See Coming in2026”
https://www.visualcapitalist.com/prediction-consensus-what-the-experts-see-coming-in-2026/
[2] RBC Wealth Management - “Global Insight2026 Outlook: United States”
https://www.rbcwealthmanagement.com/en-us/insights/global-insight-2026-outlook-united-states
[3] Investing.com - “Where will the S&P500 be in2026? Here’s the updated analyst consensus”
https://www.investing.com/news/stock-market-news/where-will-the-sp-500-be-in-2026-heres-the-updated-analyst-consensus-4423280
[4] Seeking Alpha - “2026 S&P500 Outlook: A History-Based Forecast With A12 Percent Expected Gain”
https://seekingalpha.com/article/4854948-2026-s-and-p-500-outlook-a-history-based-forecast-with-a-12-percent-expected-gain
[5] Yahoo Finance - “Wall Street’s2026 outlook for stocks”
https://finance.yahoo.com/news/wall-streets-2026-outlook-for-stocks-150650909.html
[6] Get Ready For The Future - “Wall Street’s2025 Predictions: Why Experts Are Wrong (And Why it Matters)”
https://getreadyforthefuture.com/why-experts-are-wrong/
[7] Investing.com - “2026 Market Outlook Based On Current Valuations”
https://www.investing.com/analysis/2026-market-outlook-based-on-current-valuations-200672183
[8] Investopedia - “Wall Street Expects a Solid2026 for Stocks. But the ‘Risks Are Growing’”
https://www.investopedia.com/wall-street-expects-a-solid-2026-for-stocks-but-the-risks-are-growing-spx-11874698
Insights are generated using AI models and historical data for informational purposes only. They do not constitute investment advice or recommendations. Past performance is not indicative of future results.
About us: Ginlix AI is the AI Investment Copilot powered by real data, bridging advanced AI with professional financial databases to provide verifiable, truth-based answers. Please use the chat box below to ask any financial question.