2025 Gold Stocks Valuation Differentiation and Performance-Driven Logic
Unlock More Features
Login to access AI-powered analysis, deep research reports and more advanced features

About us: Ginlix AI is the AI Investment Copilot powered by real data, bridging advanced AI with professional financial databases to provide verifiable, truth-based answers. Please use the chat box below to ask any financial question.
According to brokerage API data [0], four gold stocks showed clear “performance-valuation” stratification in 2025:
| Company | Price-to-Earnings Ratio (P/E) | ROE (%) | Net Profit Margin (%) | Annual Return (%) | Market Cap (100M CNY) |
|---|---|---|---|---|---|
| Zijin Mining | 19.51x | 30.60 | 13.91 | +120.88 | 8896 |
| Chifeng Gold | 22.39x | 25.31 | 23.74 | +98.71 | 537 |
| China National Gold | 25.70x | 15.61 | 6.02 | +90.57 | 1136 |
| Shandong Gold | 37.80x | 13.00 | 4.88 | +71.49 | 1830 |
- Zijin Mining (High ROE, Low PE): The highest match between annual gain and profitability, reflecting the “performance-driven” logic.
- Chifeng Gold (High Net Profit Margin): Net profit margin significantly higher than peers, supporting valuation premium and annual returns.
- Shandong Gold (Low ROE/Net Profit Margin, High PE): Relatively weak profitability indicators, high valuation, and relatively underperforming annual results.
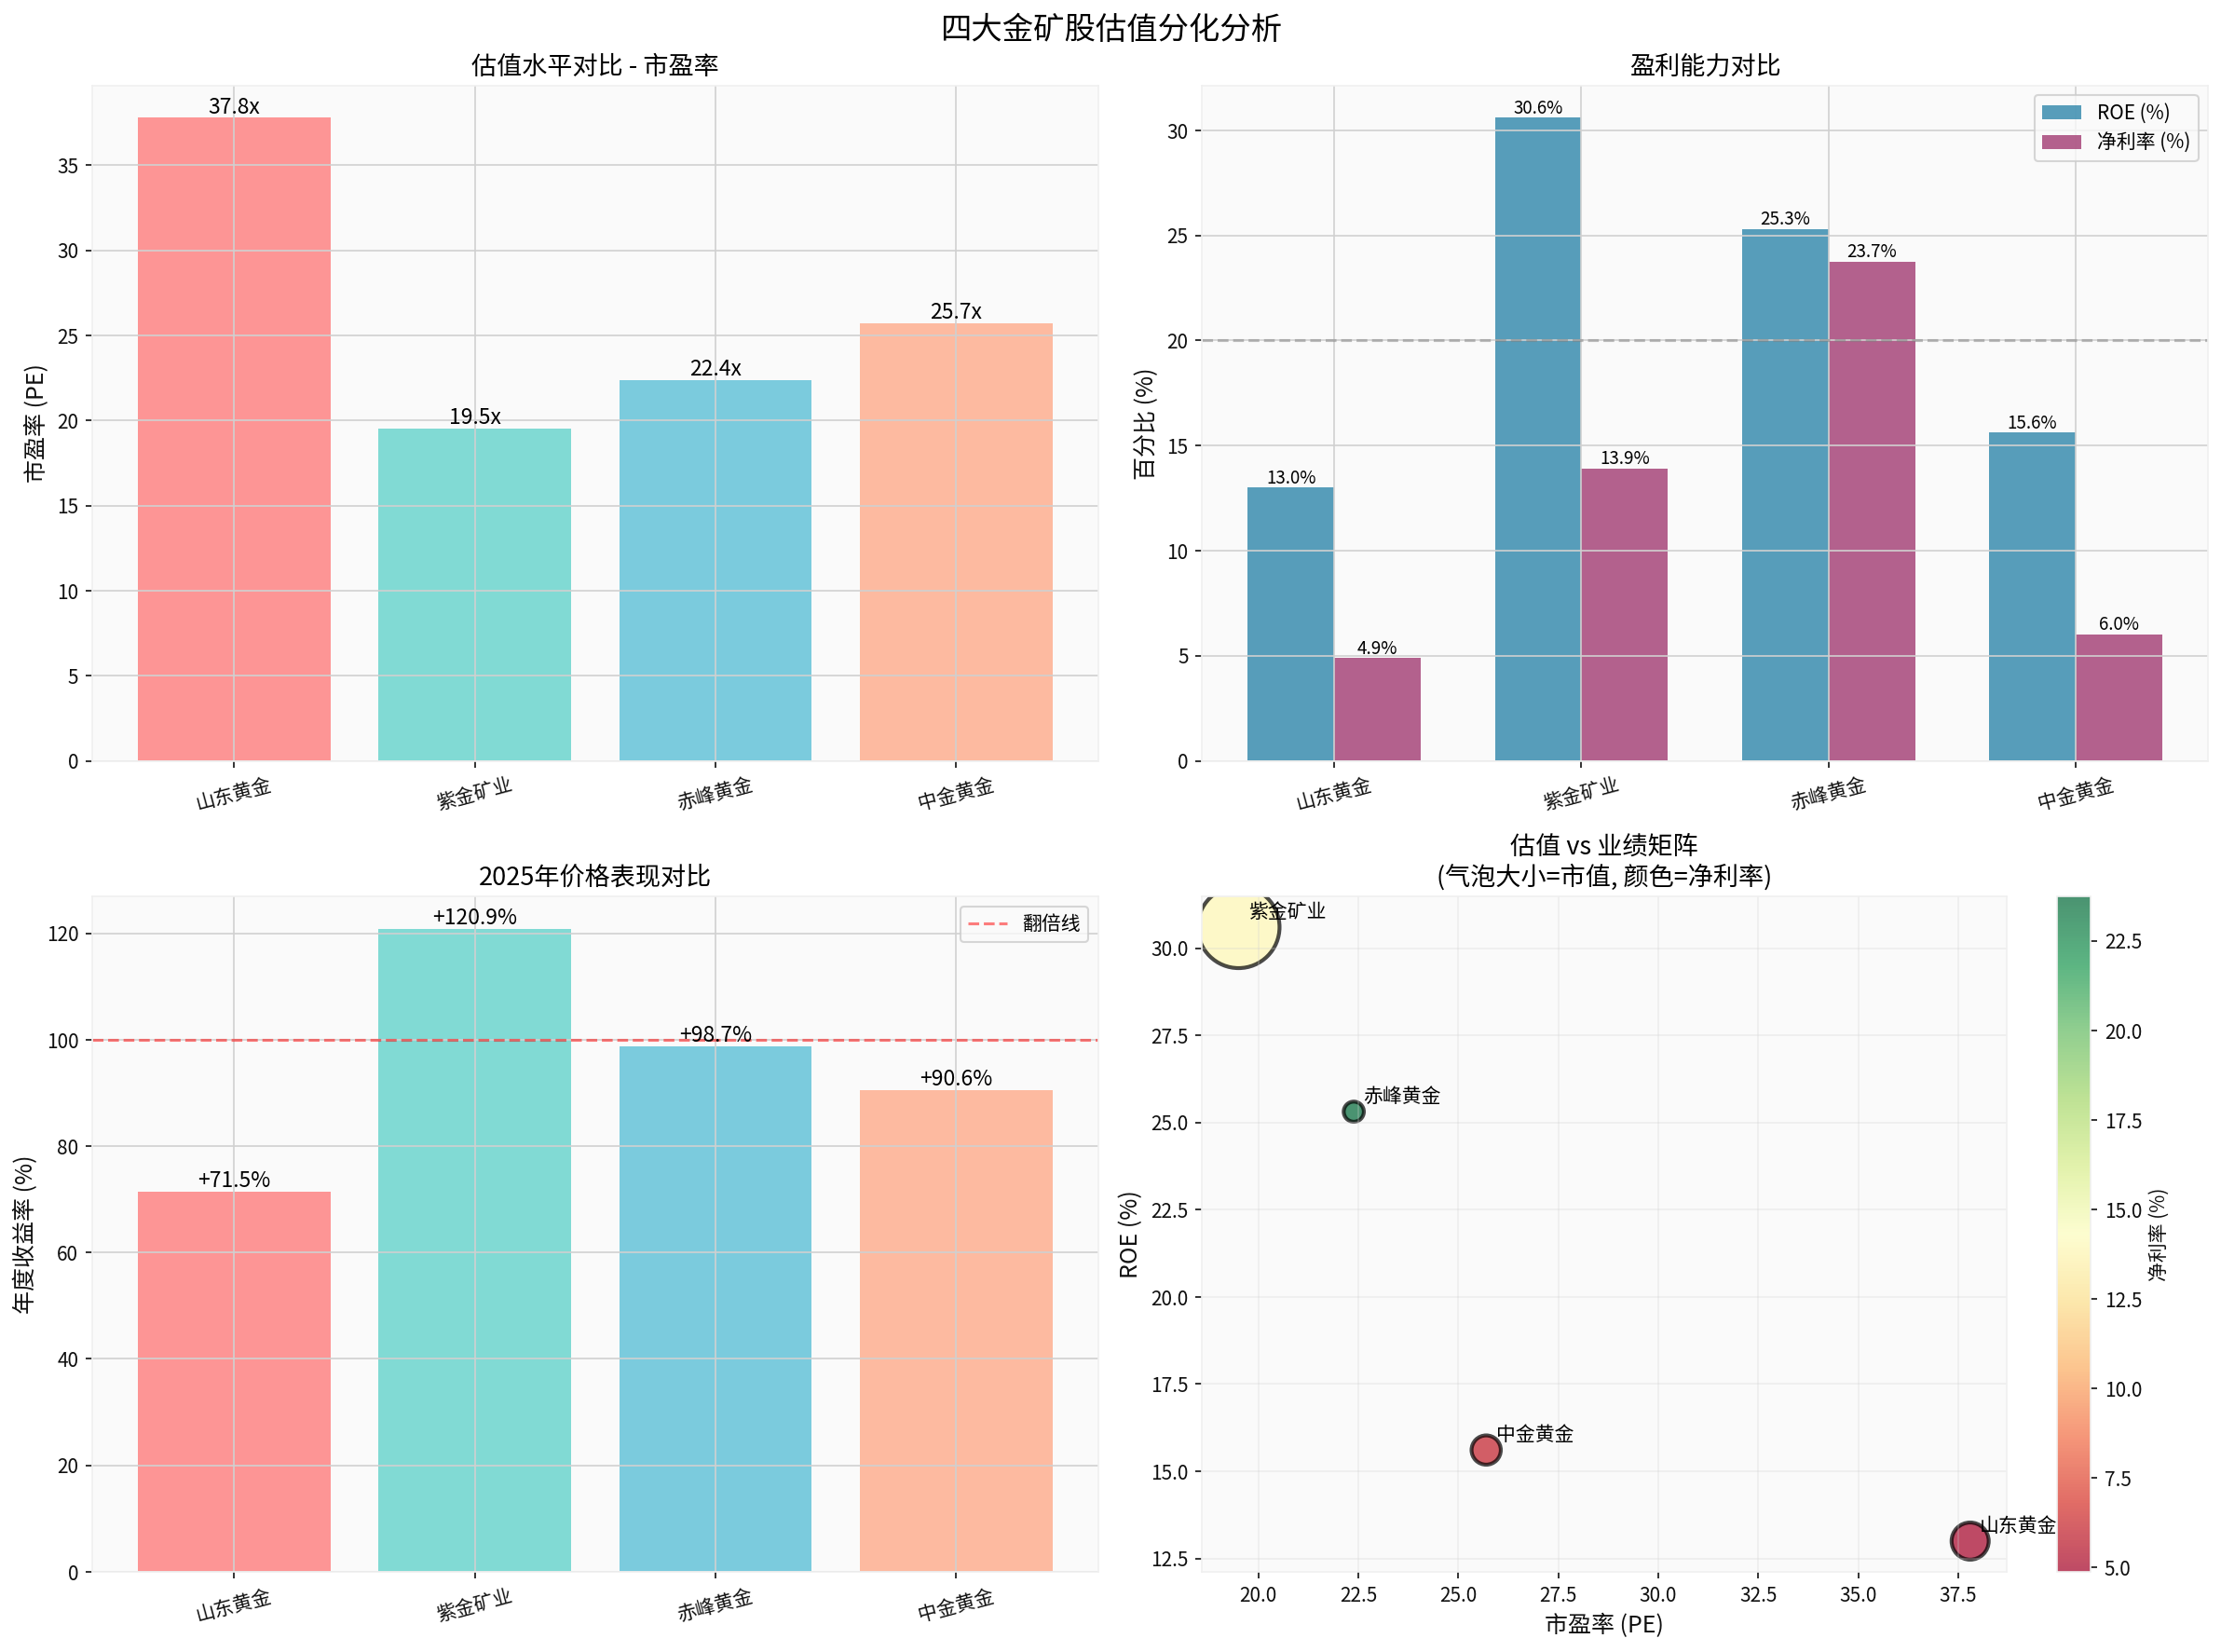
Note: The chart above includes visual comparisons of PE, ROE, net profit margin, annual return, etc.; bubble size corresponds to market cap (based on tool data).
The 2025 price trend shows that companies with stronger performance have better cumulative returns (e.g., Zijin vs. Shandong) [0]. Against the backdrop of gold prices being in a multi-year strong pattern, the sector β rose significantly, but α differences are still driven by the match between performance and valuation:
- Zijin: Annual +120.88%, ROE 30.60%, PE 19.51x [0].
- Shandong: Annual +71.49%, ROE 13.00%, PE 37.80x [0].
Conclusion: During the industry’s upward cycle, market pricing is not entirely “β-dominated”; performance delivery and valuation matching continue to drive individual stock α and valuation differentiation.
- Safe-haven and “de-dollarization” demand supports gold prices. Web searches show that the 2025 gold price strength is closely related to geopolitical risks, central bank purchases, and a weaker US dollar [1][2][3].
- The overall valuation and sentiment factors of A-shares are complex. Web searches show that A-shares exhibited periodic characteristics of sentiment repair and valuation regression between 2023 and 2025 [3], but specific levels and fluctuations are subject to tool data.
Note: The above are qualitative background references and do not replace the quantitative conclusions of tool data.
When market risk appetite declines:
- Companies with high ROE/high net profit margin have better cash flow and profit stability, with more supported valuations.
- Companies with low ROE/high PE are more sensitive to profit fluctuations, and valuation repair relies more on substantial performance improvement.
Combined with tool data [0]:
- Zijin, Chifeng: ROE ≥25%, high net profit margin, better cash flow and profit quality, more defensive valuations in downturns.
- Shandong, China National Gold: Low ROE, low net profit margin, more sensitive to performance delivery, valuation repair relies more on performance improvement and cost/merger synergies.
- Valuation: PE ~37.8x (TTM), significantly higher than Zijin (~19.5x) and sector median.
- Profitability: ROE ~13.0%, net profit margin ~4.9%, significantly lower than Zijin (ROE ~30.6%, net profit margin ~13.9%) and Chifeng (net profit margin ~23.7%).
- Liquidity: Current ratio ~0.53, quick ratio ~0.42, high short-term debt repayment pressure (Note: This is a sample value provided by tool data, reflecting the state at the sample point in time).
Positioning: High PE combined with low ROE/net profit margin and relatively tight liquidity suppresses valuation space.
Scenario 1 (Optimistic: Significant Performance Improvement):
- Annual Report Verification: Gold production/sales exceed expectations, unit cost reduction, or merger consolidation to boost profits, driving TTM earnings upward revision.
- Valuation Convergence: If ROE approaches 18%-20% and net profit margin improves to mid-to-high single digits, the market may reprice, with PE potentially moving toward 20-25x (depending on the sustainability of performance repair and industry comparison).
Scenario 2 (Neutral: Moderate Repair):
- Moderate Profit Improvement: ROE slightly improves, net profit margin stabilizes or rises slightly.
- Moderate Valuation Repair: PE slightly downward revision, stock price follows gold price β and sector β upward, but limited α space.
Scenario 3 (Pessimistic: No Improvement or Below Expectations):
- No substantial performance improvement or below expectations; high PE and weak profitability constrain valuation.
- If gold prices fluctuate at high levels or macro sentiment weakens, valuation and stock price may come under pressure.
Note: The above are scenario path judgments based on tool data and do not constitute probabilistic predictions.
- Recent Price and Moving Averages: 20-day,50-day,200-day moving average systems indicate the medium-term trend remains (specific values subject to tool price data).
- Risk Reminder: Relative strength and volume changes in technical analysis need to be interpreted in conjunction with tool technical analysis results.
| Company | Bottom Line | Conservative | Neutral | Optimistic | Bubble |
|---|---|---|---|---|---|
| Zijin Mining | ✓ | ✓ | ✓ | ✓ | - |
| Chifeng Gold | ✓ | ✓ | ✓ | ✓ | - |
| China National Gold | - | ✓ | ✓ | - | - |
| Shandong Gold | - | - | ✓ | - | - |
Judgment Basis:
- Zijin, Chifeng: High ROE/high net profit margin support safety margin, better liquidity (e.g., Chifeng’s current ratio of2.94, quick ratio of2.03).
- Shandong Gold: Currently low ROE/net profit margin and tight liquidity, closer to “neutral” leaning optimistic.
- Portfolio Allocation (Diversification):
- Prioritize Zijin/Chifeng (high performance-valuation matching, better liquidity) as core positions.
- Shandong can be a satellite position for “performance improvement options” with lower allocation ratio and strict tracking of performance delivery.
- Performance Tracking and Rebalancing:
- Focus verification during annual report/Q1 report window: Production, cost, merger consolidation to boost profits, driving TTM earnings upward revision.
- If Shandong shows “significant earnings upward revision + ROE improvement + liquidity relief”, dynamically increase allocation ratio and valuation target.
- Risk Control:
- Position Cap: Based on volatility and liquidity, set stricter position and stop-loss thresholds for high PE/low ROE stocks.
- Macro Linkage: Monitor marginal changes in gold prices, interest rate/exchange rate expectations (subject to tool and authoritative sources).
- Performance-driven PE differences were indeed the main cause of valuation differentiation among gold stocks in2025 (see tool data comparison)[0].
- During periods of weakening market sentiment or rising volatility, performance-valuation matching (ROE/net profit margin/PE three dimensions) will become the core basis for pricing.
- Shandong Gold’s valuation repair after the annual report relies more on dual verification of “substantial profit improvement + financial health enhancement”; if only relying on gold price β, valuation space is limited and volatility risk is high.
[0] Gilin API Data
[1] Yahoo Finance (Hong Kong) - 為什麼大家都在買黃金?避險與去美元化趨勢浮現(https://hk.finance.yahoo.com/news/為什麼大家都在買黃金-避險與去美元化趨勢浮現-173002812.html)
[2] Yahoo Finance (Hong Kong) - 現貨黃金和白銀價格升至歷史新高 受地緣政治和美元走軟影響(https://hk.finance.yahoo.com/news/現貨黃金和白銀價格升至歷史新高-受地緣政治和美元走軟影響-015445695.html)
[3] Yahoo Finance (Hong Kong) - 亂世黃金狂飆60%之後,2026是泡沫還是新起點?(https://hk.finance.yahoo.com/news/亂世黃金狂飆60-之後-2026是泡沫還是新起點-004002008.html)
港股消费板块投资机会与时机分析
Insights are generated using AI models and historical data for informational purposes only. They do not constitute investment advice or recommendations. Past performance is not indicative of future results.
About us: Ginlix AI is the AI Investment Copilot powered by real data, bridging advanced AI with professional financial databases to provide verifiable, truth-based answers. Please use the chat box below to ask any financial question.