Analysis of Whether the Capital Expenditure and Cash Flow Improvement in the Thermal Power Industry Can Replicate the Trend of Electrolytic Aluminum Supply-Side Reform
Unlock More Features
Login to access AI-powered analysis, deep research reports and more advanced features

About us: Ginlix AI is the AI Investment Copilot powered by real data, bridging advanced AI with professional financial databases to provide verifiable, truth-based answers. Please use the chat box below to ask any financial question.
Related Stocks
Based on the collected data, I will systematically analyze from four dimensions whether the reduction in capital expenditure and improvement in free cash flow in the thermal power industry can replicate the trend of the electrolytic aluminum industry’s supply-side reform.
- Chalco (Aluminum Corporation of China) maximum increase: +91.29%
- Shenhuo Energy maximum increase: +165.83%
- Driving factor: Policy-mandated capacity reduction (4.9 million tons of non-compliant capacity + 1 million tons of environmental restriction)
- Wanneng Power: +96.87% (best performance)
- Beijing Energy Power: +66.56%
- Guodian Power: +35.36%
- Driving factors: Coal price decline + cash flow improvement + capacity electricity price policy
| Indicator | Beijing Energy Power | Guodian Power | Wanneng Power |
|---|---|---|---|
| P/E | 10.36x | 13.90x | 8.38x[7] |
| P/B | 1.52x | 1.68x | 1.16x[7] |
| ROE | 12.63% | 12.72% | 14.63%[7] |
| EV/OCF | 7.79x | 8.96x | 8.19x[7] |
According to brokerage API data, the thermal coal price fell sharply in 2025:
- Qinhuangdao 5500K coal price dropped from 765 yuan/ton at the beginning of 2024 to 621 yuan/ton in mid-2025, a decrease of 19%[2]
- Key Phenomenon: Market coal price (621 yuan/ton) is lower than the long-term contract coal price, forming an inversion[2]
- Enterprises with a low proportion of long-term contract coal can significantly reduce fuel costs by purchasing spot coal
- Thermal power shifts from a “single electricity quantity price” to a dual-track system of “capacity price + electricity quantity price”
- Similar to the “production capacity ceiling” logic of electrolytic aluminum supply-side reform, but thermal power uses a price mechanism rather than production restrictions
- Profit stability is significantly improved, and ROE shifts from volatility to stability
According to industry research data:
- Net operating cash flow is more than twice the net profit(core judgment of the original post)
- In 2024, the net operating cash flow of the waste incineration sector was 15.1 billion yuan, an increase of 18% year-on-year[5]
- Free cash flow was 15.1 billion yuan, an increase of 18% year-on-year[5]
- Dividend ratio of some companies has increased significantly:Green Power’s dividend ratio in 2024 was 71.45% (+38pp year-on-year), and it promised a dividend plan for 2024-2026[5]
- Beijing Energy Power: Latest FCF is +1.27 billion yuan (positive)
- Guodian Power: Latest FCF is -2.46 billion yuan (still in investment period)
- Wanneng Power: Latest FCF is -1.84 billion yuan (still in investment period)
- New energy consumption constraints are relaxed: Utilization rate target reduced from 95% to no less than 90%[4]
- It is expected to add 56-87 GW of coal-fired power in 2025 (basically equal to the sum of 2023+2024)[4]
- However, the growth rate of electricity consumption is only about 6% (6.8% in 2024), and competition on the power generation side is intensifying[4]
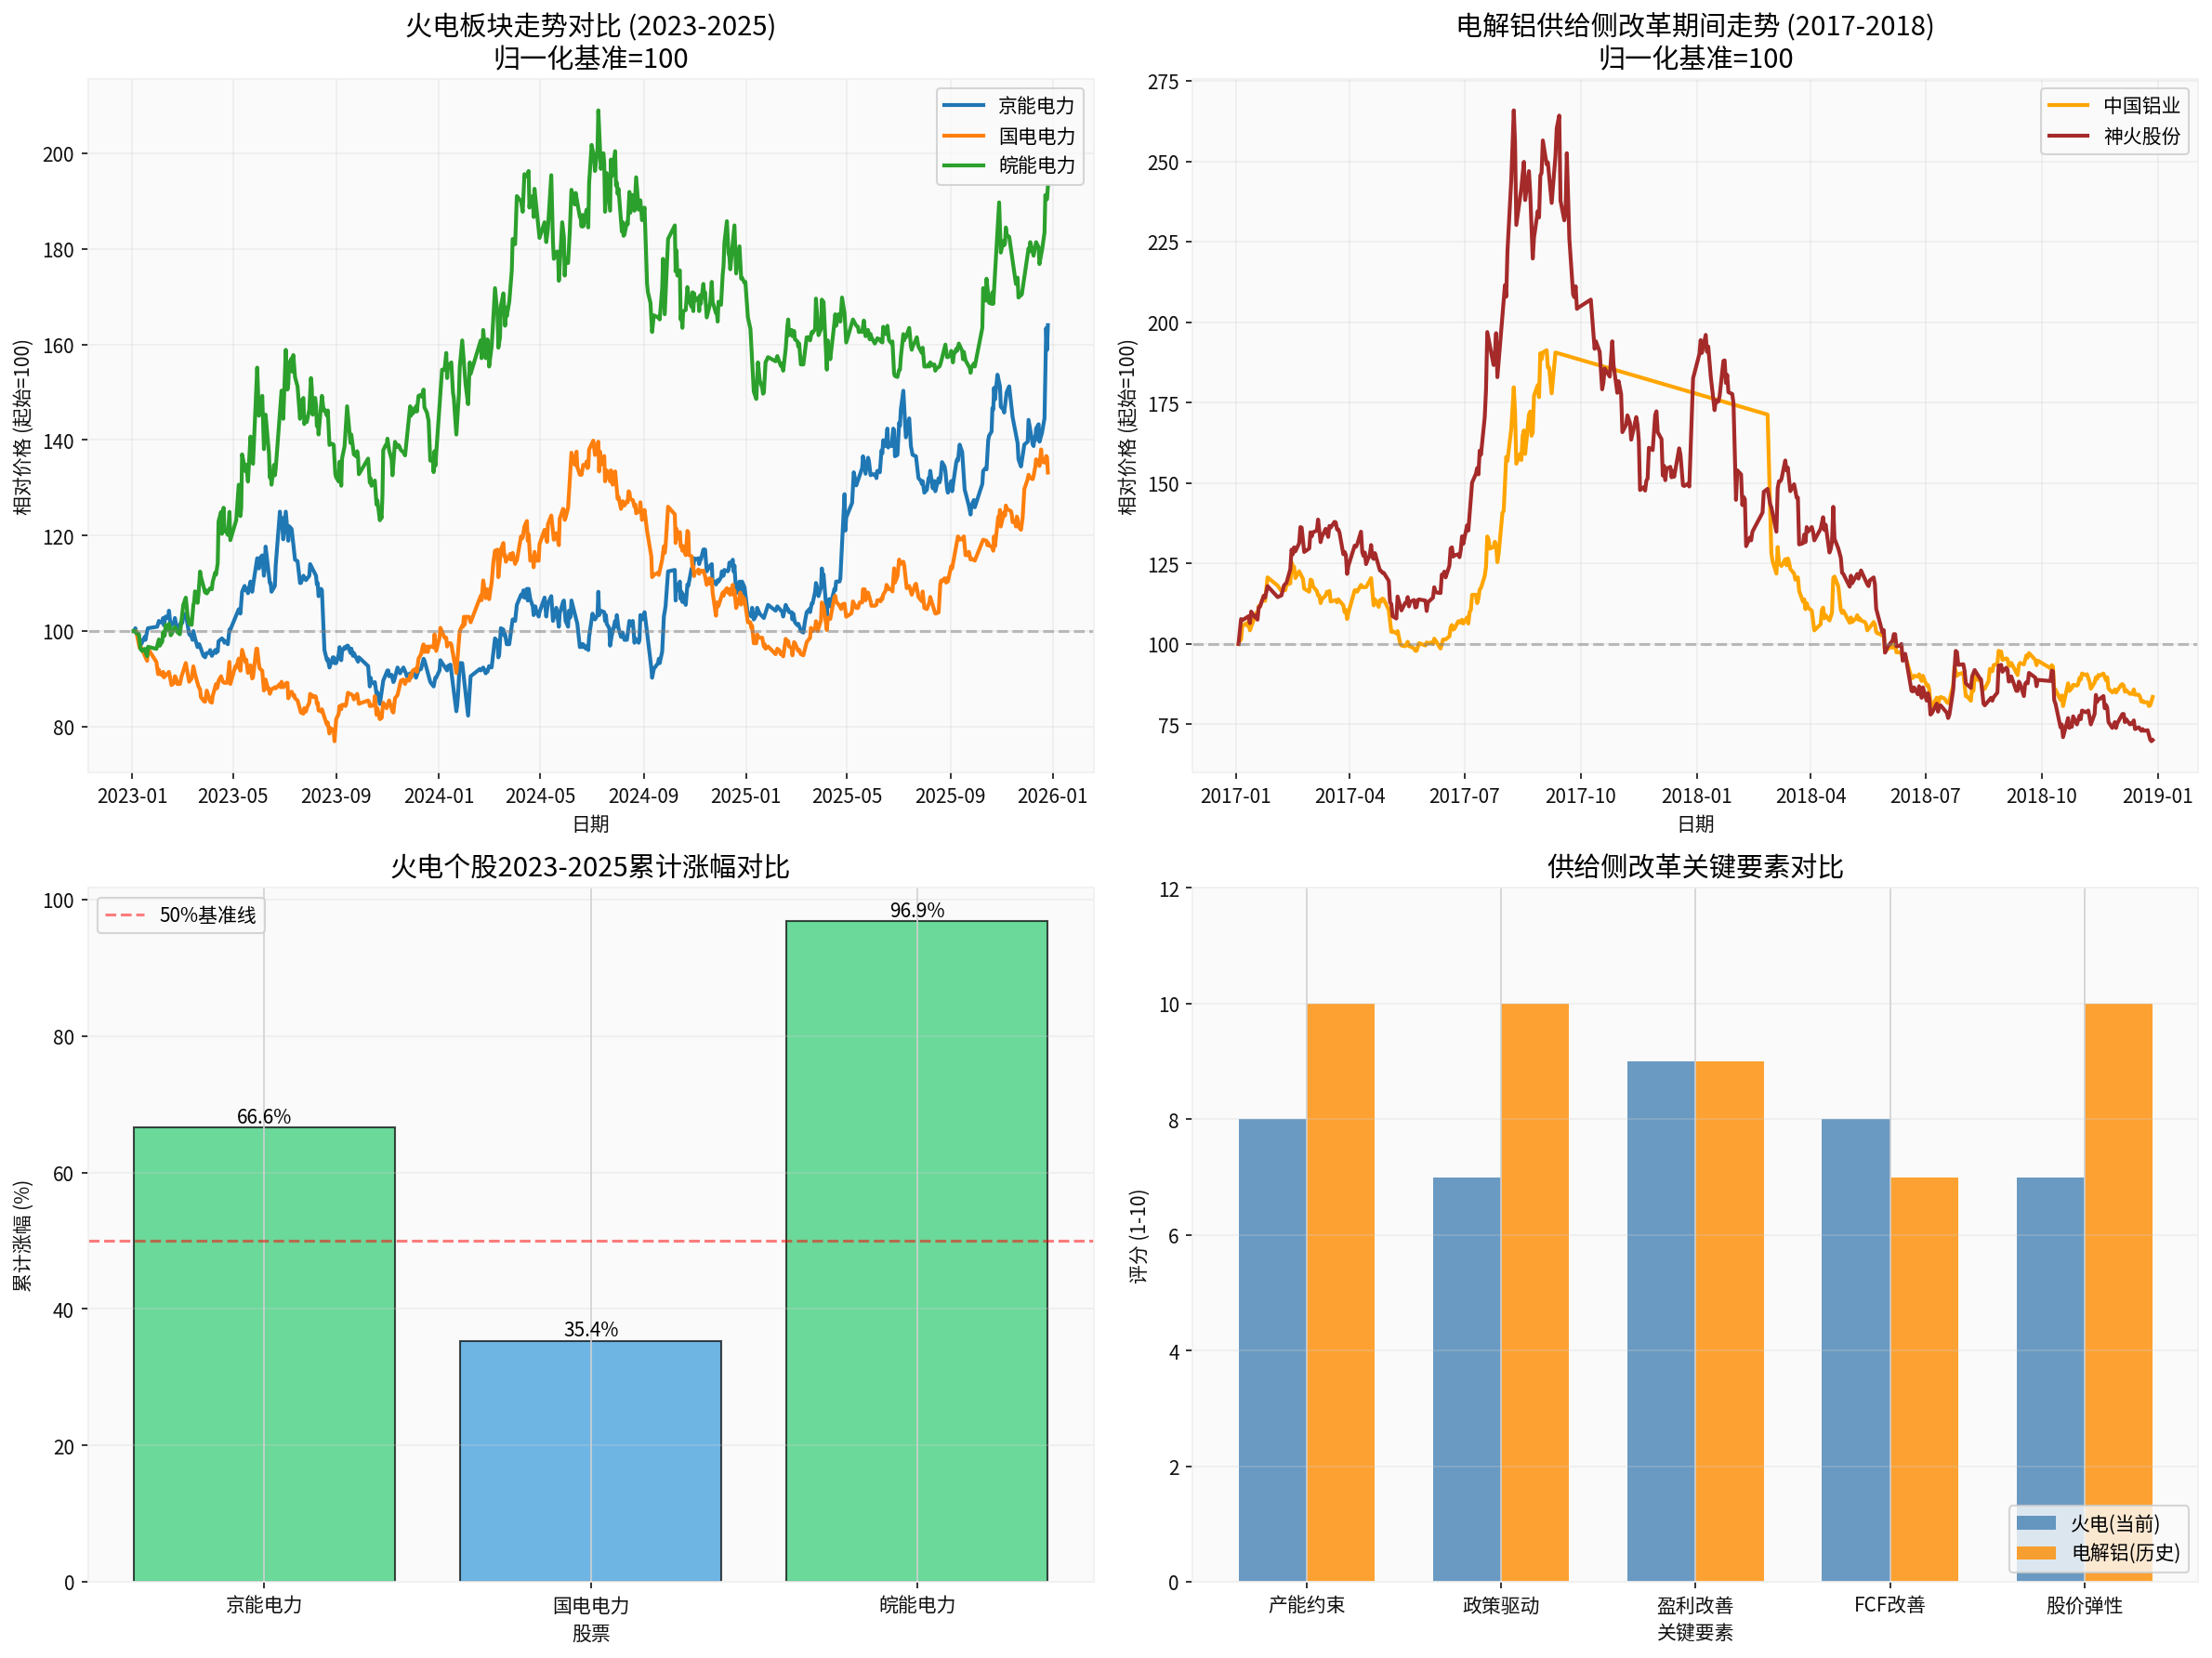
- Top Left:Trend of the three thermal power leaders from 2023 to 2025, with Wanneng Power leading at +96.87%
- Top Right:Trend during the electrolytic aluminum supply-side reform period (2017-2018), with Shenhuo Energy reaching a maximum of +165.83%
- Bottom Left:Comparison of cumulative gains of individual thermal power stocks
- Bottom Right:Score of key elements of supply-side reform, electrolytic aluminum is stronger in production capacity constraints and policy driving
| Dimension | Electrolytic Aluminum Supply-Side Reform | Current Thermal Power Situation | Difference Degree |
|---|---|---|---|
Production Capacity Constraint |
Hard ceiling of 45 million tons[1] | No hard constraint, still expanding production[4] | ⭐⭐⭐⭐⭐ Very Large |
Policy Intensity |
Administrative orders for mandatory shutdown[3] | Guided by market-oriented mechanisms | ⭐⭐⭐⭐ Large |
Demand Side |
Strong demand from real estate/infrastructure | New energy substitution, thermal power generation declining[4] | ⭐⭐⭐⭐ Large |
Supply Concentration |
Rapidly increasing | Dispersed: Five major power generation groups + local state-owned enterprises | ⭐⭐⭐ Medium |
Profit Sustainability |
Aluminum price remained high for 3+ years | Large coal price fluctuations, electricity price regulated | ⭐⭐⭐⭐ Large |
- Qinhuangdao coal price dropped from 765 yuan/ton to 621 yuan/ton in 2025[2]
- Reasons: Supply-demand imbalance, warm winter + high inventory + weak demand
- Enlightenment:The judgment of long-term cost increase is wrong, but the short-term coal price decline is beneficial to thermal power
- 2024 operating cash flow of the waste incineration sector was 15.1 billion yuan vs net profit of about 1.2-1.4 billion yuan[5]
- Cash flow mainly comes from depreciation and amortization (characteristic of heavy asset industries)
- Key:Depreciation is a “non-cash expenditure”, but capital expenditure is a real cash outflow
- ✅ Profit Improvement: Coal price decline + capacity electricity price
- ✅ Cash Flow Improvement: Capital expenditure reduction
- ✅ Valuation Repair: P/E still has room to rise from 8-14x
- ❌ Lack of Hard Production Capacity Constraint: Thermal power is still expanding production[4]
- ❌ Weakened Demand Side: New energy squeezes thermal power generation[4]
- ❌ Insufficient Policy Intensity: Market-oriented mechanism vs administrative order
- Electrolytic Aluminum Supply-Side Reform: Growth Stock Logic(supply contraction → price rise → profit explosion)
- Current Thermal Power: Value Stock Logic(stable profit + high dividend + low valuation)
| Company | Advantages | Disadvantages | Investment Value |
|---|---|---|---|
Beijing Energy Power |
FCF turned positive, fast profitability improvement, small market cap with high elasticity | Regional limitation, single thermal power business | ⭐⭐⭐⭐ Growth Type |
Guodian Power |
Large installed capacity, stable cash flow | High capital expenditure pressure, low ROE | ⭐⭐⭐⭐ Stable Type |
Wanneng Power |
Highest ROE (14.63%), lowest P/E (8.38x), regional electricity price advantage | Negative FCF, high leverage ratio | ⭐⭐⭐⭐⭐ Best Cost-Effectiveness |
- Coal Price Rebound Risk:Coal price in Qinhuangdao rebounded from 610 yuan/ton to 813 yuan/ton in 2025[2]; if it continues to rise, it will erode profits
- Electricity Price Decline Risk:Long-term contract electricity prices generally declined in 2025, with a 13.5% decrease in Guangdong[2]
- New Energy Competition:New energy installed capacity will still exceed 300 GW in 2025[4], squeezing thermal power generation space
- High Leverage Risk:Financial analysis of the three companies all shows “high_risk” debt risk[0]
- ✅ Common Points:Profit improvement + cash flow improvement + low valuation
- ❌ Differences:Lack of hard production capacity constraint + weakened demand side + insufficient policy intensity
- Achieved: Wanneng +96.87%, Beijing Energy +66.56%, Guodian +35.36%[0]
- Remaining Space: Wanneng (P/E from8.38x→10x, +20%), Beijing Energy (P/E from10.36x→12x, +15%), Guodian (P/E from13.90x→15x, +8%)
- Comprehensive Judgment:Average remaining space is 10%-20%, individual stock differentiation is over 30%
-
Wanneng Power (000543.SZ):⭐⭐⭐⭐⭐
- Highest ROE (14.63%), lowest P/E (8.38x)
- Regional electricity price advantage (Anhui increased by7.4% vs Guangdong decreased by13.5%)[2]
- 3-year gain +103%,5-year +99%, stable long-term performance[7]
-
Beijing Energy Power (600578.SS):⭐⭐⭐⭐
- FCF has turned positive, entering cash cow stage
- Small market cap (36 billion yuan), high elasticity
- YTD +57.31%, strong momentum[7]
-
Guodian Power (600795.SS):⭐⭐⭐
- Large installed capacity, strong stability
- But P/E (13.90x) is relatively high, high capital expenditure pressure
- Suitable for stable allocation, not an elastic variety
- Short-Term (3-6 months):Hold Wanneng and Beijing Energy, bet on coal price decline and dividend expectation
- Medium-Term (6-12 months):Pay attention to the implementation of capacity electricity price; if the fulfillment is good, increase positions
- Long-Term (1-2 years):Allocate Guodian Power to lock in stable dividends + new energy growth
[0] Jinling API Data (Financial Analysis, Stock Price Data, Company Overview)
[1] Steel Industry In-Depth Report: Re-discussing Supply-Side Reform, Soochow Securities - Review of Electrolytic Aluminum Supply-Side Reform Policy and Analysis of Production Capacity Clearance (https://pdf.dfcfw.com/pdf/H3_AP202507161710096388_1.pdf)
[2] Thermal Power Profit Differentiation, Dividend Value Persists, Southwest Securities - 2025 Coal Price Trend, Long-Term Contract Electricity Price Changes, Regional Differentiation Analysis (https://pdf.dfcfw.com/pdf/H3_AP202507101706494958_1.pdf)
[3] Futures Research Institute Aluminum and Alumina Futures and Options Annual Report - Detailed Process of Electrolytic Aluminum Supply-Side Reform in 2017-2018, 4.9 Million Tons of Non-Compliant Production Capacity Cleared, Aluminum Price Rose from $1400/Ton to $2500/Ton (https://pic-test-gjmetal-1324067834.cos.ap-shanghai.myqcloud.com/newsv2/28db0af6765b4bbcbf8a0492349381fe20250109145003.pdf)
[4] 2025 Electricity Marketization Reform and Electricity Price System Insight, Rocky Mountain Institute - Analysis of Electricity Marketization Reform, Relaxation of New Energy Consumption Constraints, and Capacity Electricity Price Mechanism (https://rmi.org.cn/wp-content/uploads/2025/05/final-0508-2025电力市场化改革与电价体系洞察.pdf)
[5] Thermal Power Profit Differentiation, Dividend Value Persists, Southwest Securities - 2024 Operating Cash Flow of Waste Incineration Sector:15.1 Billion Yuan (+18%), Free Cash Flow:15.1 Billion Yuan (+18%), Green Power Dividend Ratio:71.45% (https://pdf.dfcfw.com/pdf/H3_AP202507101706494958_1.pdf)
[6] Futures Research Institute Aluminum and Alumina Futures and Options Annual Report - 2017-2018 Electrolytic Aluminum Supply-Side Reform Performance Data (https://pic-test-gjmetal-1324067834.cos.ap-shanghai.myqcloud.com/newsv2/28db0af6765b4bbcbf8a0492349381fe20250109145003.pdf)
[7] Jinling API Data (Company Valuation Data, Stock Price Trend Data)
Insights are generated using AI models and historical data for informational purposes only. They do not constitute investment advice or recommendations. Past performance is not indicative of future results.
About us: Ginlix AI is the AI Investment Copilot powered by real data, bridging advanced AI with professional financial databases to provide verifiable, truth-based answers. Please use the chat box below to ask any financial question.