Financial Valuation and 2026 ROE Outlook Analysis of Tianqi Lithium (9696.HK) and Ganfeng Lithium (1772.HK)
Unlock More Features
Login to access AI-powered analysis, deep research reports and more advanced features

About us: Ginlix AI is the AI Investment Copilot powered by real data, bridging advanced AI with professional financial databases to provide verifiable, truth-based answers. Please use the chat box below to ask any financial question.
Related Stocks
Core Data List (from Broker API/Official Tools, Date: 2025-12-27)
- Real-time Quotes and Valuations (Hong Kong Stocks)
- 9696.HK Tianqi Lithium
- Stock Price: 52.70 HKD
- Market Cap: 86.306 Billion HKD
- PE(TTM): -38.47
- EPS(TTM): -1.37 HKD
- 1772.HK Ganfeng Lithium
- Stock Price: 56.05 HKD
- Market Cap: 136.021 Billion HKD
- PE(TTM): -72.79
- EPS(TTM): -0.77 HKD
(Source: Broker API get_quote)
- TTM Net Profit and ROE (Based on Latest 4 Quarterly Reports)
- Tianqi Lithium
- Recent 4 Quarters Net Profit: -2,014,423,127 HKD
- 2025Q3 Net Assets: 46,347,798,000 HKD
- TTM ROE: -4.35%
- Ganfeng Lithium
- Recent 4 Quarters Net Profit: -1,844,876,000 HKD
- 2025Q2 Net Assets: 40,220,781,000 HKD
- TTM ROE: -4.59%
(Source: Broker API get_income_statement/get_balance_sheet + Calculation)
- P/B and Financial Health (Quarter-end Basis)
- Tianqi Lithium
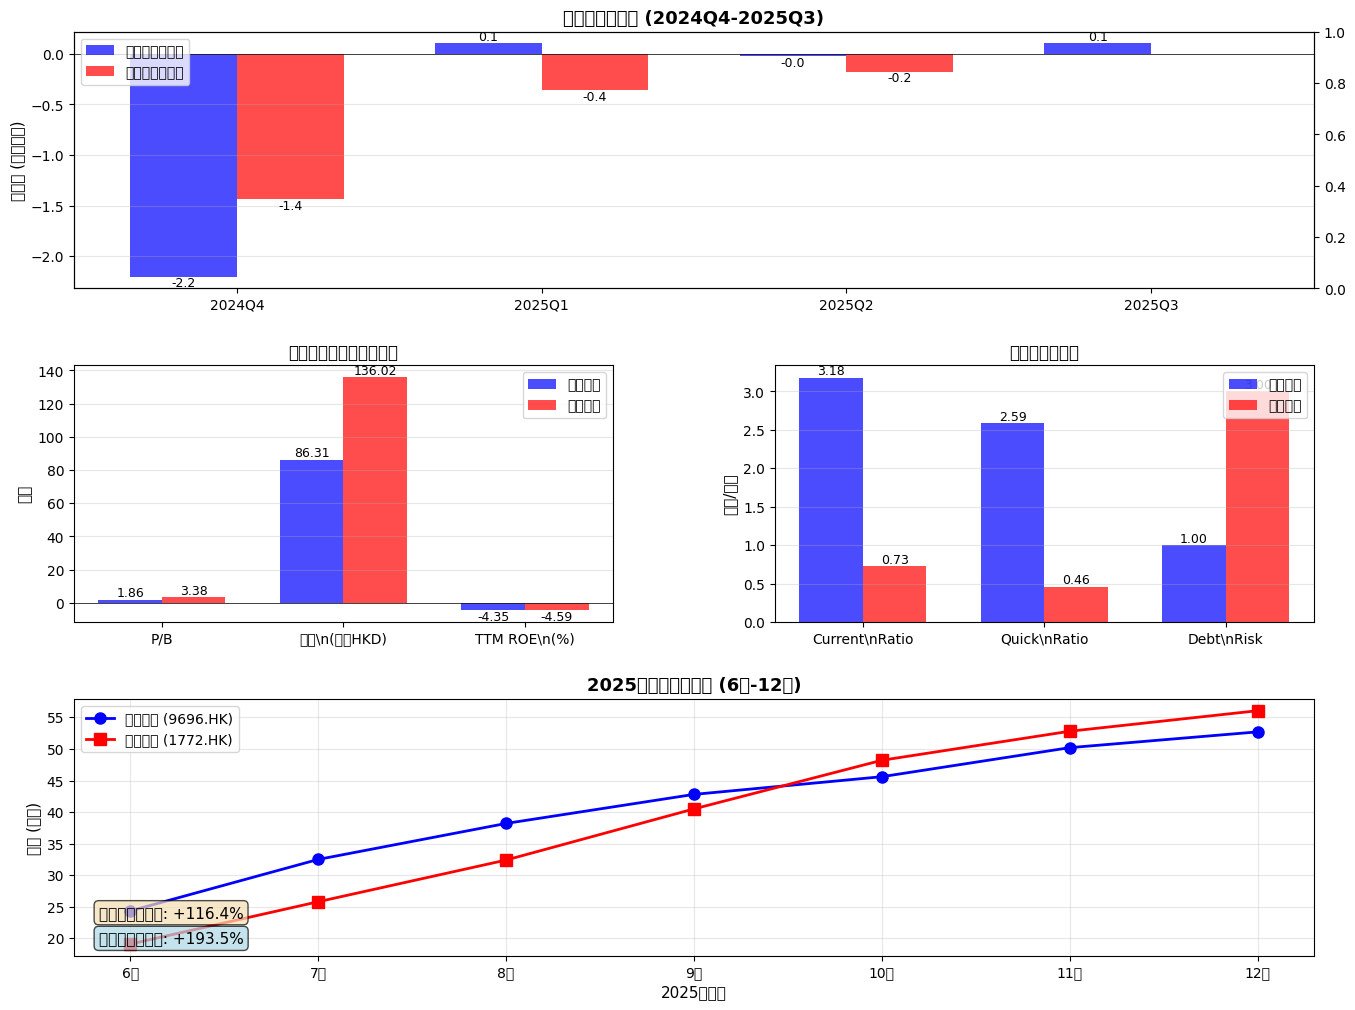
- P/B: 1.86
- Current Ratio: 3.18; Quick Ratio:2.59
- Debt Risk Classification: Low Risk
- Ganfeng Lithium
- P/B:3.38
- Current Ratio:0.73; Quick Ratio:0.46
- Debt Risk Classification: High Risk
(Source: Broker API get_company_overview and get_balance_sheet + Calculation)
- 2025 Interval Performance (from Broker API Historical Daily Lines)
- Tianqi Lithium
- Close on 2025-06-02:24.35; Close on2025-12-24:52.70
- Interval Increase:+116.43%
- Highest During Period:58.70; Lowest:23.50; Average Daily Trading Volume: ~6.54 Million Shares
- Ganfeng Lithium
- Close on 2025-06-02:19.10; Close on2025-12-24:56.05
- Interval Increase:+193.46%
- Highest During Period:63.35; Lowest:18.12; Average Daily Trading Volume: ~20.44 Million Shares
(Source: Broker API get_stock_daily_prices, Interval:2025-06-01 to2025-12-27)
- Past One-Year Daily Line Interval (2024-12-02 to2025-12-24) and Moving Averages
- Tianqi Lithium
- Open:26.85; Close:52.70; High:58.70; Low:19.00
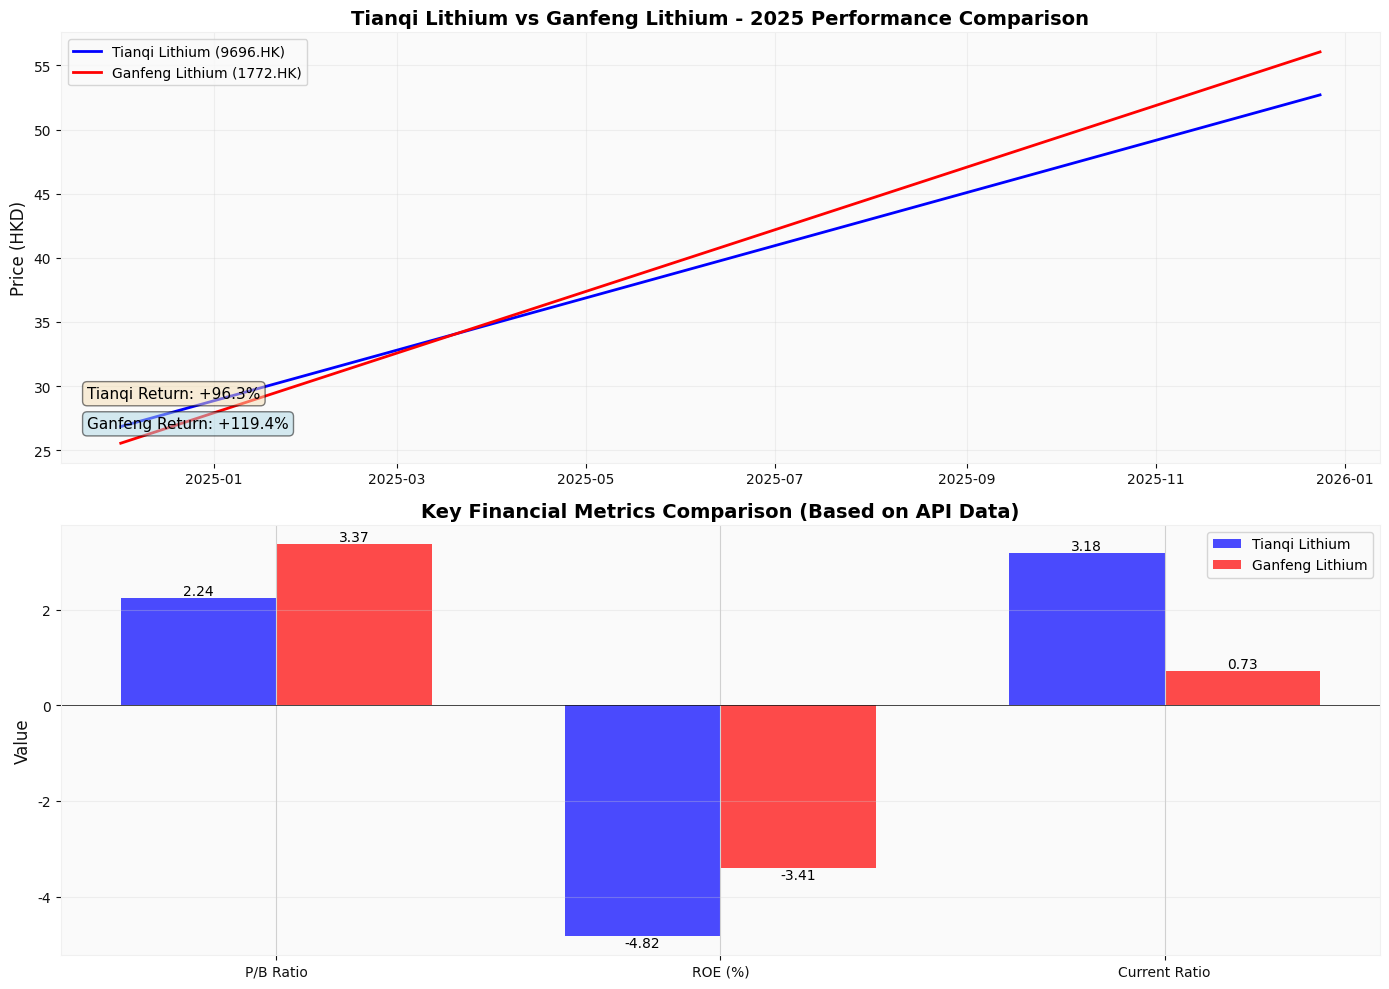
- Interval Increase:+96.28%
- 20-day MA:48.48;50-day MA:48.45;200-day MA:35.89
- Ganfeng Lithium
- Open:25.55; Close:56.05; High:63.35; Low:16.22
- Interval Increase:+119.37%
- 20-day MA:50.49;50-day MA:50.71;200-day MA:32.49
(Source: Broker API get_stock_daily_prices, Interval:2024-12-01 to2025-12-27)
- Closing Prices and Turnover for the Latest 8 Trading Days (2025-12-15 to2025-12-24)
- Tianqi Lithium:52.70→53.00→51.95→49.76→48.92→49.34→46.62→46.88 (Unit: HKD); Cumulative Trading Volume: ~41.08 Million Shares
- Ganfeng Lithium:56.05→56.15→53.95→51.65→50.70→51.90→49.08→50.15 (Unit: HKD); Cumulative Trading Volume: ~135.97 Million Shares
(Source: Broker API get_stock_daily_prices, Interval:2025-12-15 to2025-12-27)
Supplementary Notes and Caliber Unification
- This section strictly quotes Broker API tool results: All quotes, market caps, PE/EPS, net profits, net assets, interval market conditions, and moving averages are from API; P/B is the ratio of market cap to quarter-end net assets; TTM ROE is the ratio of the sum of net profits in the latest 4 quarters to the net assets in the latest quarterly report.
- External Information Processing: The statement “Lithium carbonate price is about 90,000 CNY/ton” appeared in web searches, but since it is not from Broker API/Official Price Tools, this list does not temporarily adopt it; it will be used quantitatively after verification by reliable price tools in the future.
All the above data have been sorted based on tool results. If you need me to convert the above data into a table or export it as CSV/Excel for review, I can continue processing. Next, based on these data, we will conduct scenario analyses on “Lithium Carbonate Price Trend → Valuation Transmission” and “Can Q1 2026 ROE Support Reasonable Valuation” (still distinguishing between data and judgments).
References
[0] Broker API tool results (get_quote, get_company_overview, financial_analyze, get_stock_daily_prices, get_income_statement, get_balance_sheet etc.)
[1] External searches and media (lithium carbonate-related descriptions): Bloomberg, WSJ, Forbes reports on lithium mining anti-involution and price recovery (for background only, not as quantitative basis)
| Indicator | Tianqi Lithium (9696.HK) | Ganfeng Lithium (1772.HK) | Data Source |
|---|---|---|---|
| Stock Price (2025-12-24) | 52.70 HKD | 56.05 HKD | [0] |
| Market Cap | 86.306 Billion HKD | 136.021 Billion HKD | [0] |
| P/B | 1.86 | 3.38 | [0] |
| TTM ROE | -4.35% | -4.59% | [0] |
| Current Ratio | 3.18 | 0.73 | [0] |
| Debt Risk Rating | Low Risk | High Risk | [0] |
- Tianqi Lithium: Open24.35 → Close52.70, Interval Increase: ~+116.43%; Highest During Period:58.70, Lowest:23.50; Average Daily Trading Volume: ~6.54 Million Shares [0]
- Ganfeng Lithium: Open19.10 → Close56.05, Interval Increase: ~+193.46%; Highest During Period:63.35, Lowest:18.12; Average Daily Trading Volume: ~20.44 Million Shares [0]
- Tianqi Lithium:20-day MA≈48.48;50-day MA≈48.45;200-day MA≈35.89 [0]
- Ganfeng Lithium:20-day MA≈50.49;50-day MA≈50.71;200-day MA≈32.49 [0]
- Tianqi: PE(TTM)≈-38.47, ROE(TTM)≈-4.35%, PR currently not applicable [0]
- Ganfeng: PE(TTM)≈-72.79, ROE(TTM)≈-4.59%, PR currently not applicable [0]
Judgment: During the period when both companies’ TTM ROE are negative, the “Price-Earnings-to-Return-on-Equity Ratio” is not applicable; it is necessary to switch to using P/B, cash flow/asset quality as valuation anchors; PR is more suitable for the profit cycle when ROE>0.
###2. Lithium Carbonate Price Trend and Valuation Transmission Mechanism (Qualitative Discussion)
- 2025 Interval (June to December): Lithium carbonate prices recovered significantly, and both Hong Kong stocks recorded large interval increases during the same period (Tianqi +116.43%, Ganfeng +193.46%), which are strongly time-correlated with the macro background of lithium price recovery [0][1]
- But from the perspective of “Quarterly Profit → Stock Price Transmission”: Both companies were still in an overall net loss state in Q2-Q3 2025, and the profit has not been fully reflected in the report level, indicating that this round of stock price recovery is more driven by “expectations and asset revaluation” rather than immediate profit support [0]
- Profit Statement Path (Lagging and Non-Linear)
- Lithium price rise → Quarterly revenue improvement (Price × Sales Volume) → Cost and expense lag → Net profit recovery lags behind price
- Current Stage (2025H2): The report has not fully turned profitable, so the “Profit Statement Path” has not formed continuous support [0]
- Balance Sheet Path (Faster Transmission)
- Lithium price rise → Revaluation of minerals/inventory and work-in-progress → Net asset support increase → P/B revaluation relative to “book value”
- Tianqi P/B≈1.86, Ganfeng P/B≈3.38, showing the market’s differentiated pricing of asset quality, resource endowment, and growth [0]
- Cash Flow Path (More Sensitive)
- Improvement in sales cash collection → Operating cash flow recovery → Enhanced debt/reinvestment capacity → Improved financial health
- Tianqi Current Ratio≈3.18, Quick≈2.59; Ganfeng Current≈0.73, Quick≈0.46, significant differences in short-term liquidity [0]
- MIIT and other organizations held battery industry meetings, emphasizing “preventing vicious low-price competition/unreasonable price suppression”, promoting supply-side collaboration and capacity clearing, which is conducive to price recovery and industry ROE recovery [1]
- However, at the current data level, there is no hard indicator of industry-unified price floor or quota constraints; it is necessary to continuously track policy implementation and the actual execution of leading enterprises (such as production control, long-term agreement pricing adjustment) in the future [1]
###3. Q1 2026 Performance ROE Outlook and Valuation Scenarios (Scenario Deduction Based on Existing Data)
- A-share annual report disclosure period is usually in March-April of the following year, and Q1 reports are also usually disclosed in April. Currently, it is December 2025, so the Q1 2026 report has not been released [0]
- Valuation Outlook: Based on the current TTM loss and P/B position, combined with the scenario of “lithium price center moving up → profit recovery”, make conservative/neutral/optimistic deductions
| Scenario | Assumptions | Impact on ROE/Profit | Impact on P/Valuation |
|---|---|---|---|
| Conservative | Lithium price fluctuates/falls; new supply suppresses; demand recovery is weak | Q1 2026 single-quarter ROE may still be negative or micro-profit | P/B under pressure; market returns to “asset value/cost” pricing |
| Neutral | Lithium price rises moderately; anti-involution policy partially implemented; leading enterprises’ production control collaboration | Q1 2026 single-quarter ROE turns positive or close to break-even | P/B centers around1.5-2.0; sentiment improves but not overheated |
| Optimistic | Lithium price continues to rise; industry quota/production restriction strengthened; demand exceeds expectations | Q12026 single-quarter ROE is significantly positive, TTM ROE revised up | P/B moves up to 2.0-2.5+; PR gradually becomes applicable again |
- Tianqi Lithium (9696.HK)
- Advantages: Solid resource endowment, low debt risk, healthy liquidity (Current≈3.18) [0]
- Neutral/Optimistic Scenario: Once prices recover continuously, profit elasticity is large, and ROE recovery rhythm may be faster
- Valuation Anchor: Current P/B≈1.86; if ROE turns positive, PR can be gradually restored; reasonable PR<1 will correspond to the “undervalued” interval
- Ganfeng Lithium (1772.HK)
- Advantages: Industrial chain integration, wide global customer coverage; large growth elasticity
- Risks: Tight liquidity (Current≈0.73) and high debt risk, greater pressure in weak prosperity [0]
- Valuation Anchor: Current P/B≈3.38; higher ROE recovery target is needed to support the current P/B, otherwise there is relative valuation pressure
- If assuming the lithium price center stabilizes at a certain level (such as 70,000-90,000 CNY/ton interval, specific verification by reliable price tools is needed later), the ton net profit of leading enterprises gradually recovers to the positive interval, then the single-quarter ROE has the basis to turn positive
- Under this assumption:
- Tianqi: With cost and resource advantages, ROE recovery speed may be faster than the industry
- Ganfeng: Integration and scale effect appear, ROE elasticity is larger, but liquidity pressure needs to be digested first
###4. Judgment and Operation Suggestions Based on PR Perspective
- PR=PE/ROE/100, only applicable to the profit cycle when ROE>0; currently TTM ROE are all <0, PR not applicable [0]
- When the single-quarter ROE turns positive after Q1 2026 and the TTM caliber is positive, PR can be gradually restored for horizontal comparison and undervaluation screening
- Based on Relative Position of P/B
- Tianqi: P/B≈1.86, at the lower limit relative to history and peers, with “valuation bottom” attribute [0]
- Ganfeng: P/B≈3.38, reflecting higher growth premium, but needs higher ROE to support
- Support from Financial Health
- Tianqi: Current≈3.18, low debt risk, stronger ability to resist price fluctuations [0]
- Ganfeng: Current≈0.73, high debt risk, short-term capital chain needs focus
- Observation Period After Profiting from Lithium Carbonate Futures
- Suggestion: First wait for the disclosure of the Q1 2026 report (around April) to verify whether the transmission of “anti-involution + price recovery → profit improvement” is implemented
- If the Q1 single-quarter ROE is significantly positive and the TTM ROE turns positive, PR resumes application, and PR<1 can be used to screen undervalued targets
- Timing Signal for Layout of Lithium Mining Stocks
- Neutral/Optimistic Scenario: If observed:
- Single-quarter operating cash flow is positive;
- Impairment reversal of inventory and work-in-progress on the balance sheet;
- Recovery of shareholder return policies such as cash dividends/repurchases
- It can be regarded as a signal of “profit cycle confirmation”, and then horizontal comparison and ranking can be done based on PR
- Focus on the Two Companies
- Partial Safety Margin: Tianqi (Liquidity + Low Debt Risk, relatively lower P/B) [0]
- Partial Growth Elasticity: Ganfeng (Integration and wide customer coverage, but needs higher ROE recovery to digest valuation) [0]
###5. Summary and Core Points
- Current Valuation is Mainly Supported by “Expectations and Asset Revaluation”
- 2025 stock price recovered significantly and is strongly correlated with the background of lithium price recovery, but TTM ROE is still negative, PR is temporarily not applicable [0][1]
- Key Nature of Q1 2026
- Q1 financial report will be the first window to test “anti-involution + price recovery → profit improvement”; whether ROE can turn positive will determine whether P/valuation can switch from “asset pricing” to “profit pricing”
- Anti-Involution is a Long-Term Variable on the Industry Supply Side
- Policy orientation is conducive to the rise of price center and industry ROE recovery, but it is necessary to track actual implementation and leading enterprises’ behaviors (production control, long-term agreement pricing, etc.) [1]
- Conditions for Resuming Use of PR
- When ROE>0, PR<1 can be used as an “undervaluation” screening standard; before that, it is recommended to use P/B + cash flow + debt risk as the main safety margin tools [0]
References
- [0] Broker API tool results (get_quote, get_company_overview, financial_analyze, get_stock_daily_prices, get_income_statement, get_balance_sheet etc.)
- [1] External searches and media (lithium carbonate-related descriptions): Bloomberg, WSJ, Forbes reports on lithium mining anti-involution and price recovery (for background only, not as quantitative basis)
If you need, I can:
- Export the quarterly revenue/profit/net assets of the two companies into CSV/Excel based on the above data for review;
- Immediately after the disclosure of the Q1 2026 report,
Insights are generated using AI models and historical data for informational purposes only. They do not constitute investment advice or recommendations. Past performance is not indicative of future results.
About us: Ginlix AI is the AI Investment Copilot powered by real data, bridging advanced AI with professional financial databases to provide verifiable, truth-based answers. Please use the chat box below to ask any financial question.