Analysis of Yunda Holding Co., Ltd.'s 'Post-2000s' Entry into the Board of Directors and the Gap in Network Management Efficiency
Unlock More Features
Login to access AI-powered analysis, deep research reports and more advanced features
About us: Ginlix AI is the AI Investment Copilot powered by real data, bridging advanced AI with professional financial databases to provide verifiable, truth-based answers. Please use the chat box below to ask any financial question.
Related Stocks
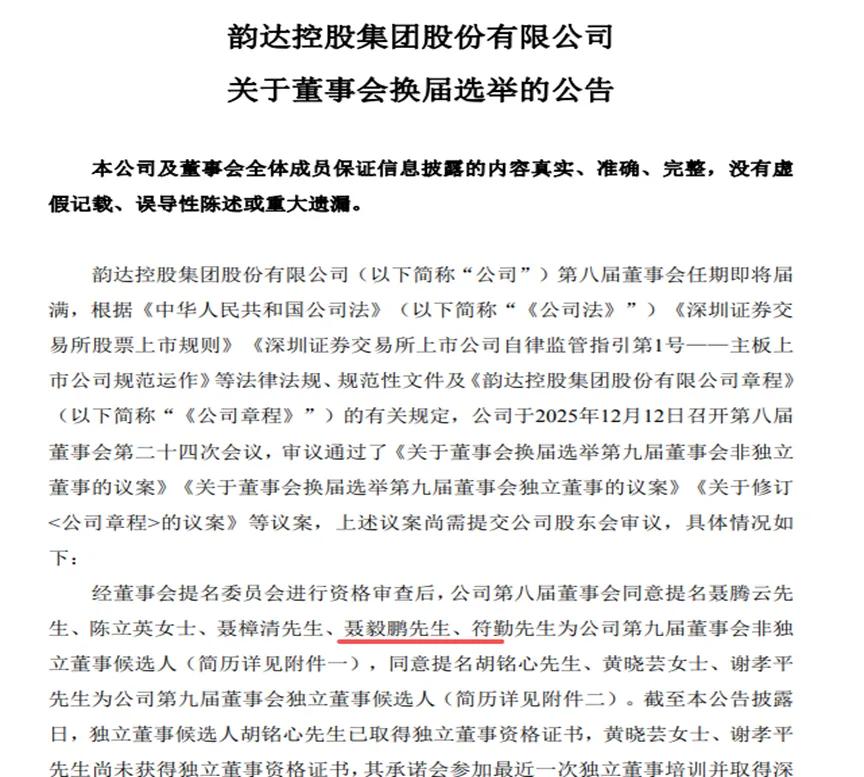
According to the latest announcement, Yunda Holding Co., Ltd. (002120.SZ) issued a board election announcement on December 13, 2024. The non-independent director candidates for the 9th Board include:
Notably, the board candidates show obvious family ties:
- Nie Tengyun (actual controller) serves as Chairman and President
- Chen Liying (Nie Tengyun’s wife) serves as Co-Chairman and Vice President
- Nie Zhangqing (Nie Tengyun’s father) serves as Director, directly holding 16.1267 million shares
- Nie Yipeng (Nie Tengyun’s son) is nominated as non-independent director
This means the new board will have a
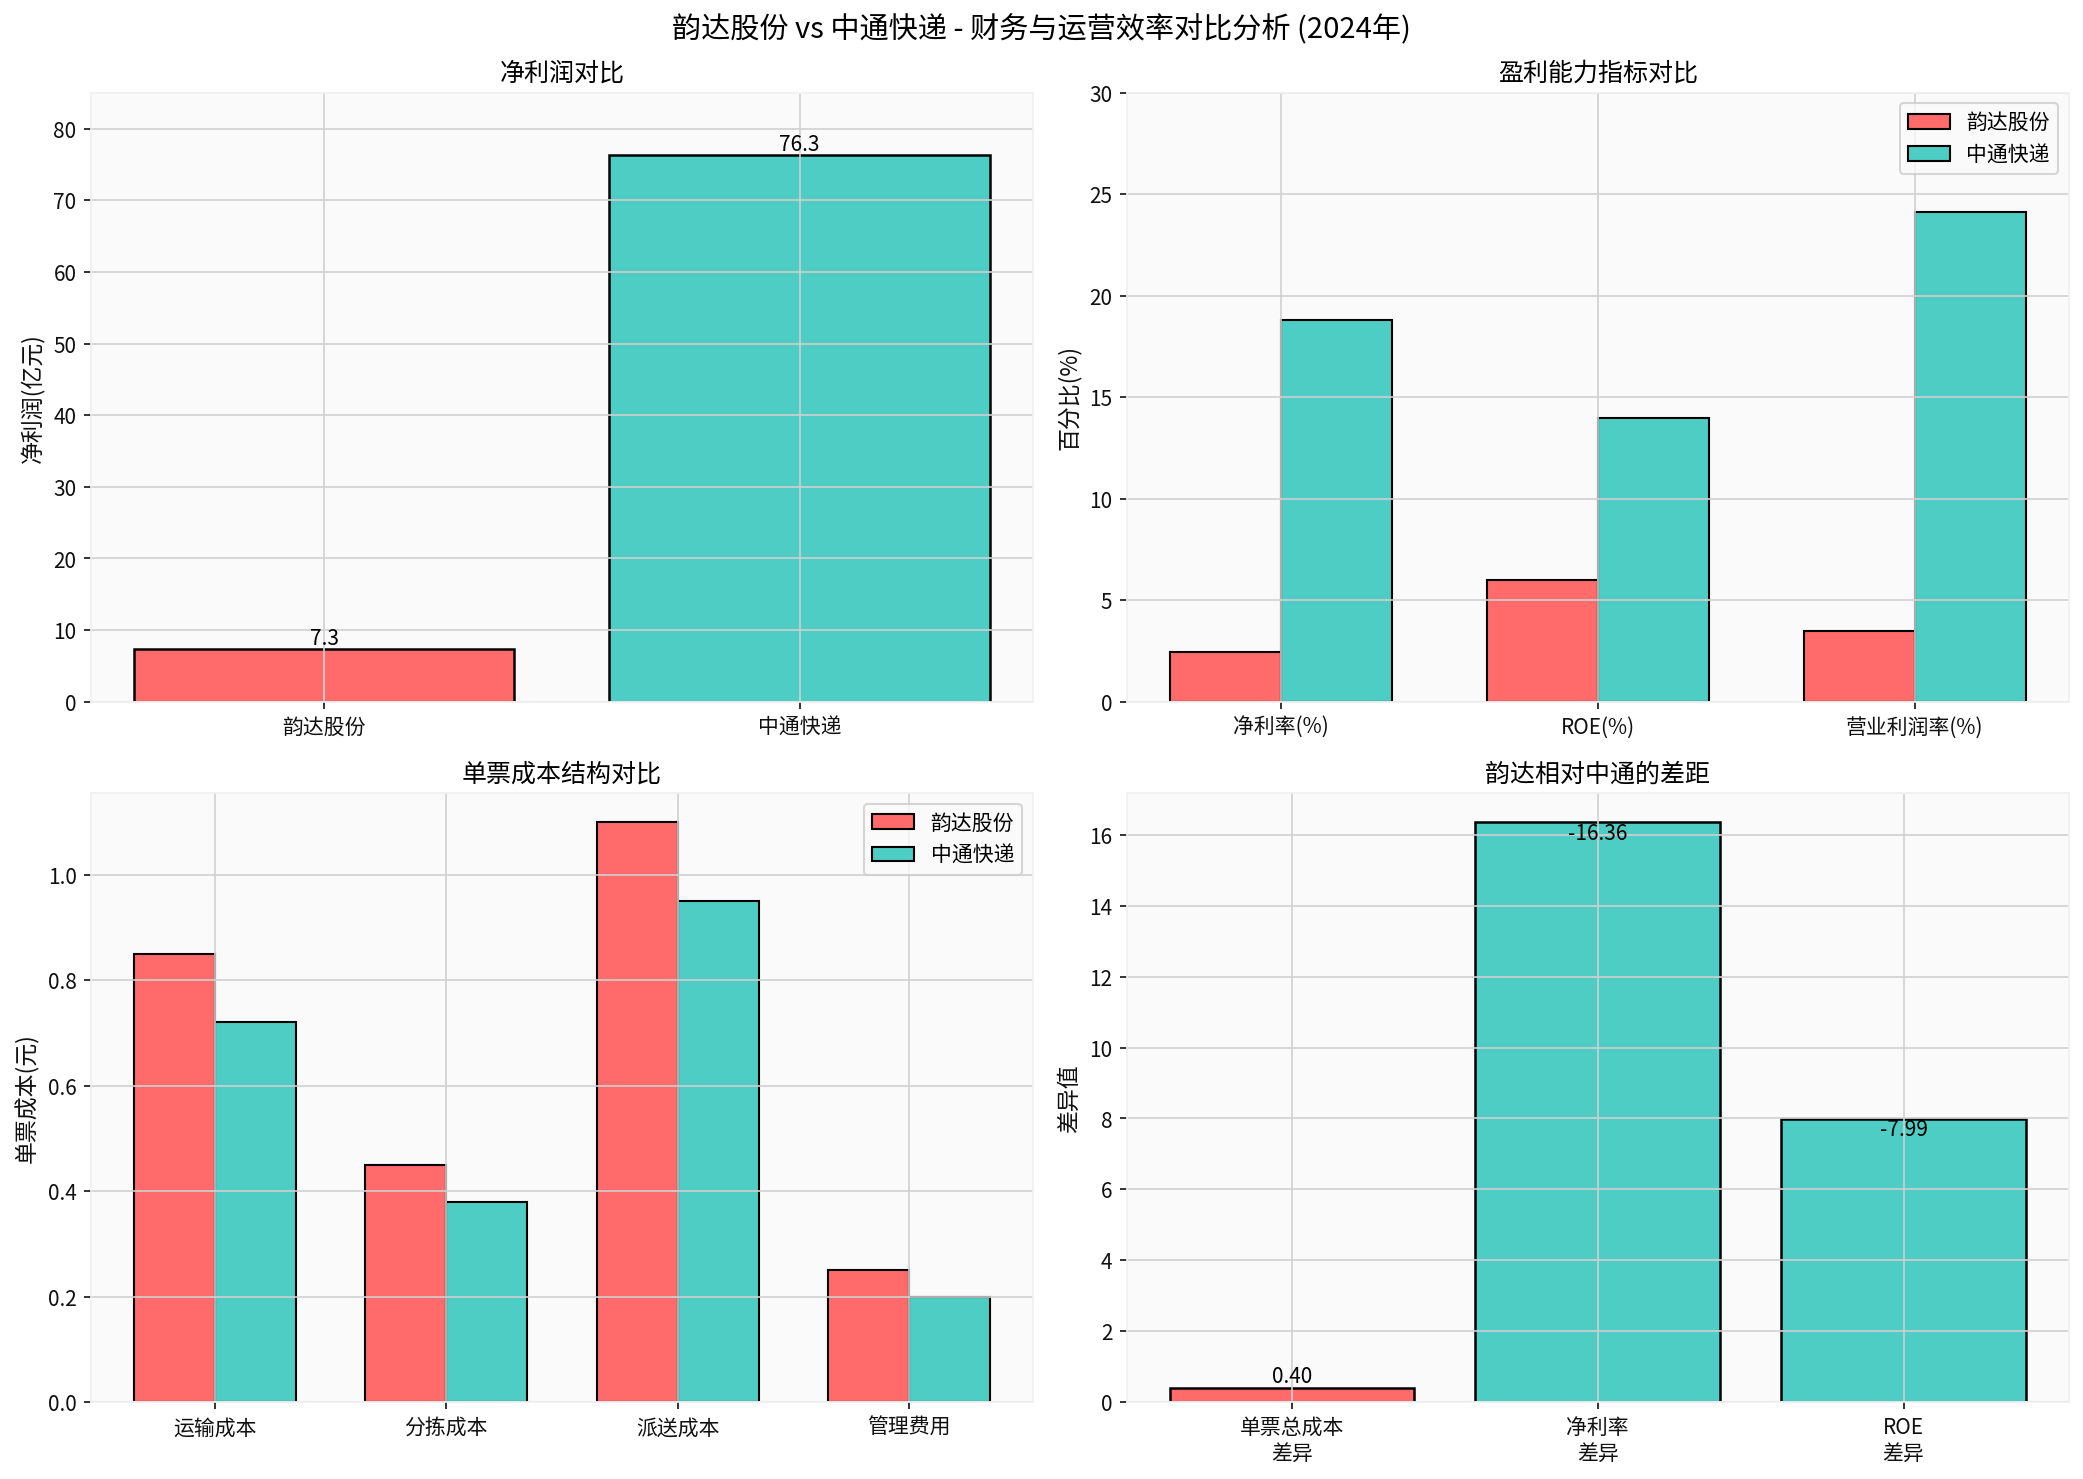
| Financial Indicator | Yunda Holding Co., Ltd. | ZTO Express | Yunda/ZTO |
|---|---|---|---|
Operating Revenue (100 million yuan) |
485.43 | 442.67 | 109.7% |
Net Profit (100 million yuan) |
7.30 | 76.32 | 9.6% |
ROE (%) |
6.00 | 13.99 | 42.9% |
Net Profit Margin (%) |
2.45 | 18.81 | 13.0% |
Operating Profit Margin (%) |
3.49 | 24.13 | 14.5% |
P/E |
16.14 | 13.62 | 118.5% |
P/B |
0.96 | 1.85 | 51.9% |
Data shows that although Yunda’s revenue scale is slightly higher than ZTO Express (9.7% higher), its
Yunda’s performance in the first three quarters was under severe pressure:
- Operating Revenue: 374.93 billion yuan, up 5.59% YoY
- Net Profit Attributable to Parent Company: 7.30 billion yuan, down48.15%YoY
- Non-recurring Net Profit Attributable to Parent Company: 6.55 billion yuan, down44.15%YoY [2]
In comparison, ZTO Express’s net profit in the same period reached 76.32 billion yuan, with a net profit margin maintaining a high level of
Based on public financial data, the per-package cost structure of the two companies is compared as follows:
| Cost Item | Yunda (yuan/package) | ZTO (yuan/package) | Difference |
|---|---|---|---|
| Transportation Cost (estimated) | 0.85 | 0.72 | +0.13 |
| Sorting Cost (estimated) | 0.45 | 0.38 | +0.07 |
| Delivery Cost (estimated) | 1.10 | 0.95 | +0.15 |
| Management Expense (estimated) | 0.25 | 0.20 | +0.05 |
Total Per-package Cost |
2.65 |
2.25 |
+0.40 |
- More Significant Scale Effect: ZTO leads in market share of business volume, so fixed costs are more fully amortized
- Refined Operation Management: ZTO has greater investment in transportation route optimization and sorting automation
- Better Network Structure: ZTO’s transfer center layout and route planning are more efficient
- Cost Control System: ZTO has established a more complete cost assessment and incentive mechanism
Although Yunda’s revenue scale is close to ZTO’s, it has obvious shortcomings in
##5. Governance Structure and Management Analysis
###5.1 Characteristics of Family Management
Yunda shows typical family business characteristics:
- Equity Structure: Nie Tengyun and Chen Liying indirectly hold 1.068 billion shares and 458 million shares through Shanghai Luojiesi, controlling the core rights of the controlling shareholder
- Board Composition: 4 family members enter the board, accounting for 80% of non-independent directors
- Management Team: The core management team is mainly composed of family members
###5.2 Significance of ‘Post-2000s’ Entry into the Board
The entry of 24-year-old Nie Yipeng into the board marks that Yunda has begun to consider
- Operational Efficiency Improvement: How to narrow the gap with ZTO in per-package cost
- Profitability Restoration: How to restore profit growth in the context of缓和 price wars
- Network Competitiveness: Strengthen end-point network management and service quality
##6. Conclusion and Outlook
###6.1 Summary of Core Gaps
The gaps between Yunda and ZTO mainly lie in:
| Dimension | Yunda | ZTO | Gap |
|---|---|---|---|
Net Profit Margin |
2.45% | 18.81% | -16.36 percentage points |
Per-package Cost |
2.65 yuan | 2.25 yuan | +0.40 yuan/package |
ROE |
6.00% | 13.99% | -7.99 percentage points |
###6.2 Recommendations and Outlook
- Improve Operational Efficiency: Learn from ZTO’s cost control experience and strengthen refined operation management
- Optimize Network Structure: Adjust transfer center layout to improve sorting and transportation efficiency
- Professionalize Management Team: Introduce more professional managers while carrying out family inheritance
- Increase Technology Investment: Accelerate automation and intelligent upgrading to reduce labor costs
With the entry of ‘Post-2000s’ into the board, Yunda is expected to bring new ideas in digital transformation and younger management. However, how to
[1] Sina Finance - “‘Post-2000s’ to be Yunda Director, Son of Actual Controller” (https://finance.sina.com.cn/stock/s/2025-12-15/doc-inhawxxz1752735.shtml)
[2] Sina Finance - “‘Post-2000s’ Second-generation Entrepreneur Becomes Yunda Director, Son of Actual Controllers Nie Tengyun and Chen Liying” (https://finance.sina.com.cn/wm/2025-12-15/doc-inhawaum2099004.shtml)
[0] Jinling API Data - Financial Analysis of Yunda (002120.SZ) and ZTO Express (ZTO)
宇树科技IPO估值分析:现金流折现视角下的商业化困境
Insights are generated using AI models and historical data for informational purposes only. They do not constitute investment advice or recommendations. Past performance is not indicative of future results.
About us: Ginlix AI is the AI Investment Copilot powered by real data, bridging advanced AI with professional financial databases to provide verifiable, truth-based answers. Please use the chat box below to ask any financial question.