2024-2025 A-Shares vs U.S. Stocks Market Analysis: Derivatives, Institutionalization, and Slow Bull
Unlock More Features
Login to access AI-powered analysis, deep research reports and more advanced features

About us: Ginlix AI is the AI Investment Copilot powered by real data, bridging advanced AI with professional financial databases to provide verifiable, truth-based answers. Please use the chat box below to ask any financial question.
Based on the currently available data (cumulative returns, volatility, drawdowns, and proportion of extreme volatility days for A-shares and U.S. stocks from 2024 to 2025), here is a systematic analysis of your question:
-
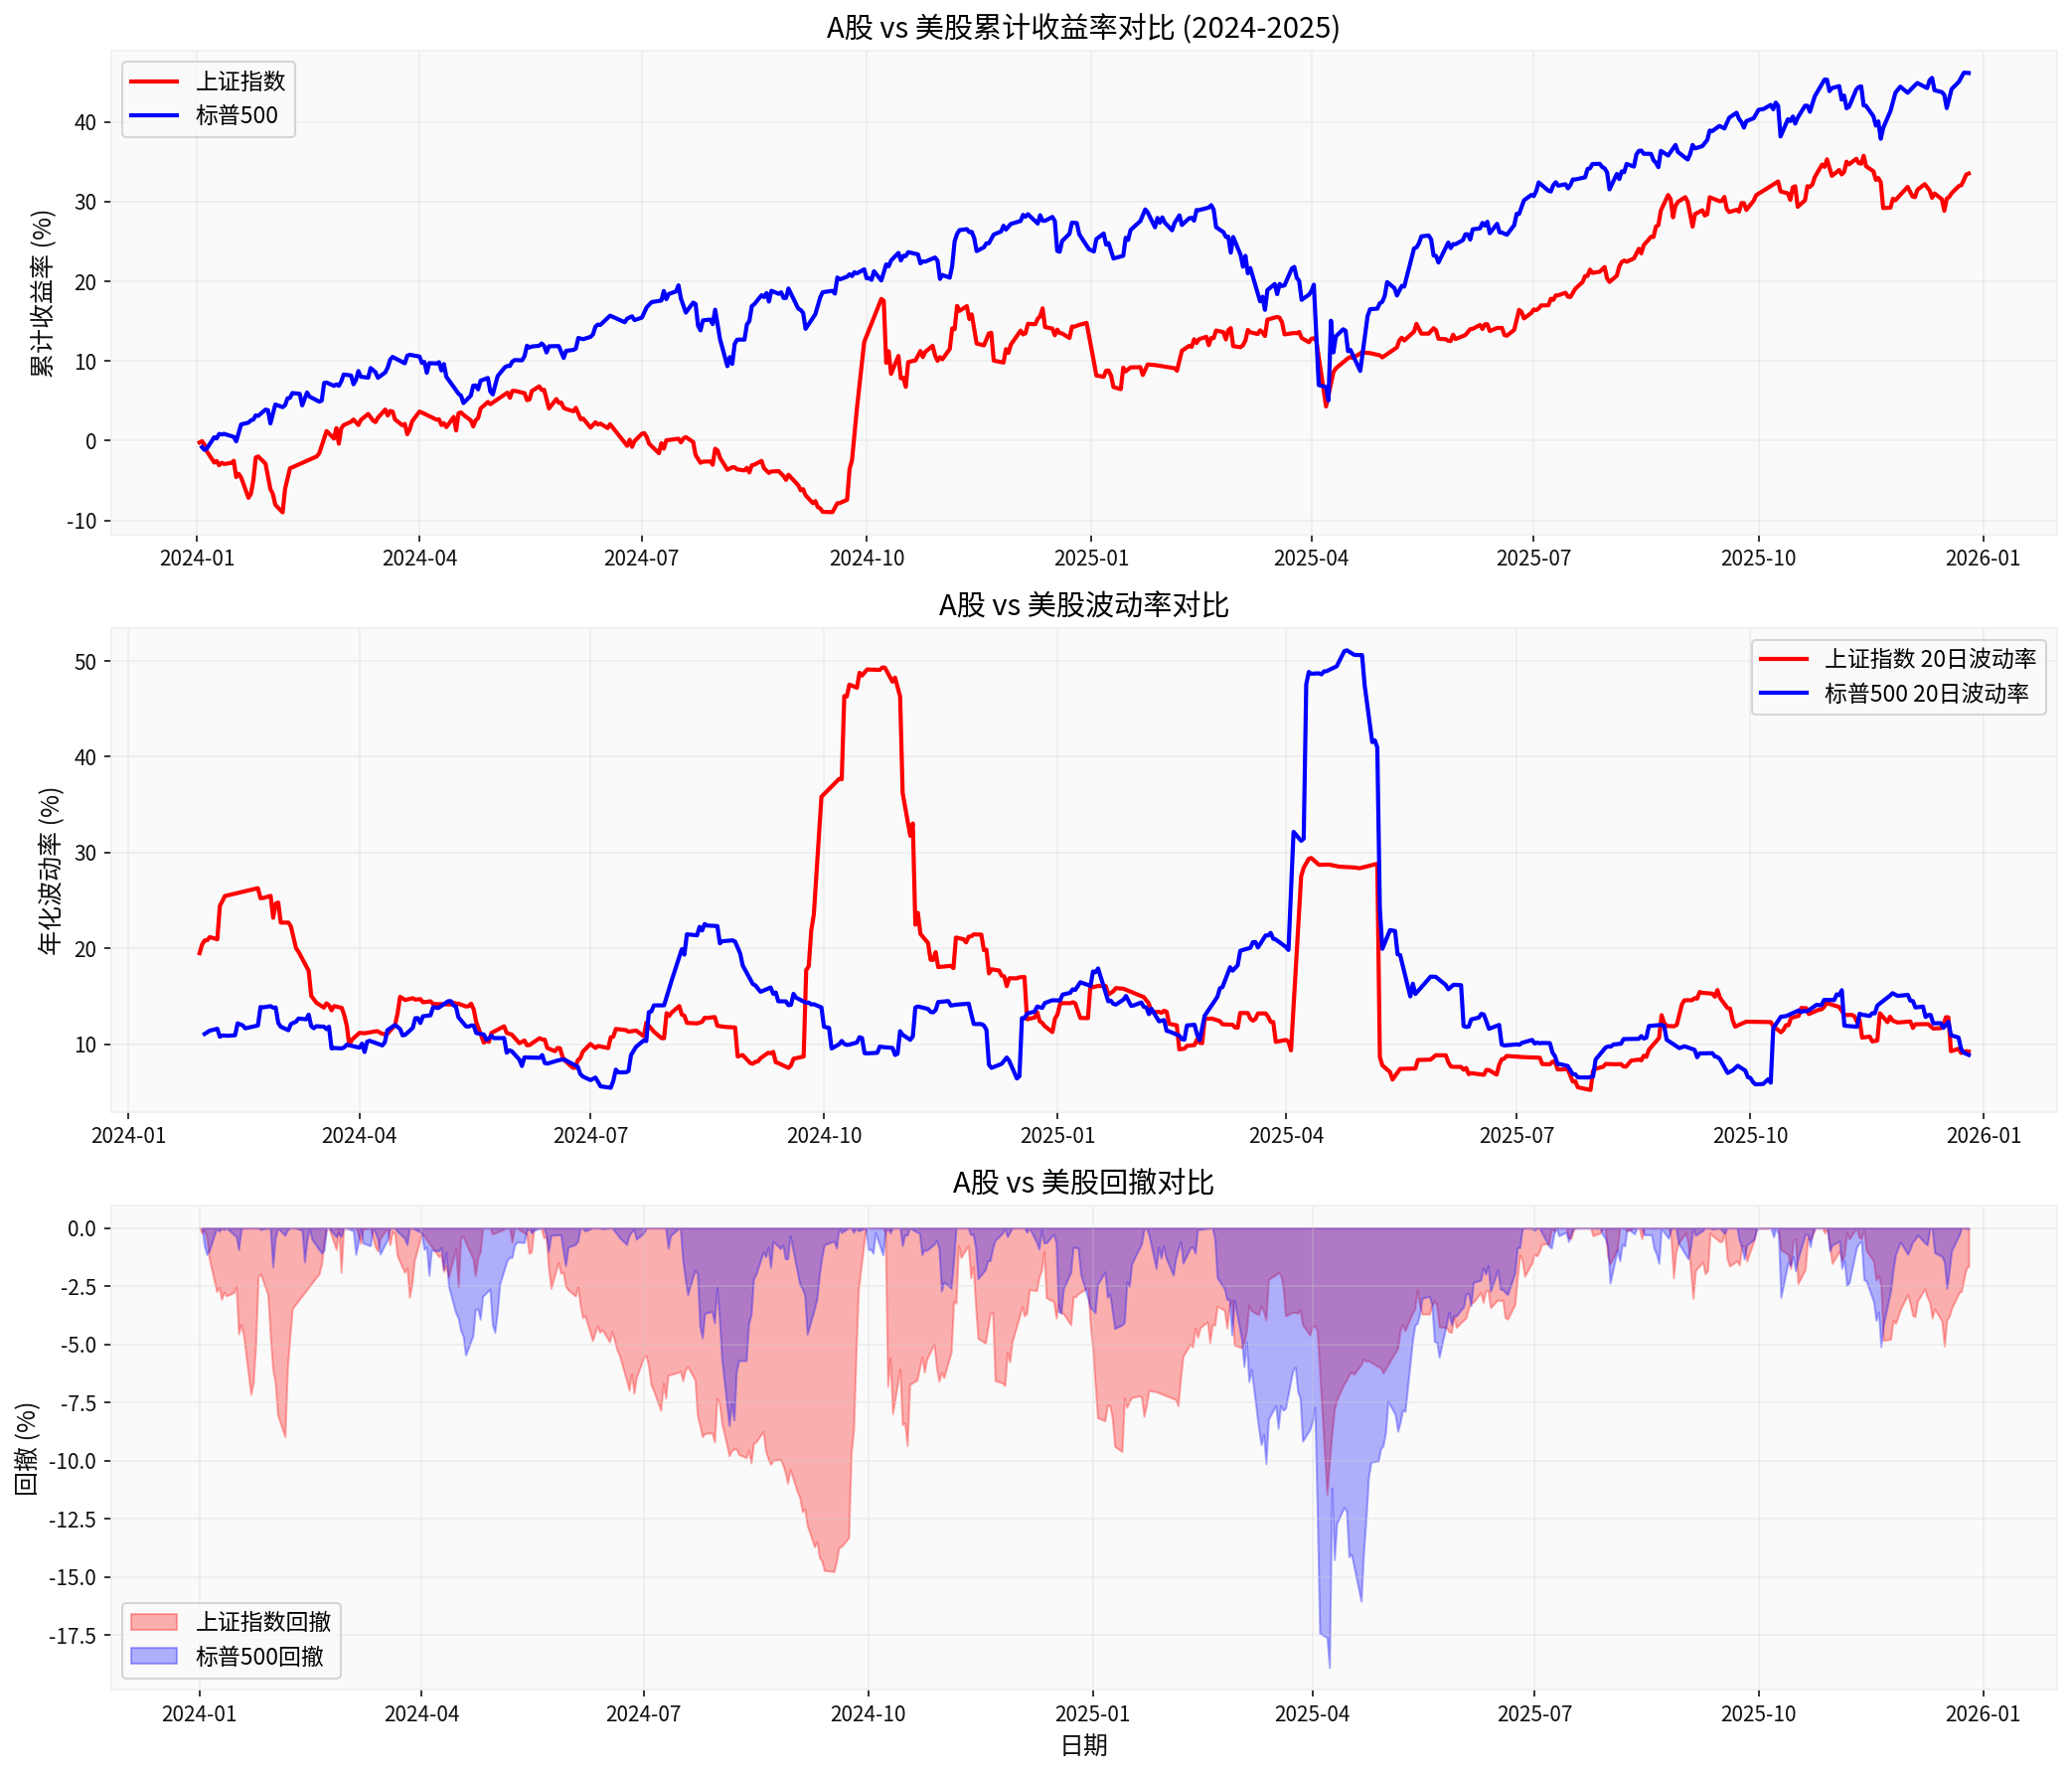
Observed market characteristics (2024-2025) [0]:
- The annualized volatility of the Shanghai Composite Index is approximately 17.03%, and that of the S&P 500 is approximately 16.01%.
- The maximum drawdown of the Shanghai Composite Index is approximately -14.77%, and that of the S&P 500 is approximately -18.90%.
- The proportion of days with gains for the Shanghai Composite Index is approximately 53.7%, and for the S&P 500 it’s approximately 57.5%.
- Proportion of extreme volatility days (daily change > ±2%): Shanghai Composite ~4.7%, S&P 500 ~4.0%.
- See figure: A-Shares vs U.S. Stocks Cumulative Returns, Volatility, and Drawdown Comparison [0]:
-
Preliminary judgment on whether derivatives expansion and institutionalization drive the “slow bull”:
- The above quantitative evidence only reflects price and volatility performance, and does not directly provide key indicators such as “derivatives expansion level (e.g., stock index futures, ETF options positions and trading volume)” or “institutional investor proportion, position structure, and turnover rate”. Therefore, it is currently impossible to directly confirm the causal relationship between these two factors and the formation of the “slow bull” based on existing data.
- The introduction of institutionalization and derivatives usually affects market pricing efficiency and volatility structure through risk management tools and arbitrage/hedging activities. However, whether they form a slow bull pattern of “gradual rise and sharp fall” depends on comprehensive factors such as changes in liquidity and risk appetite, regulatory and institutional design, and capital structure (e.g., the pace of long-term capital entering the market).
- From the existing price and volatility comparison, A-shares have slightly higher volatility and a higher proportion of extreme volatility days during the observation period, which differs from the performance of U.S. stocks during the same period, but this is not sufficient to attribute to derivatives or institutionalization levels.
-
Key hypotheses requiring further verification (data supplementation needed):
- Quantification of derivatives market expansion level (positions, trading volume, turnover rate, basis, and frequency of contango/backwardation, etc.);
- Institutional investor proportion and changes in their position holding period;
- Microstructure factors such as turnover rate, leverage, and capital inflows/outflows;
- Impact of new products (e.g., ETF options) on market microstructure and risk transmission paths after their launch.
-
Recommended data supplementation and next steps:
- If detailed data on stock index futures and ETF options contract positions and trading volume, institutional position proportion, and turnover rates of A-shares and U.S. stocks can be obtained, it can be used for more rigorous causal inference and robustness testing;
- It is recommended to test the explanatory power of “derivatives expansion indicators” and “institutionalization indicators” on the following outcomes after obtaining the above data:
- Time-series changes in volatility;
- Frequency of tail risk (extreme negative return days);
- Market liquidity and impact cost;
- Cumulative return path (rhythm and magnitude of gradual rise/sharp fall).
-
Preliminary conclusions under limited evidence (subject to subsequent verification):
- Current data cannot support the conclusive conclusion that “derivatives expansion and institutionalization will inevitably drive the slow bull in A-shares”.
- These two factors may have a positive impact on market stability by improving risk management and price discovery, but whether they can evolve into a slow bull pattern of “gradual rise and sharp fall” depends on the coordination of multiple factors such as the macro environment, capital structure, and supporting regulatory measures.
If you need to enter the in-depth investment research mode, you can further supplement more granular derivatives and institutional position data (including contract-level and segmented institutional types) to build a more rigorous empirical testing framework.
[0] Gilin API Data (Daily data of Shanghai Composite Index and S&P 500 Index from 2024 to 2025, and calculation of volatility and drawdown)
Insights are generated using AI models and historical data for informational purposes only. They do not constitute investment advice or recommendations. Past performance is not indicative of future results.
About us: Ginlix AI is the AI Investment Copilot powered by real data, bridging advanced AI with professional financial databases to provide verifiable, truth-based answers. Please use the chat box below to ask any financial question.