Institutionalization of A-shares and Derivatives Market Improvement: Reshaping of Market Volatility Characteristics and Analysis of the Possibility of a Slow Bull Market
Unlock More Features
Login to access AI-powered analysis, deep research reports and more advanced features
About us: Ginlix AI is the AI Investment Copilot powered by real data, bridging advanced AI with professional financial databases to provide verifiable, truth-based answers. Please use the chat box below to ask any financial question.
Related Stocks
Based on trading data [0], I conducted a systematic comparative analysis of the volatility characteristics of A-shares and U.S. stocks:
- S&P 500 daily volatility is 1.009%, Nasdaq is 1.352%
- Among A-share samples: Ping An Bank (1.382%), Kweichow Moutai (1.447%), Wuliangye (1.772%)
- A-share individual stock volatility is generally about 30%–75% higher than U.S. stock indices [0]
- S&P 500 had only 5 extreme volatility days (daily change >3%)
- Nasdaq had 13 days
- Ping An Bank had 15 days, Kweichow Moutai had 16 days, Wuliangye had 32 days
- The frequency of extreme fluctuations in A-shares is 2–6 times that of U.S. stocks [0]
- S&P 500 maximum drawdown: 18.90%
- Nasdaq: 24.32%
- Ping An Bank:16.93%, Kweichow Moutai:28.76%, Wuliangye:33.39%
- A-share drawdown magnitude is generally larger than U.S. stocks (Note: There is a large difference in sample structure; indices and individual stocks should not be simply compared) [0]
- S&P 500 rose by 46.11%, Nasdaq rose by59.78%
- Ping An Bank rose by 25.30%, Kweichow Moutai fell by16.08%, Wuliangye fell by19.28%
- U.S. stocks showed a broad-based slow bull, while A-shares showed significant structural differentiation [0]
###1. Positive Impact of Institutionalization Process
- Reduce volatility: Institutional holdings have a relatively longer cycle, reducing short-term speculative transactions
- Enhance stability: Value investment philosophy is gradually strengthened
- Optimize resource allocation: Capital concentrates on high-quality enterprises
- Improve pricing mechanism: Weight of fundamental factors increases
###2. Double-edged Sword Effect of Derivatives Market
- Hedging tools: Provide risk management means for institutions, reducing position risk exposure
- Price discovery: Signals such as futures backwardation reflect market expectations (e.g., the phenomenon of long-term backwardation in CSI 500/1000 futures mentioned in the post) [1]
- Liquidity improvement: Arbitrage transactions enhance market efficiency
- Programmed trading: May amplify short-term volatility in specific situations
- Increased correlation: Market homogenization may rise
- Stampede risk: Chain reaction of concentrated liquidation or hedging positions in extreme cases
- Increased complexity: Higher threshold for understanding derivatives may exacerbate information and strategy asymmetry
###3. Prudent Evaluation of Matters Involved in the Post
- Long-term backwardation of CSI500/1000 stock index futures: The post points out this phenomenon [1]. Backwardation reflects hedging costs and market expectations, but it is not necessarily directly equivalent to “systematic suppression”; instead, it is the result of market structure and supply-demand game. If long-term backwardation continues, it may affect long sentiment and index performance.
- Competition for A500ETF option issuance rights: The post mentions that securities firms compete for issuance rights and institutions use derivatives for hedging [1]. Mechanically, more abundant option varieties help improve hedging and price discovery, but the impact of short-term changes in trading structure on market volatility depends on participant structure, contract liquidity, risk control and regulatory support. There is no sufficient evidence to conclude that it “directly leads to an increase in the frequency of sharp drops”; tracking and verification should be maintained.
###1. Short-term (1-3 years): Obvious Transition Period Characteristics
- Volatility center may move down slowly, driven by increased institutional share and optimized trading structure
- The frequency of sharp drops may increase periodically, related to institutional position adjustment, concentrated hedging positions, and short-term amplification effects of derivatives and programmed trading. However, the impact magnitude and sustainability need dynamic evaluation combined with liquidity and regulatory framework
- Industry and individual stock differentiation may intensify: Slow rise at the index level coexists with high volatility of individual stocks
###2. Medium-term (3-5 years): Key Transformation Period
- Volatility level is expected to approach mature markets
- Slow rise characteristics are more obvious, and the weight of fundamental drivers increases
- Whether a real slow bull is formed depends on: Depth of institutional reform, economic fundamental transformation and industrial upgrading, investor education, and depth of derivatives market and regulatory support (margin system, position limits, circuit breakers and liquidity arrangements in extreme market conditions, etc.)
###3. Long-term (5-10 years): Mature Market Model is Expected
- It is expected to form a mature market model of “slow rise and sharp drop”
- Improved derivatives tools help reduce systemic risk and enhance risk pricing efficiency
- Institution-dominated markets pay more attention to long-term value and cash flow returns
###4. Core Conditions for Slow Bull Market Realization
- Institutional improvement: Systems such as delisting system, information disclosure, and investor protection need continuous optimization
- Derivatives ecology: A derivatives system with rich varieties, sufficient liquidity, and adaptive regulation is a necessary condition
- Investor structure: Increased share of long-term funds (pension funds, insurance, public and private equity, etc.) helps smooth volatility
- Corporate governance: Improve corporate quality and shareholder returns, strengthen dividend and repurchase mechanisms, and support valuation center
- Macro environment: Relatively stable economic fundamentals and policy expectations, avoiding frequent and drastic policy shifts
-
Definite trend: Volatility center gradually moves down; institutionalization and tool improvement help enhance market stability [0]
-
Transition period characteristics: The frequency of sharp drops may increase periodically (affected by institutional position adjustment, concentrated hedging positions, and derivatives-related strategies). The impact degree needs dynamic evaluation combined with liquidity, regulation and extreme events
-
Structural differentiation: U.S. stock indices show obvious “slow rise” characteristics, while A-shares show a differentiation pattern where slow rise at the index level coexists with high volatility of individual stocks [0]
-
Slow bull path: A-shares are undergoing a profound transformation from retail-dominated to institution-dominated. Whether to achieve a U.S.-style slow bull depends on institutional improvement, economic fundamentals, investor maturity, and depth of derivatives market and regulatory support. It is a gradual process and is expected to gradually approach the volatility and return characteristics of mature markets in 3-5 years or longer
[0] Gilin API Data
[1] Post and market background information (related market observations such as long-term backwardation of CSI500/1000 futures, institutional hedging behavior, competition for A500ETF option issuance rights, etc.)
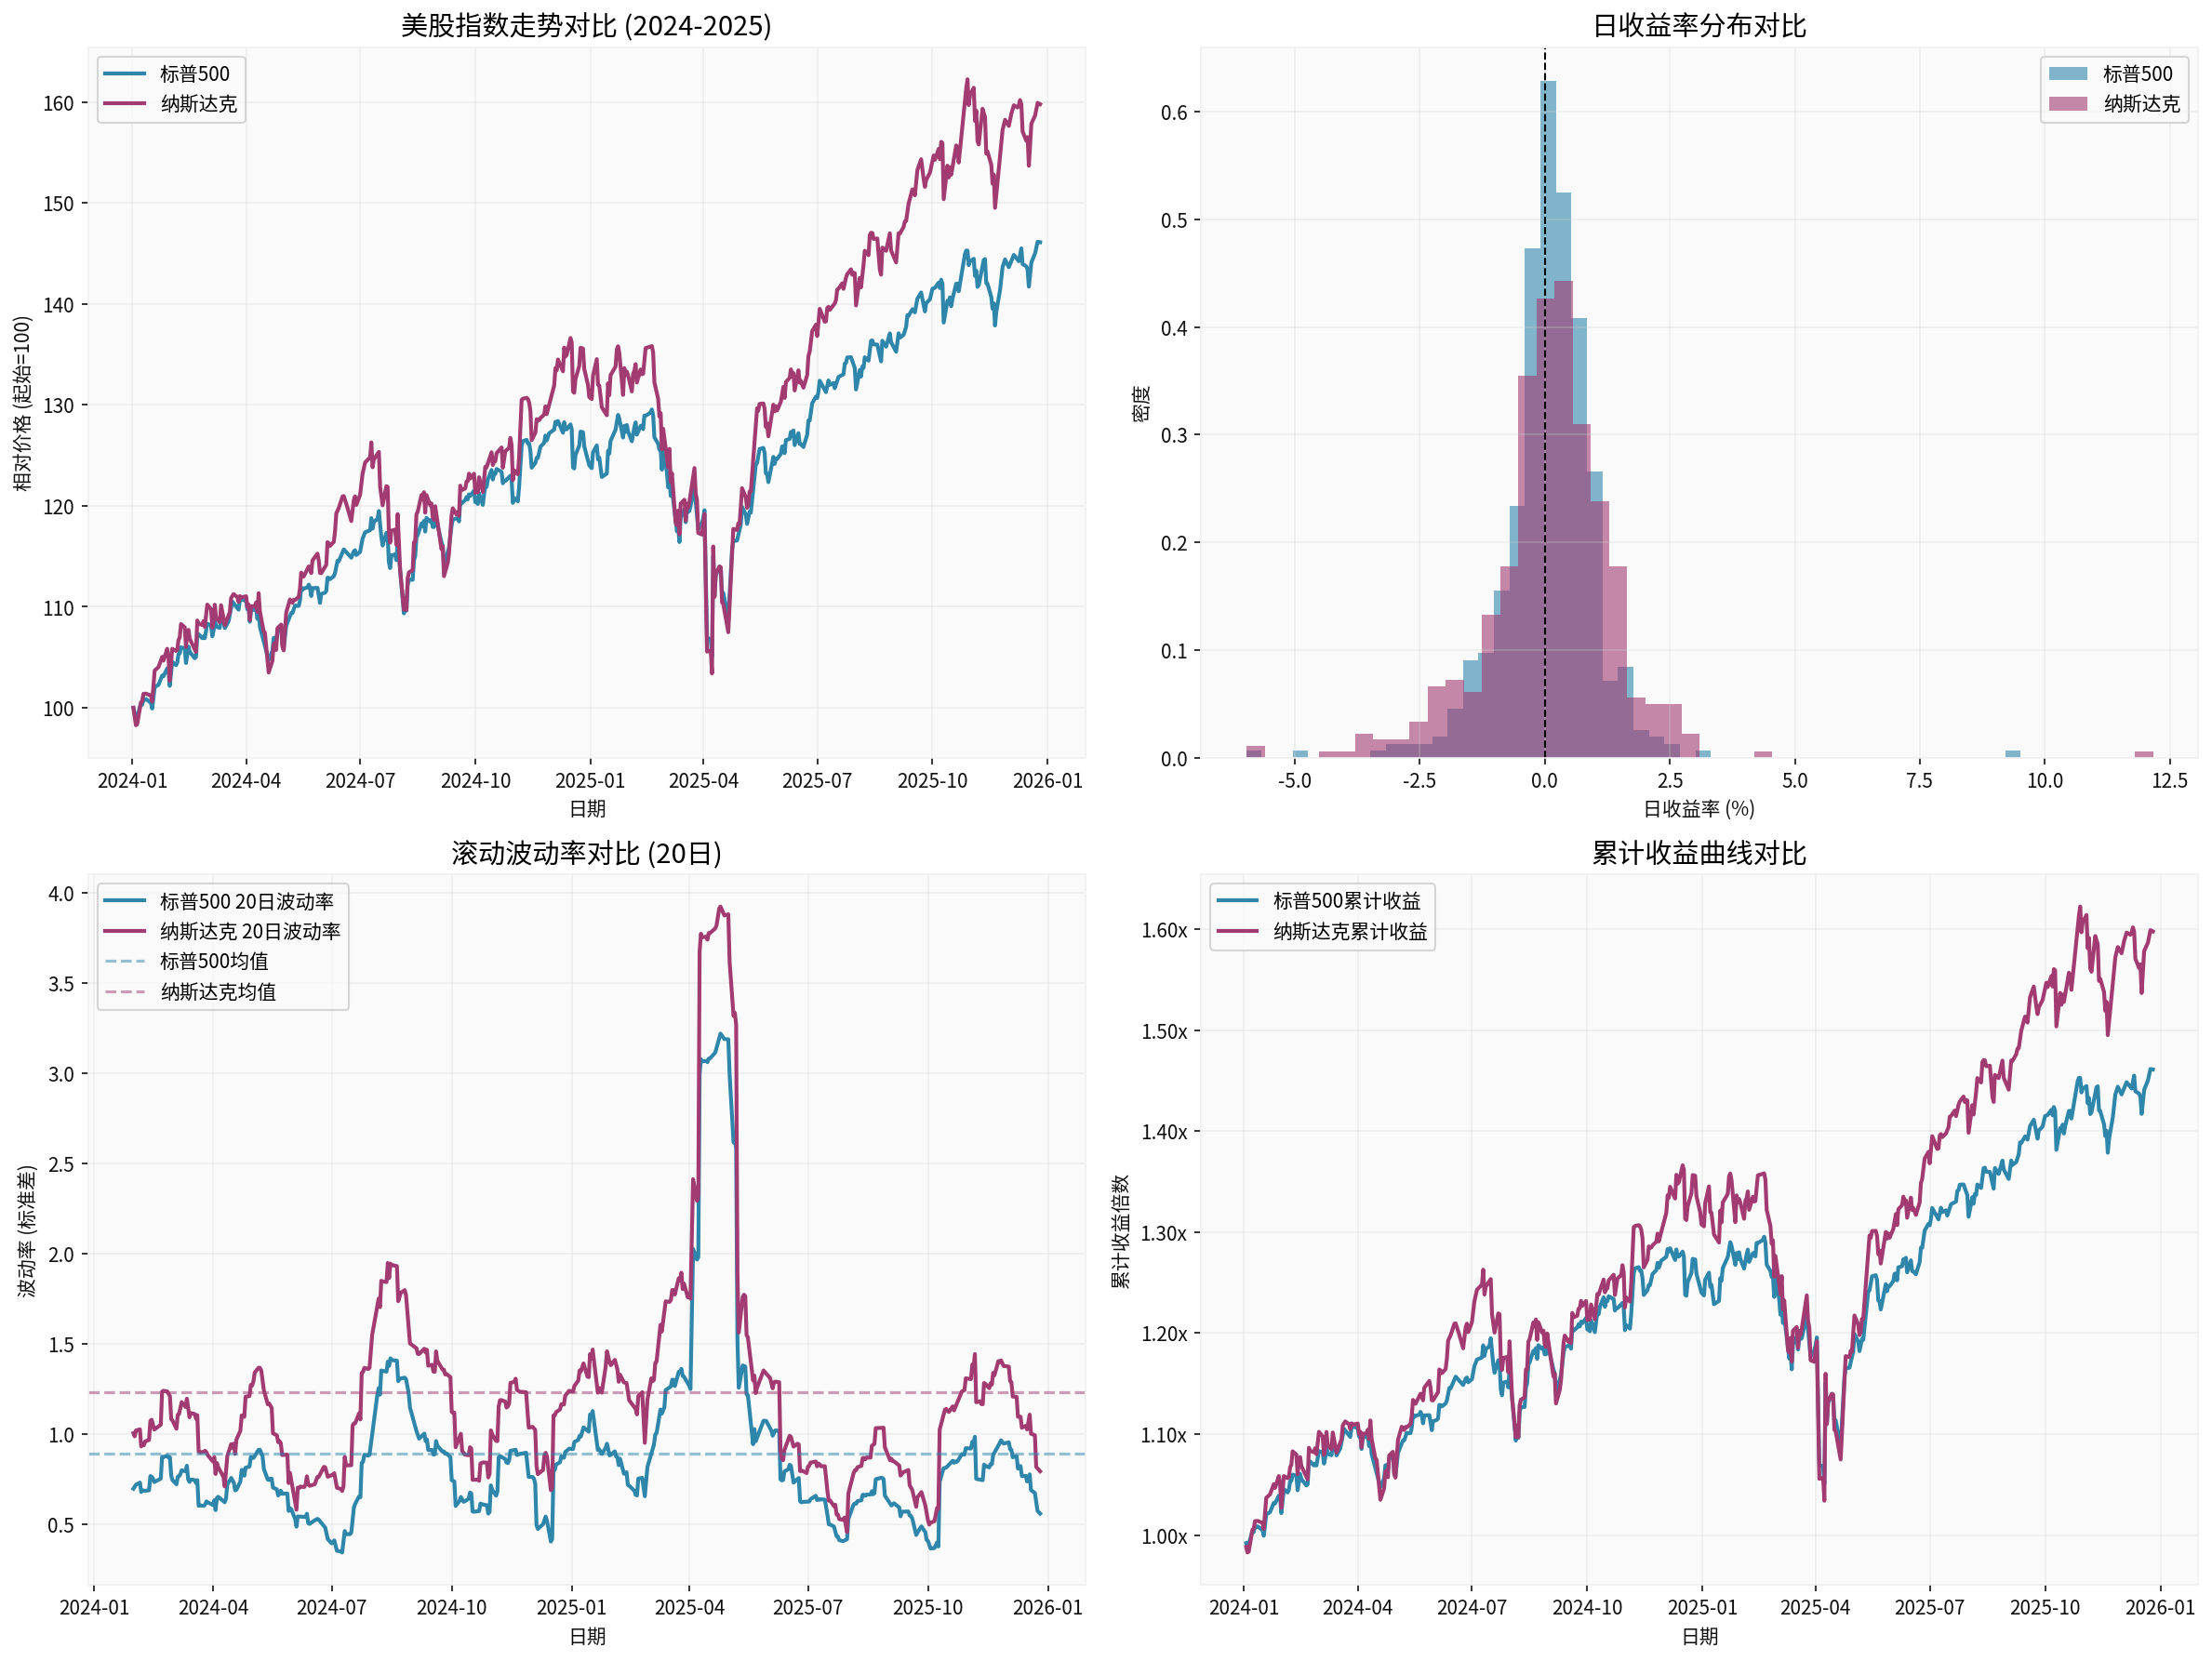
The above chart shows the volatility characteristics of U.S. stocks from 2024 to 2025, including price trends, daily return distribution, rolling volatility (20 days), and cumulative return curve [0].
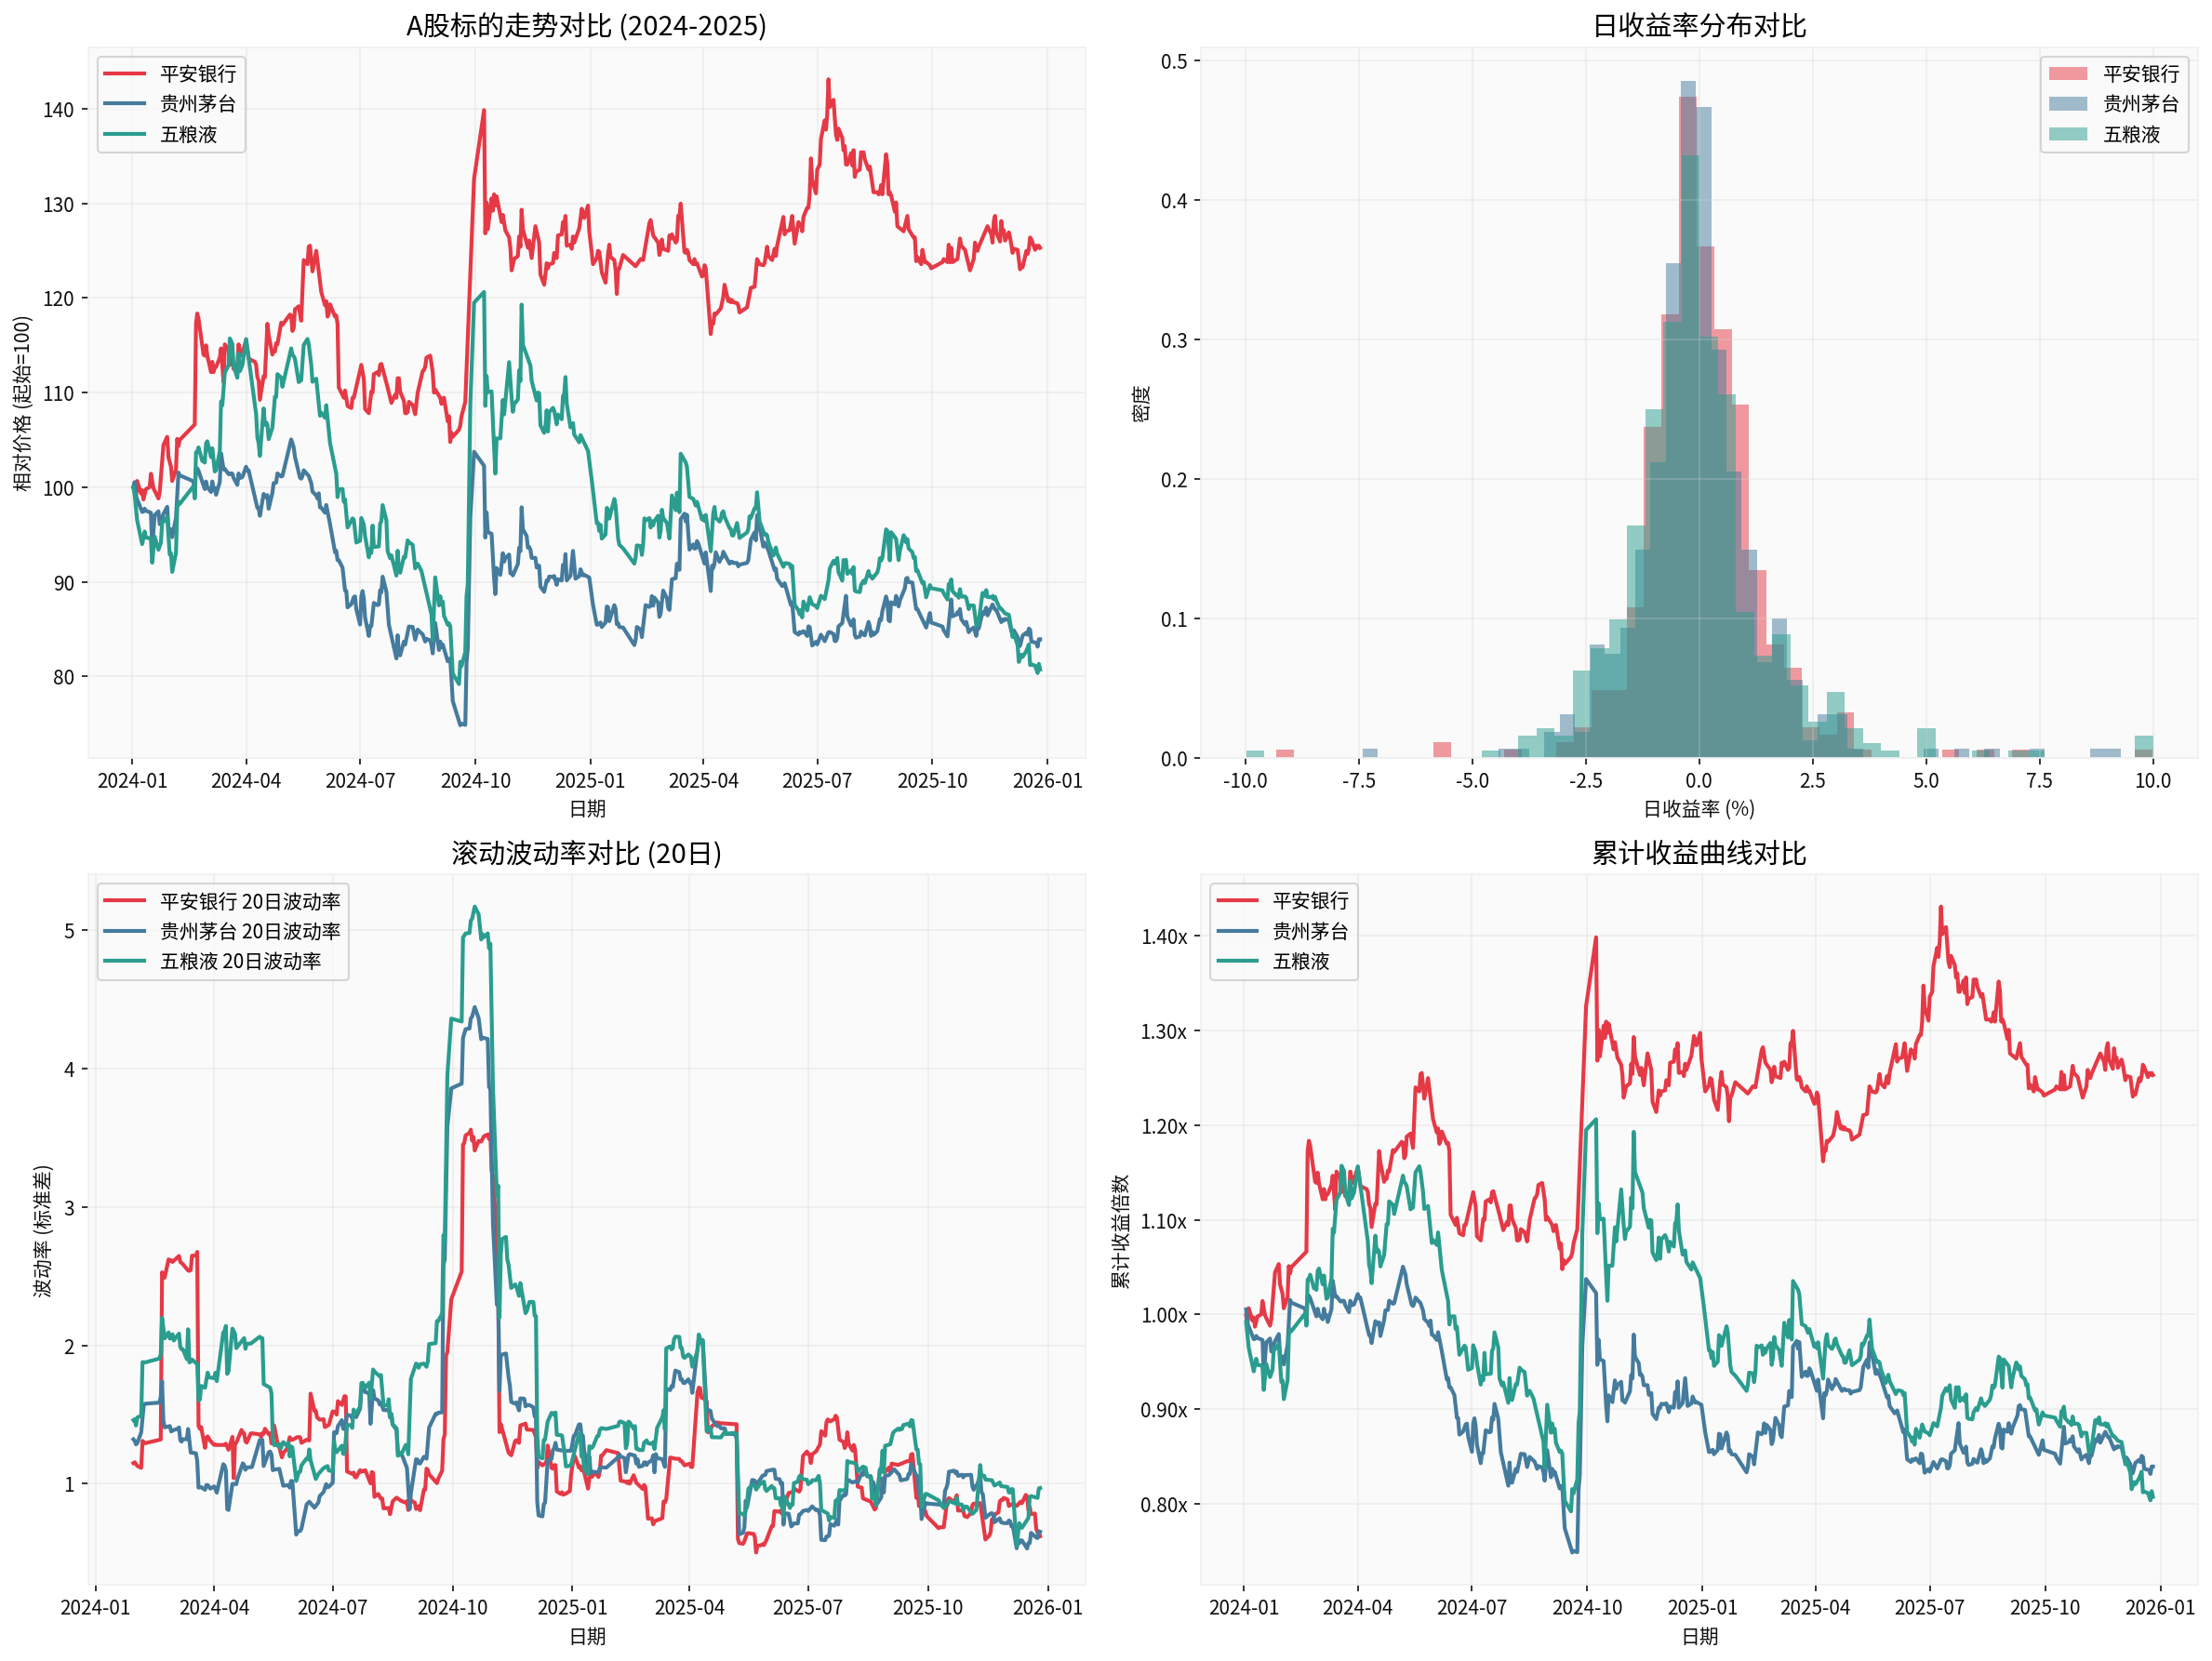
The above chart shows the volatility characteristics comparison of A-share sample targets (Ping An Bank, Kweichow Moutai, Wuliangye) from 2024 to 2025 [0].
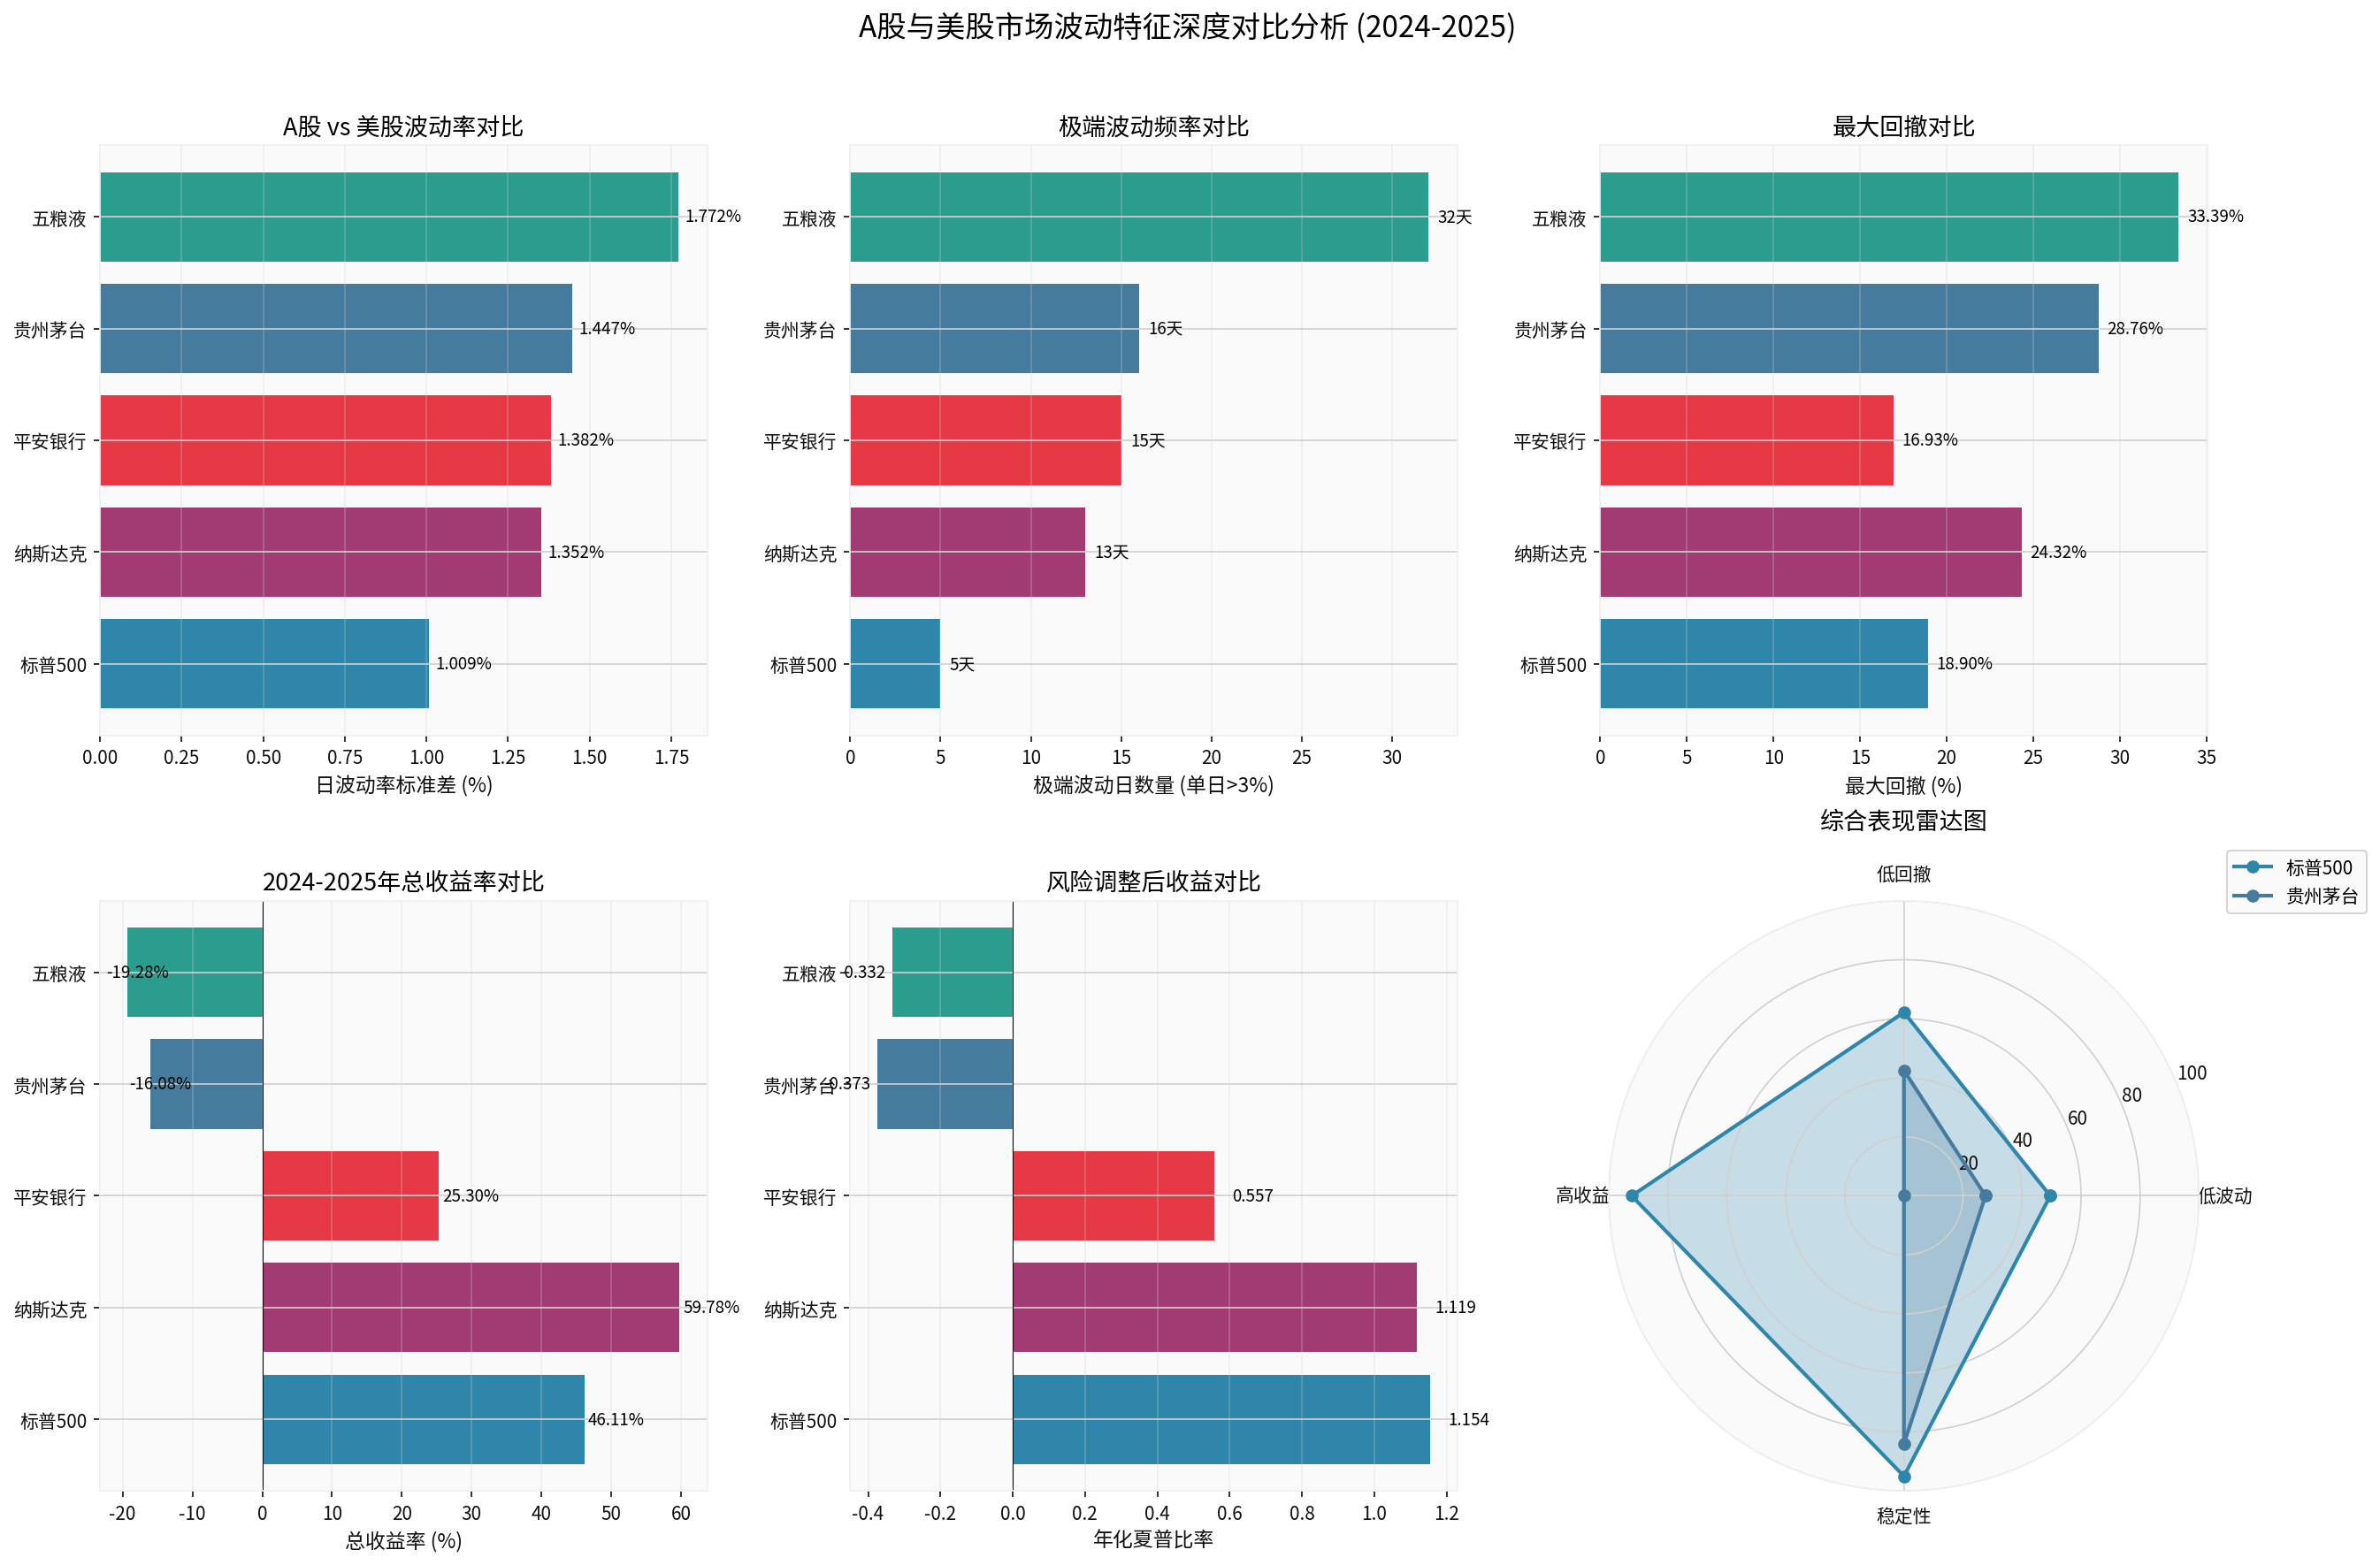
The above chart systematically compares A-share and U.S. stock markets from multiple dimensions such as volatility, extreme fluctuation frequency, maximum drawdown, return rate, and risk-adjusted return (Sharpe ratio) [0].
Insights are generated using AI models and historical data for informational purposes only. They do not constitute investment advice or recommendations. Past performance is not indicative of future results.
About us: Ginlix AI is the AI Investment Copilot powered by real data, bridging advanced AI with professional financial databases to provide verifiable, truth-based answers. Please use the chat box below to ask any financial question.