In-depth Analysis of Precious Metals Market: Sustainability of Driving Factors and Year-End Investment Strategy
Unlock More Features
Login to access AI-powered analysis, deep research reports and more advanced features
About us: Ginlix AI is the AI Investment Copilot powered by real data, bridging advanced AI with professional financial databases to provide verifiable, truth-based answers. Please use the chat box below to ask any financial question.
According to online financial media reports, the precious metals market saw a significant upward trend this week. Bloomberg reported that silver rose to a record high and gold approached an all-time high; the WSJ also noted that gold and silver prices hit new highs on Monday, and mentioned that gold’s annual gain was significant, driven by Fed rate cuts, strong central bank purchases, and momentum funds [1][2][3][4].
From the brokerage API data (statistics for the past 6 months, past 90 days, and year-to-date):
- Gold retreated after hitting a high in the past 6 months, currently closing at about $3855.20; it fell cumulatively in the past 90 days and had a negative return year-to-date; technically, the RSI(14) is about 27.49, in the oversold range [0].
- Silver also corrected after hitting a recent high, currently around $47.02; technically, the RSI(14) is about 41.60, neutral; the price correlation between gold and silver in the past 3 months is as high as about 0.92 [0].
- The gold-silver ratio is about 82.00, at a relatively high level, indicating that silver is cheaper relative to gold with greater potential elasticity [0].
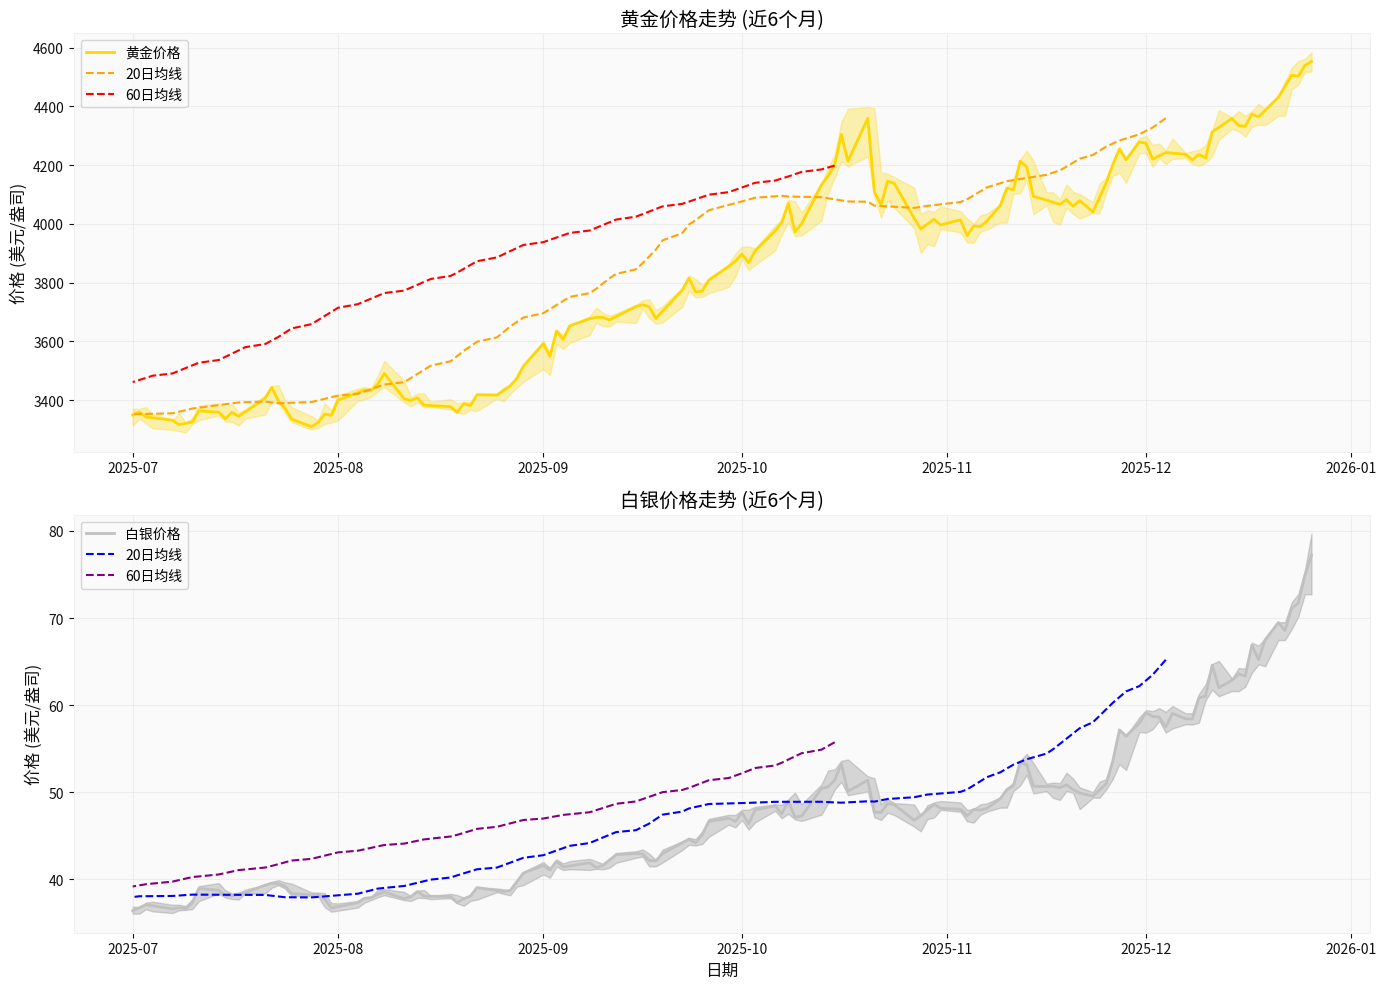
- The chart shows that both gold and silver rose significantly during the year, then fluctuated at high levels and retreated. The current position is in a high-level correction phase, but the medium-to-long-term upward structure has not been completely reversed (needs to be tracked with volume and key support/resistance).
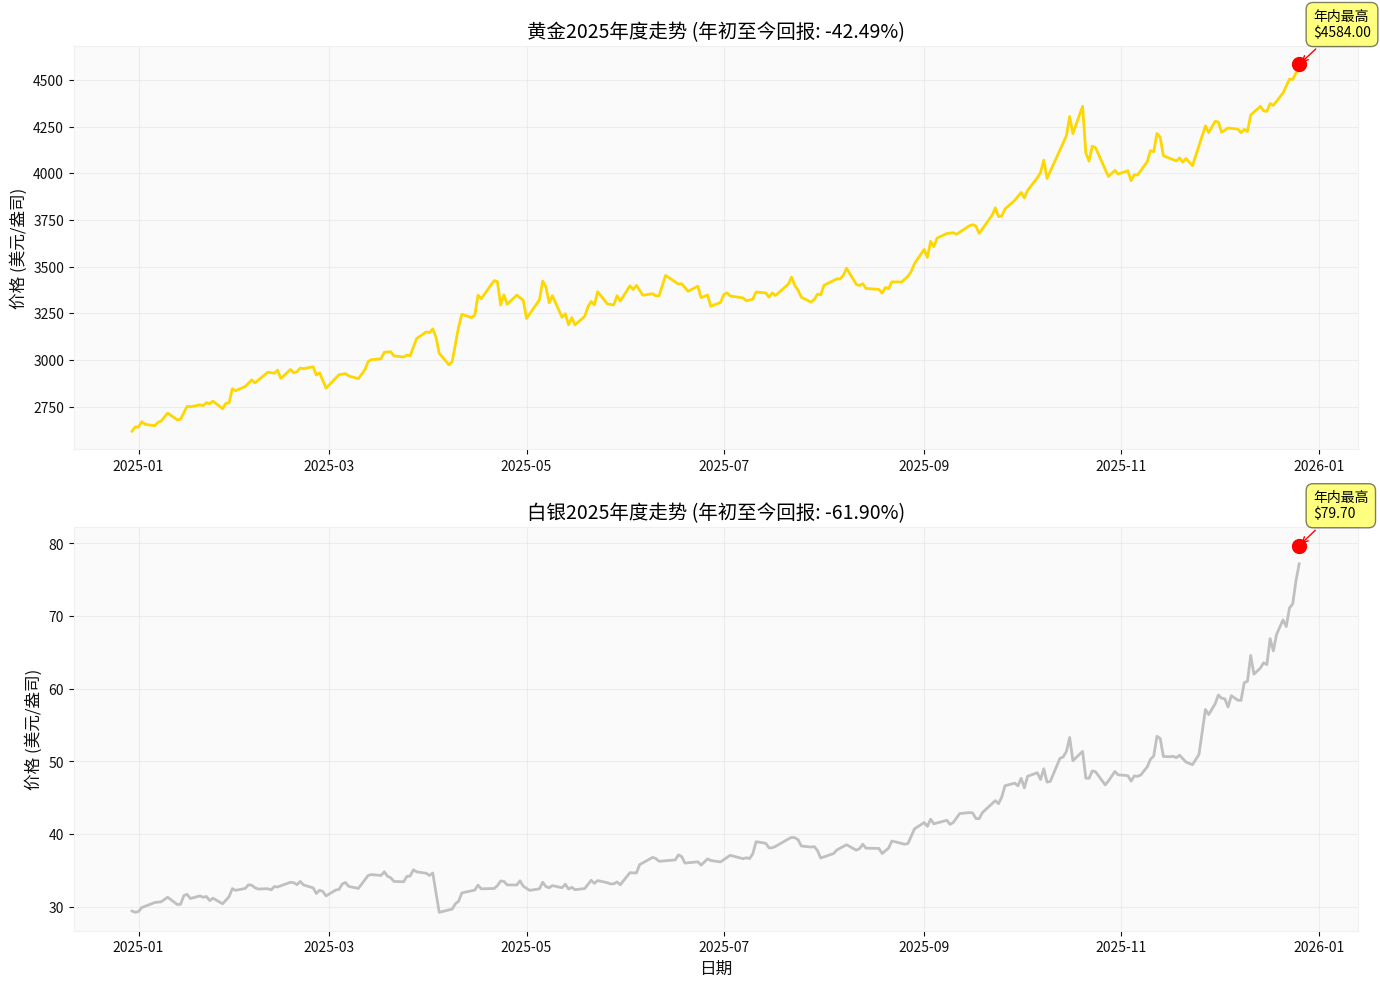
- Gold hit around $4584.00 this year, currently retracing about 42%; silver hit around $79.70 this year, currently retracing about 62%. The sharp volatility indicates significant profit-taking and emotional divergence in the market at high levels [0].
- Monetary Policy Expectations and Inflation Environment
- The Fed’s rate cut expectations are the key easing backdrop for precious metals pricing. Media reports indicate that Fed rate cuts, combined with geopolitical and macro risks, pushed gold and silver higher, with gold’s annual gain approaching 70% [1][2]. Lower interest rates reduce the opportunity cost of holding precious metals and enhance their attractiveness as non-interest-bearing assets.
- Geopolitical and Safe-Haven Demand
- The WSJ reported that tensions between the U.S. and Venezuela have escalated, boosting safe-haven sentiment and supporting gold, silver, and crude oil [2]. Bloomberg also emphasized that the ‘persistent risk’ macro environment drove gold close to a record high [1].
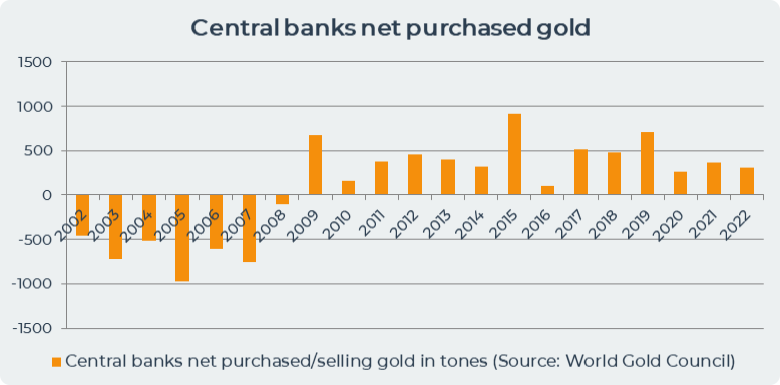
- Central Bank Gold Purchases and Structural Allocation
- Forbes reported that according to IMF data, the share of gold in global central banks’ official reserves has risen from 15% at the end of 2023 to nearly 20%. J.P. Morgan scenario: If central banks with gold holdings below 10% increase their allocation to 10%, it could bring about $33.5 billion in capital inflows (about 2600 tons) at the $4000/oz price level. Goldman Sachs gave a target price of $4900/oz [3]. Continuous central bank purchases have solidified the long-term demand foundation for precious metals.
- Momentum Funds and Position-Driven
- The WSJ pointed out that in addition to central bank gold purchases, momentum-chasing investors also pushed up prices and drove year-end capital rotation into assets like gold [2]. Bloomberg’s report also confirmed the accelerating role of ‘momentum’ in the market [1].
- Supply-Demand and Sentiment Reflected by Technicals
- Gold’s RSI(14) is about 27.49; oversold means short-term selling pressure is extreme, and a rebound/correction often occurs when fundamental drivers have not reversed [0].
- Gold’s 20-day volatility is about 2.27%, silver’s is about 3.51%; silver’s higher volatility is consistent with greater capital elasticity [0].
- Relative Asset Value and Rotation
- The gold-silver ratio is about 82.00 (high range), indicating significant cost-effectiveness of silver. When the safe-haven and liquidity easing environment continues, silver and metals with dual industrial/financial attributes like platinum and palladium are prone to catch-up gains [0].
- Monetary easing and interest rate expectations: In the short term, if the pace or intensity of rate cuts is less than expected, it may suppress precious metals; but in the medium term, as long as real interest rates remain low/negative, the allocation value of precious metals still exists.
- Geopolitical and risk events: Highly uncertain, with strong pulse-like impacts on the market. If geopolitical tensions ease, the safe-haven premium will fall periodically; but structural risks (such as great power games, supply chain disruptions, etc.) are difficult to dissipate quickly.
- Central bank gold purchase trend: According to IMF data, central banks’ increased allocation of precious metals is a structural, medium-term behavior, which is expected to provide long-term bottom support for prices [3].
- Momentum and positions: There is a two-way amplification effect. It attracts capital inflows during rallies, but high-level volatility and profit-taking are also obvious (the annual retracement magnitude confirms increased volatility) [0].
- Gold: RSI is oversold; if a technical rebound occurs, resistance can refer to the high area before the recent retracement; support should focus on the previous dense trading and moving average convergence area [0].
- Silver: RSI is neutral, with greater elasticity than gold. If the gold-silver ratio repairs or industrial demand improves, there is more room for catch-up gains [0].
- Diversified Allocation and Phased Operations
- Against the backdrop of increasing volatility, avoid ‘all-in’ on a single variety. It is recommended to combine gold (safe-haven/reserve) and silver (elasticity/industrial), and pay appropriate attention to phased opportunities for platinum and palladium.
- Use short-term technical corrections (such as gold’s oversold area) to absorb in batches to reduce timing risk; for high-elasticity varieties like silver, small positions can be used to probe, with dynamic stop-loss [0].
- Key Tracking Indicators
- Macro: Fed rate cut expectations, U.S. inflation/employment data, U.S. dollar index, real interest rates, and credit spreads.
- Demand side: Central bank gold purchase data, ETF positions, and COMEX/exchange position changes.
- Technical aspects: RSI, moving averages, trading volume, and key support/resistance breakthroughs [0].
- Risks and Scenarios
- Bullish scenario: If rate cut expectations are further strengthened, geopolitical risks escalate, and central bank gold purchases continue, capital is expected to return to precious metals and drive a breakthrough [1][2][3].
- Bearish/volatile scenario: If tightening expectations rebound, geopolitical tensions ease, or risk appetite rises significantly, the short-term safe-haven premium may compress, and volatility will increase [0].
- Portfolio Hedging and Position Management
- Precious metals mainly hedge tail risks and inflation in the portfolio; it is recommended that the overall position is not overly crowded, and low-risk assets such as cash/treasuries are matched to smooth volatility.
- Year-end liquidity may decline; trading execution should be more cautious to prevent extreme spreads and slippage [0].
- The strong rally of precious metals this round, combined with the background of hitting historical/multi-year highs this year, is related to the resonance of easing expectations, central bank gold purchases, safe-haven demand, and momentum funds [1][2][3].
- Current brokerage API data shows that high-level correction and technical oversold (gold) coexist, volatility is increasing; in the short term, it is necessary to guard against profit-taking and emotional fluctuations, but medium-term structural support remains [0].
- Investors can combine their own risk preferences, use methods such as phased absorption, diversified varieties, position control, and dynamic stop-loss to grasp the year-end market, and closely track macro, capital, and technical signals [0][1][2][3].
Insights are generated using AI models and historical data for informational purposes only. They do not constitute investment advice or recommendations. Past performance is not indicative of future results.
About us: Ginlix AI is the AI Investment Copilot powered by real data, bridging advanced AI with professional financial databases to provide verifiable, truth-based answers. Please use the chat box below to ask any financial question.