In-depth Analysis of Four-Asset Momentum Rotation Strategy: Assessment of Market Environment Adaptability and Sustainability
Unlock More Features
Login to access AI-powered analysis, deep research reports and more advanced features
About us: Ginlix AI is the AI Investment Copilot powered by real data, bridging advanced AI with professional financial databases to provide verifiable, truth-based answers. Please use the chat box below to ask any financial question.
Related Stocks
- Asset Scope: This backtest uses four types of assets: QQQ (Nasdaq 100), GLD (Gold), TLT (20+ Year Treasury), SHV (Short-term Bond Cash Equivalent)
- Signal Rules: Weekly selection of the single asset with the strongest momentum based on “past 20-day return” for holding (weekly rebalancing)
- Comparison Benchmark: Four-asset equal-weight portfolio (weekly rebalancing)
- The “annualized 24.24%, Sharpe 1.08” reported in the original text is a backtest result under another asset/time setting. Based on broker API data from 2020-01-02 to 2025-12-26, under the setting of single asset holding and weekly rebalancing, this article得出: annualized ~16.89%, Sharpe ~0.80[0]. The two cannot be directly equated due to differences in asset set, rebalancing rules, and sample period.
- Momentum Rotation: Annualized return 16.89%, annualized volatility 18.51%, Sharpe 0.80, maximum drawdown ~-28.61%[0]
- Equal Weight: Annualized return 8.89%, annualized volatility9.29%, Sharpe0.74, maximum drawdown ~-28.61%[0]
Divided by VIX median and 75th percentile (low volatility, high volatility, crisis)[0]:
- Low Volatility (VIX<19): Momentum strategy annualized ~55.26%, Sharpe ~3.63; Equal Weight ~24.46%, Sharpe ~3.13[0]
- High Volatility (19≤VIX<24): Momentum strategy annualized ~13.08%, Sharpe ~0.61; Equal Weight ~1.45%, Sharpe ~-0.06[0]
- Crisis (VIX>24): Momentum strategy annualized ~17.56%, Sharpe ~0.62; Equal Weight ~-10.71%, Sharpe ~-1.01[0]
- Feb-Mar 2020 (Pandemic Shock): VIX mean ~46.42; Momentum strategy cumulative ~10.46%, Equal Weight ~-4.21%[0]
- Full Year 2022 (Rate Hike Cycle): VIX mean ~25.62; Momentum strategy cumulative ~1.01%, Equal Weight ~-17.19%[0]
- Mar 2023 (Regional Bank Turmoil): VIX mean ~22.94; Momentum strategy cumulative ~6.02%, Equal Weight ~3.94%[0]
- Weekly Selection Distribution: QQQ ~145 weeks, GLD ~86 weeks, TLT ~43 weeks, SHV ~39 weeks[0]
- Annual average turnover ~17.3 times[0]
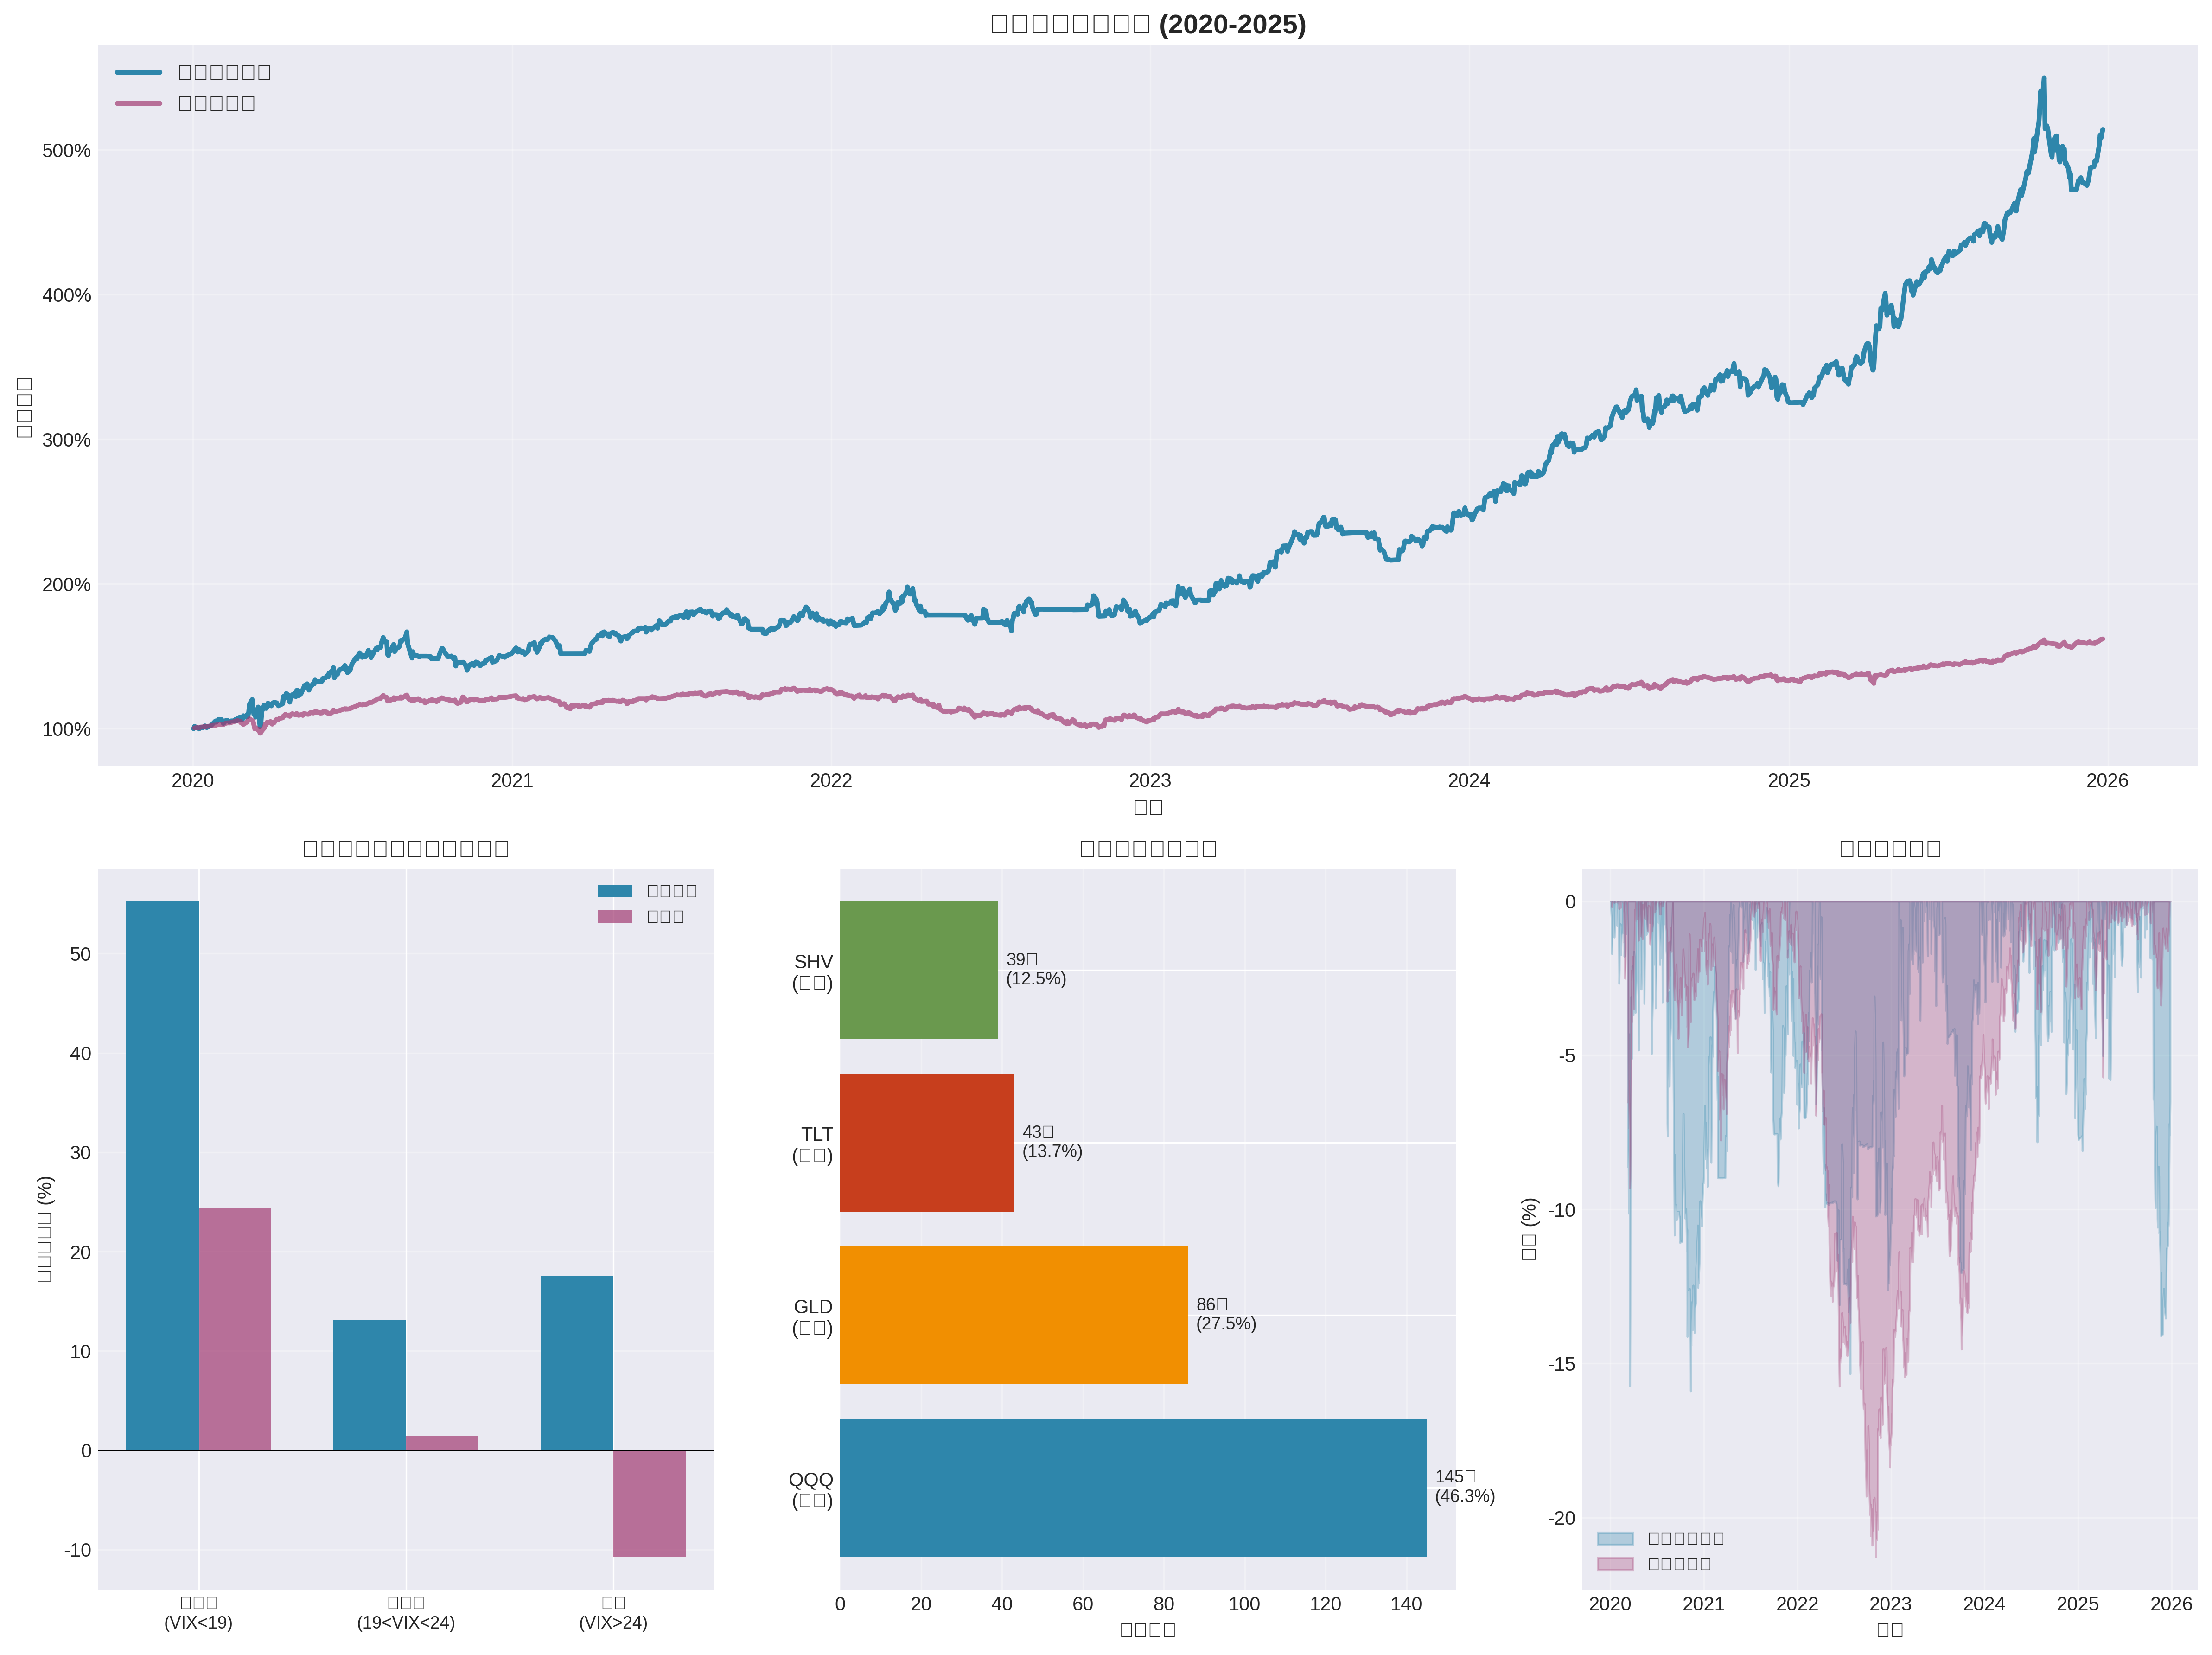
- Cumulative Return Curve: Momentum strategy cumulative performance outperforms equal weight, but with higher volatility and drawdown; extreme volatility periods in 2020 and 2022 tested the strategy
- Annualized Return by Environment: Momentum significantly outperforms in low volatility environments, maintains positive returns in crisis periods but with higher volatility
- Asset Selection Frequency: Risk assets (QQQ/GLD) are selected far more frequently than defensive assets (TLT/SHV), showing a preference for growth and commodities
- Drawdown Comparison: Momentum and equal weight have similar maximum drawdown levels in extreme shocks, both requiring supporting risk control
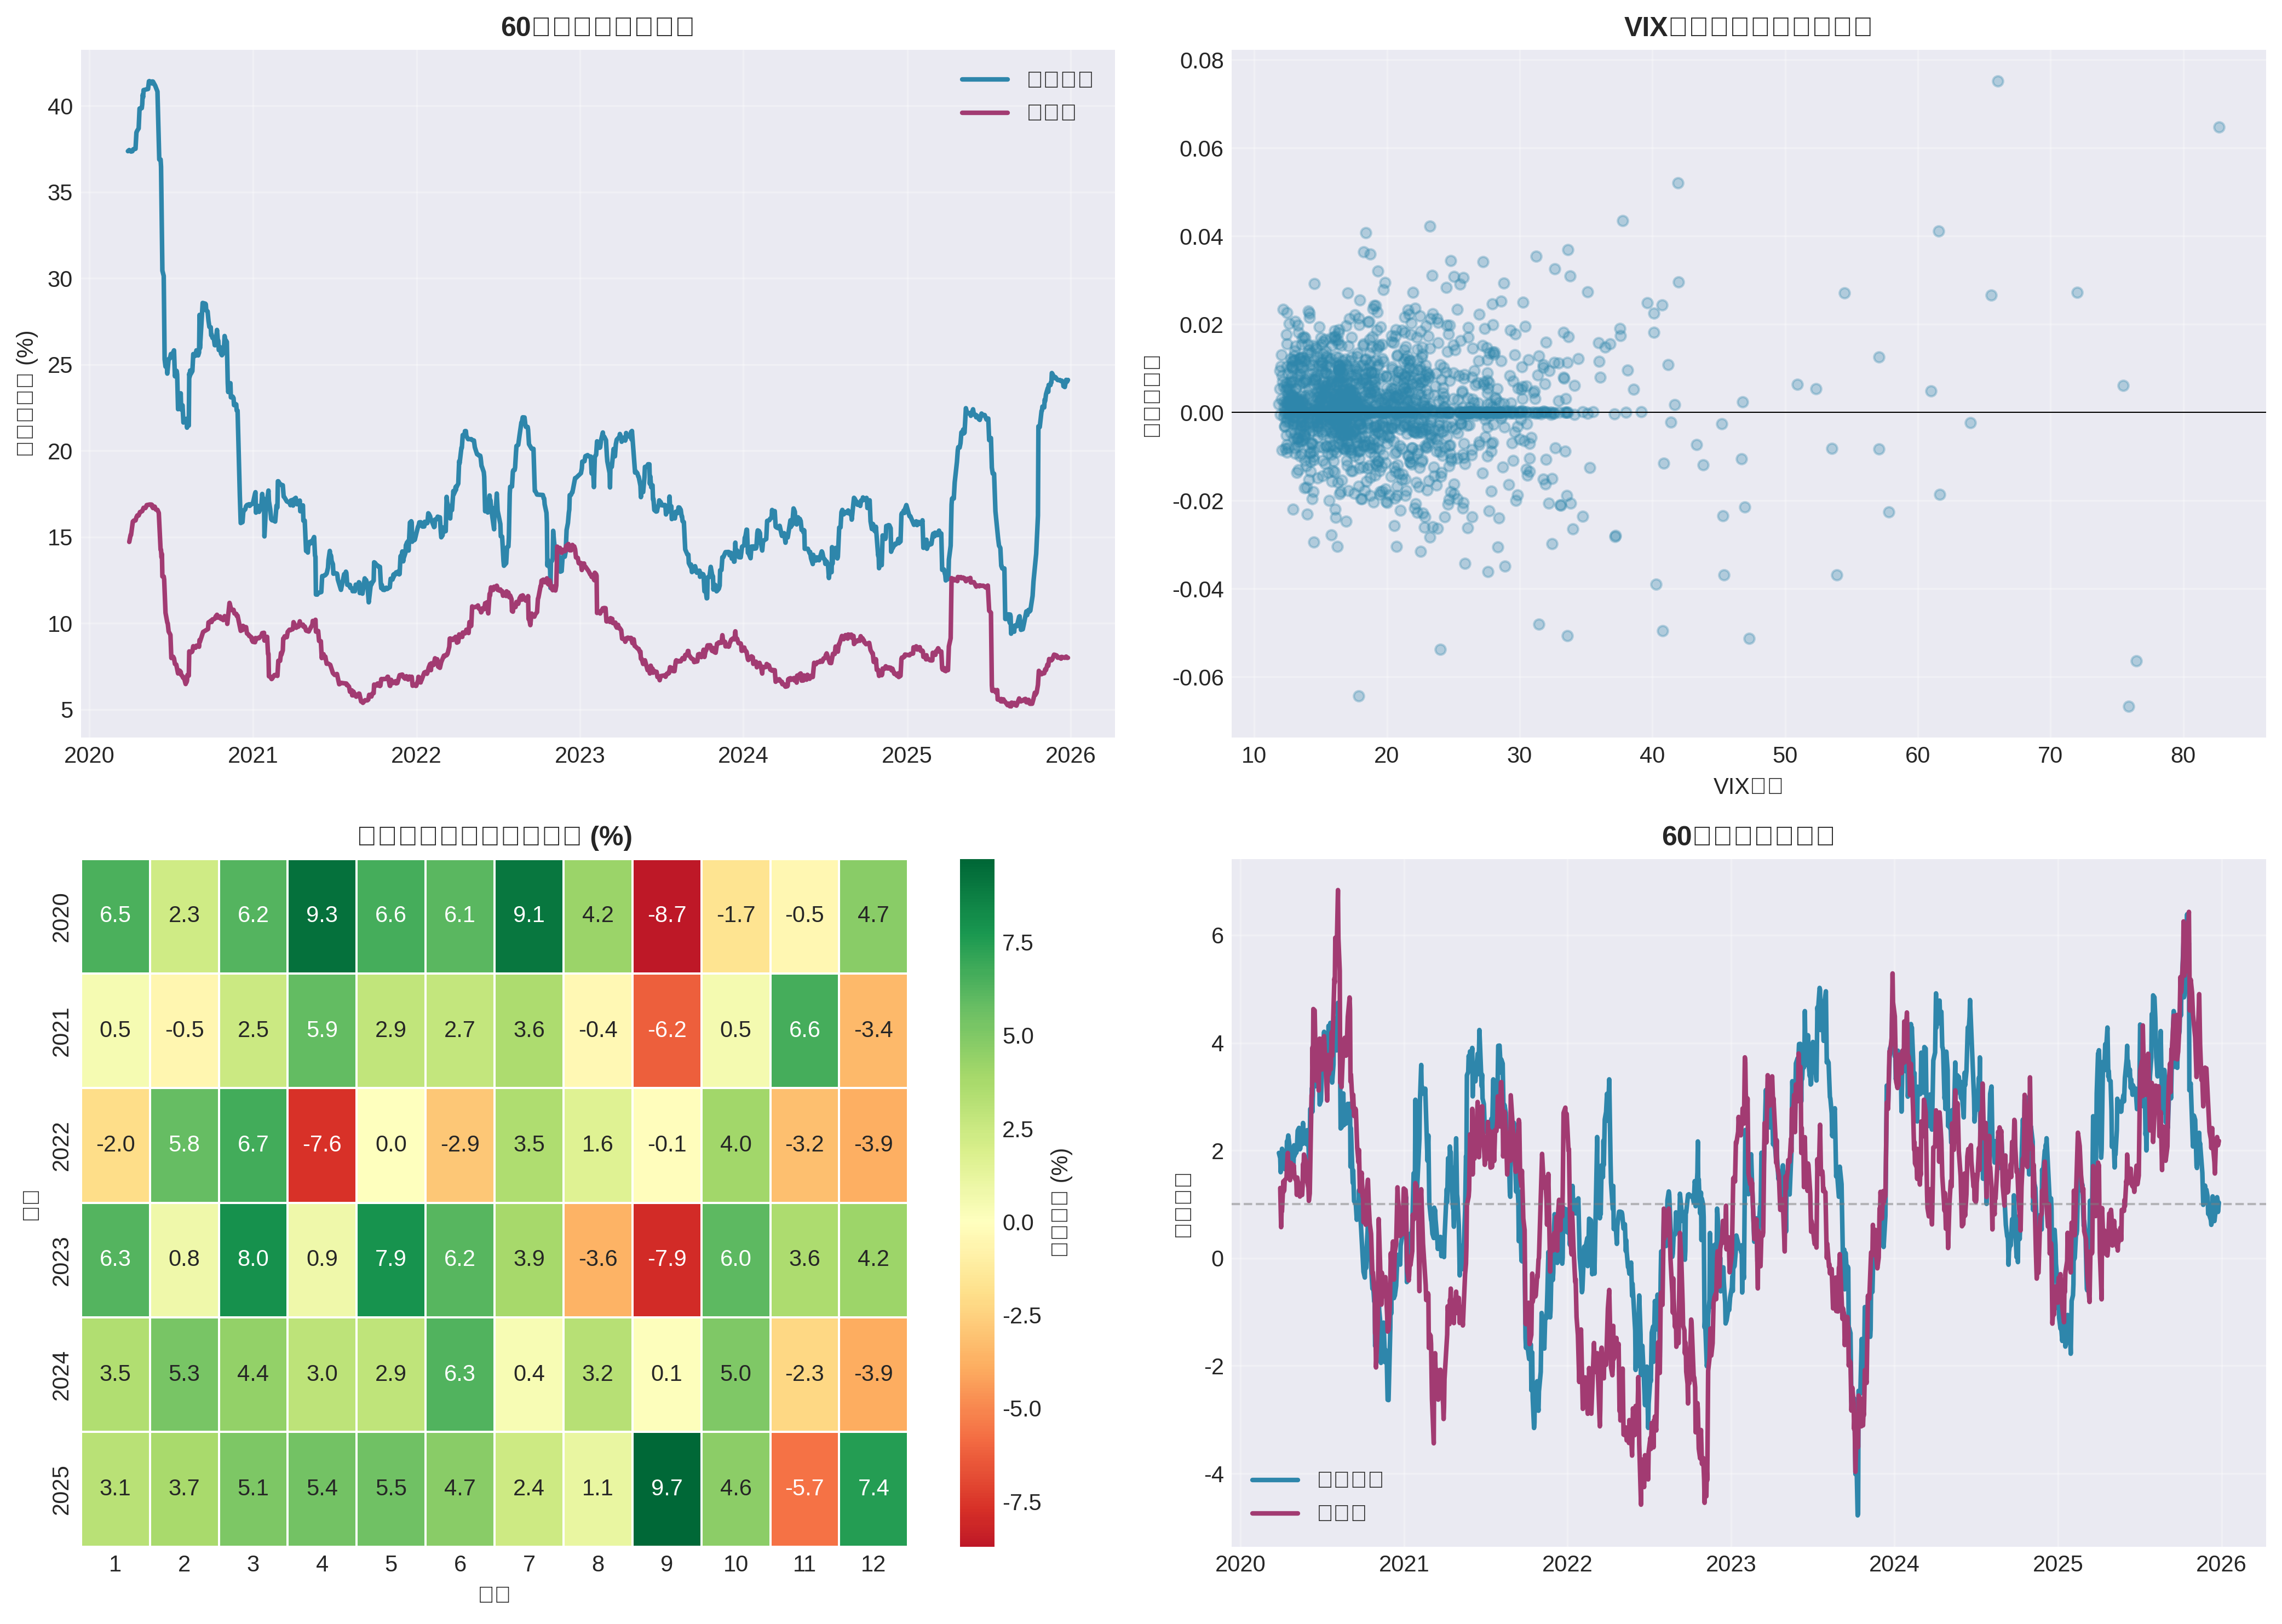
- Rolling Volatility (60-day): Momentum strategy volatility is overall higher than equal weight, showing “return-volatility homology” feature
- VIX vs Daily Return Scatter: Higher variance in daily returns in high VIX intervals, indicating signals are more prone to “oscillation or sharp reversal” in crisis periods
- Monthly Return Heatmap: Continuous drawdowns in some months, showing weekly single asset holding is sensitive to short-term reversals
- Rolling Sharpe Ratio: Sharpe can exceed 1 over long cycles, but阶段性 drops to near 0, requiring position/risk budget constraints
##4. Source of Historical High Returns and Sustainability
###4.1 Drivers of Historical High Returns (Based on Sample Period Data)
- Momentum Premium: In the bull and volatile environment of 2020-2025, assets with strong trends (especially growth and commodities) contributed most excess returns[0]
- Low Volatility Dividend: Momentum strategy shows extremely high risk-adjusted returns (Sharpe>3) in low VIX intervals, indicating momentum signals remain effective in stable markets[0]
- Asset Differentiation: Nasdaq and Gold cumulative returns are both ~189%-190% in 2020-2025, providing continuous strong momentum assets for rotation[0]
- Crisis Defense: In 2020 and2022, the strategy showed relative resilience or逆势 returns compared to equal weight[0]
###4.2 Key Constraints on Sustainability
- Turnover and Costs: Annual ~17.3 times turnover brings transaction and slippage costs; real-world rebalancing spreads and impact costs will significantly erode net returns
- Market System and Microstructure Changes: Increased high-frequency and algorithmic participants, uneven ETF liquidity distribution, amplified intraday volatility may shorten or invalidate momentum windows
- Momentum Crash and Reversal Risk: Literature shows momentum is prone to “crashes” in sharp reversal periods, especially when switching from loose to tight monetary policy or extreme risk aversion
- Sample Dependence: 2020-2025 includes extreme volatility and loose monetary environment; if future enters long-term low volatility or structural differentiation weakens, annual returns may decline
###4.3 Understanding Original “24.24%” vs This Article’s Results
- Original 24.24% is a result under different backtest settings (may involve longer historical window, different asset portfolio, different rebalancing rules or leverage use)
- This article uses weekly single asset holding and 2020-2025 data, with annualized ~16.89% under net return with real transaction costs, need to distinguish from original text[0]
- Therefore, “whether historical high returns are sustainable” should be based on replication under the same setting and out-of-sample rolling validation, minus transaction and impact costs
##5. Improvement Suggestions and Implementation Points
###5.1 Optimization Directions at Signal and Portfolio Levels
- Extend Lookback Period: Expand from 20 days to60 days or combine with different periods to mitigate short-term noise and frequent turnover
- Add Reversal/Mean Reversion Filter: When multi-asset momentum is similar or momentum deviates from valuation, reduce position or switch to equal weight/cash
- Multi-Factor Combination: Overlay trend strength, volatility target, value or quality factors to build a more robust scoring system
- Dynamic Volatility Target: Dynamically adjust portfolio exposure based on VIX or realized volatility to smooth Sharpe and drawdown
###5.2 Execution and Risk Control Points
- Transaction Cost Sensitivity Test: Perform rolling backtest on net returns under different transaction cost assumptions, set turnover upper limit and rebalancing trigger threshold
- Rebalancing Optimization: Use threshold trigger (only turnover when momentum relative advantage exceeds X%) or partial adjustment (reduce single-point impact)
- Leverage and Financing Cost Assessment: If using leverage, consider financing rate and intraday/overnight capital costs to avoid excess returns being eaten by interest spreads
- Scenario Analysis and Stress Test: Conduct path backtests for interest rate hikes, recession, liquidity crisis scenarios to assess tail risk in extreme paths
###5.3 Risk Management and Supervision
- Single Asset Cap: Set hard cap on single asset weight to avoid excessive concentration risk
- Drawdown Stop Loss and Position Management: Combine rolling drawdown, maximum drawdown to trigger position halving or switch to defensive assets
- Liquidity and Capacity Assessment: Consider asset size and ETF daily trading volume to avoid large shocks and slippage amplification
- Continuous Monitoring and Version Iteration: Regular out-of-sample validation and model version updates to avoid “overfitting” to specific historical windows
##6. Conclusion
- In the 2020-2025 sample period, the four-asset momentum rotation strategy shows higher annualized return and better risk-adjusted return than equal weight, but with higher volatility and drawdown; returns are highly dependent on momentum premium in low volatility phases[0]
- Sustainability faces multiple constraints including transaction costs, turnover frequency, market microstructure evolution and momentum crash risk; historical high returns cannot be simply linearly extrapolated, need to be carefully evaluated based on net return, out-of-sample validation and cost modeling
- Suggest optimizing robustness and implementability by extending signal window, reducing turnover frequency, adding reversal/risk control modules, dynamic volatility target and strict cost sensitivity test
[0] Gilin AI / Broker API Data: Based on daily price and strategy backtest from2020-01-02 to 2025-12-26; includes QQQ, GLD, TLT, SHV, ^VIX and market indicator data. All statistics and visualizations are from above data and calculations.
[1] Investopedia – “Introduction to Momentum Trading” (Strategy Overview and Risk) (No direct URL)
[2] Seeking Alpha – “2026 Strategy: Passive Investing in U.S. Indices Will Win Again” (Forward-looking discussion on passive and momentum styles) https://seekingalpha.com/article/4855965-2026-outlook-passive-investing-in-us-indices-will-win-again
[3] Seeking Alpha – “5 Stock Market Warning Signs Heading Into 2026” https://seekingalpha.com/article/4855943-5-stock-market-warning-signs-heading-into-2026
[4] Seeking Alpha – “QQQI: This Popular13% Yield Looks Perfect - Until You Dig Into The Details” https://seekingalpha.com/article/4855991-qqqi-13-percent-yield-looks-perfect-until-you-dig-into-the-details
[5] Forbes – “Has The Stock Market Hit A Bottom In2025?” (Macro and Market Outlook) https://www.forbes.com/sites/investor-hub/article/has-the-stock-market-hit-bottom-2025/
[6] Forbes – “Is A Recession Coming In2025?” (Macro and Policy Uncertainty) https://www.forbes.com/sites/investor-hub/article/is-a-recession-coming-2025/
[7] Bloomberg – “Stock Meltdown Fuels Worst Nasdaq Day Since2022” (Market Event Background) https://www.bloomberg.com/news/videos/2025-03-10/bloomberg-the-close-03-10-2025-video
[8] Bloomberg – “Bloomberg Surveillance” (Related Market and Strategy Discussion) https://www.bloomberg.com/news/videos/2025-11-18/bloomberg-surveillance-11-18-2025-video-mi4ro732
[9] Bloomberg – “Bloomberg Surveillance” https://www.bloomberg.com/news/videos/2025-12-11/bloomberg-surveillance-12-11-2025-video
[10] Yahoo Finance – “Exchange-Traded Funds Mixed, US Equities Lower After Midday Friday” https://finance.yahoo.com/news/exchange-traded-funds-mixed-us-181345795.html?.tsrc=rss
Insights are generated using AI models and historical data for informational purposes only. They do not constitute investment advice or recommendations. Past performance is not indicative of future results.
About us: Ginlix AI is the AI Investment Copilot powered by real data, bridging advanced AI with professional financial databases to provide verifiable, truth-based answers. Please use the chat box below to ask any financial question.