How Do Fund Managers Build a 'Barbell' Investment System That Survives Bull and Bear Markets? — From Sunac's Default to Risk Control Evolution Toward Sharpe Ratio >1.0
Unlock More Features
Login to access AI-powered analysis, deep research reports and more advanced features
About us: Ginlix AI is the AI Investment Copilot powered by real data, bridging advanced AI with professional financial databases to provide verifiable, truth-based answers. Please use the chat box below to ask any financial question.
Related Stocks
Based on search results and professional financial analysis frameworks [1,2,3], I will systematically analyze the construction logic and practical application of the ‘Barbell’ investment system for you.
The case of Sunac China (01918.HK) is a typical example of risk exposure in China’s real estate industry in the 2020s. According to the latest data, Sunac experienced:
- 2021: Cash flow crisis began to emerge
- 2022: Public debt default, officially falling into liquidity distress
- November 2023: First offshore debt restructuring (billion-dollar scale)
- December 2025: Completed full domestic and offshore debt restructuring, reducing debt by approximately 60 billion yuan [2,3]
- Industry Misjudgment: Overly bet on the upward real estate cycle, ignoring policy shift signals (“Three Red Lines” policy)
- Concentration Risk: Overweighting a single industry, lacking diversified allocation
- Missing Liquidity Management: High-leverage model quickly failed during credit contraction
- Insufficient Fundamental Research: Inadequate understanding of the enterprise’s true debt structure and cash flow status
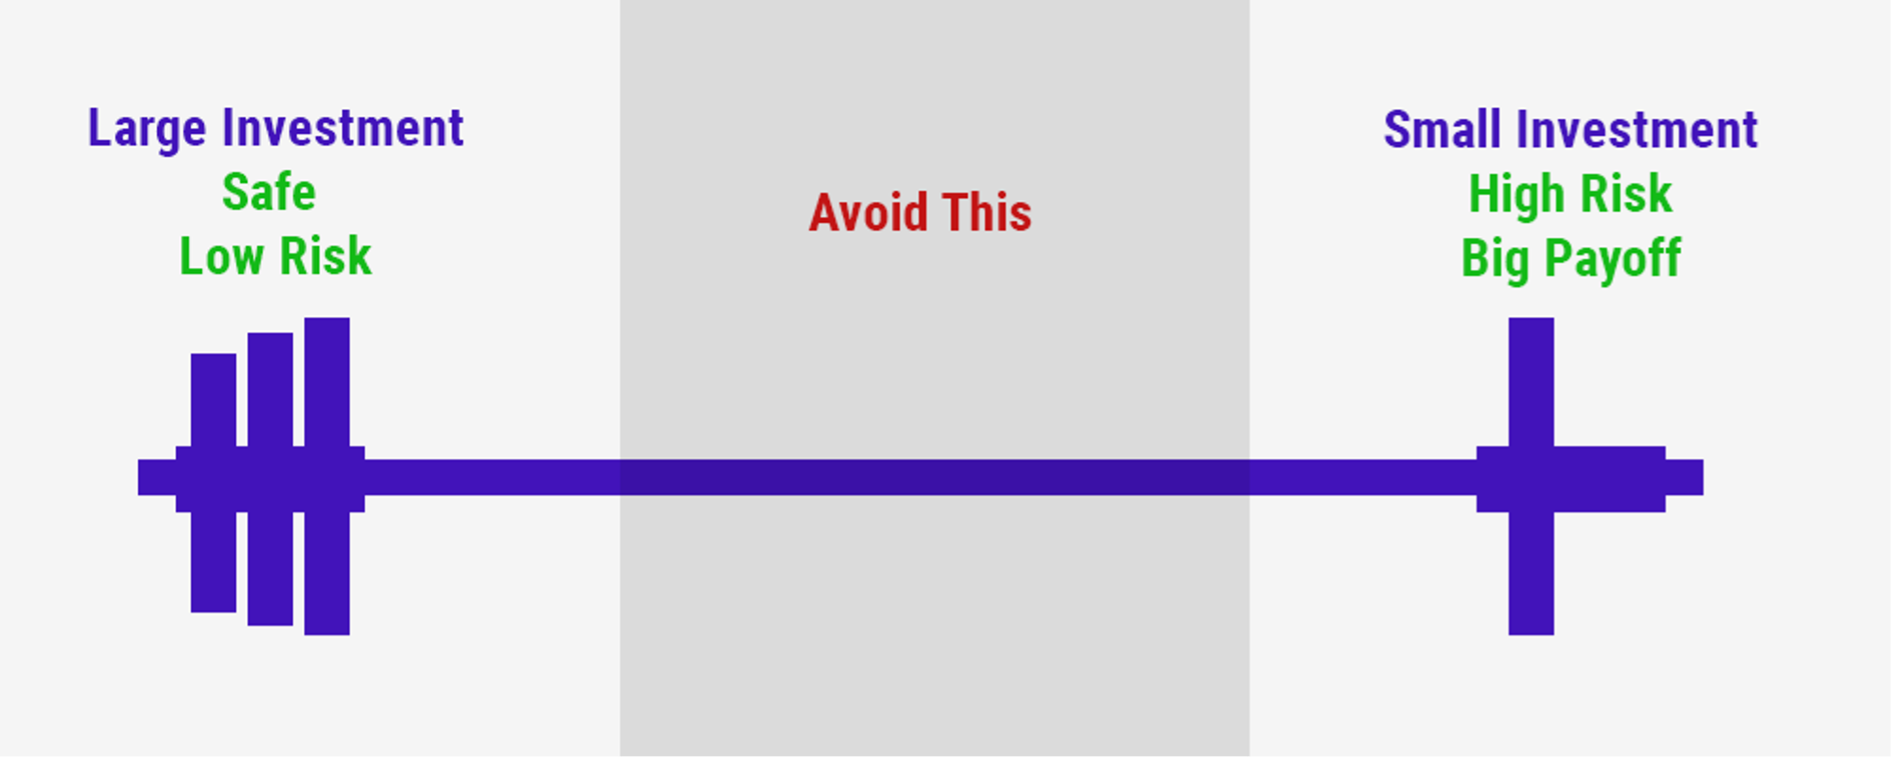
The ‘Barbell Strategy’ is a classic portfolio management method whose core idea is
Configuration Structure Schematic:
━━━━━━━━━━━━━━━━━━━━━━━━━━━━━━━━━━━━━━━━━━━━━━━━
High Odds Offensive End              Middle Gap              High Certainty Defensive End
(15%-25%)                                   (75%-85%)
━━━━━━━━━━━━━━━━━━━━━━━━━━━━━━━━━━━━━━━━━━━━━━━━
• Option Buyer           No allocation to mediocre assets        • High Dividend Stocks
• Deep Contango Index Futures                             • Graded A Merger Redemption
• Event Arbitrage                                  • IC Contango Arbitrage
• Small-Cap High-Growth Stocks                              • Cash Equivalents
━━━━━━━━━━━━━━━━━━━━━━━━━━━━━━━━━━━━━━━━━━━━━━━━
Assume portfolio return is R and risk is σ:
- Return Side: E[R] = w₁·R₁ + w₂·R₂ (weighted return of both ends)
- Risk Side: σ² = w₁²·σ₁² + w₂²·σ₂² + 2w₁w₂ρ₁₂σ₁σ₂
The key here is controlling overall volatility through
- Convex Return: One end provides extreme return potential, the other provides a safety cushion
- Nonlinear Hedging: Avoid systemic risk of linearly correlated assets
- Liquidity Management: Defensive end provides liquidity to handle extreme situations
According to practical cases shown in search results [1]:
- Offensive End (15%): Allocate deep out-of-the-money options, loss locked at 3%, profit potential over 300%
- Defensive End (85%): High-certainty cash cows (Graded A, index futures contango arbitrage)
- Pulse Risk Control: Three-dimensional protection (stop-loss line, position management, stress testing)
The fund manager mentioned by the user experienced an important evolution in investment philosophy, reflected in the redistribution of cognitive weights:
| Dimension | Weight for Traditional Stock Pickers | Weight for System Guardians | Core Competency Requirements |
|---|---|---|---|
Stock Selection Ability |
70% | 10% |
Fundamental research, valuation modeling |
Capital Management |
20% | 40% |
Position control, rebalancing, liquidity management |
Psychological Control |
10% | 50% |
Emotion management, cognitive bias correction, decision discipline |
- Pursue Alpha returns, rely on individual stock selection ability
- Ignore systemic risk exposure
- Overconfidence leads to concentrated positions
- Treat investment as a probability game, not a prediction game
- Establish an ‘antifragile’ mechanism (profit from black swans)
- Limit human weaknesses through quantitative rules
In traditional active investment, investors have 100% decision-making power, but this is precisely the biggest source of risk:
Decision-Making Delegation Model:
┌─────────────────────────────────────────────────┐
│        Full Investment Decision-Making Process   │
├─────────────┬───────────────────────────────────┤
│   Human Decision    │          Systematic Decision               │
├─────────────┼───────────────────────────────────┤
│ ✗ Emotional     │ ✓ Rule-Driven                        │
│ ✗ Inconsistent     │ ✓ Repeatable                          │
│ ✗ Hard to Replay   │ ✓ Traceable                          │
│ ✗ Affected by Cognitive Bias │ ✓ Statistical Advantage                        │
│   Influence       │                                   │
└─────────────┴───────────────────────────────────┘

Decision-Making Delegation:
- 30% Quantitative Strategy (Automatic Execution)
- 40% Risk Control Rules (Mandatory Constraints)
- 30% Human Judgment (Only Used Outside the System)
-
Level 1 - Hard Rules(Automatic Execution):
- Auto-reduce position when stop-loss line is triggered
- Single asset weight cap (e.g., 10%)
- Reduce leverage when portfolio volatility exceeds limit
-
Level 2 - Quantitative Signals(Semi-Automatic):
- Technical indicator buy/sell signals
- Volatility threshold warning
- Correlation monitoring
-
Level 3 - Human Judgment(Restricted Permissions):
- Only used in extreme situations not covered by the system
- Requires double confirmation mechanism
- Decisions need to be recorded and replayed
Sharpe Ratio = (Rp - Rf) / σp

Where:
- Rp = Portfolio Return
- Rf = Risk-Free Rate
- σp = Portfolio Volatility (Standard Deviation)

Goal: Sharpe >1.0 means for every unit of risk taken,
you get >1 unit of excess return
According to search results, the fund manager achieved the following performance indicators:
- Sharpe Ratio: >1.0
- Maximum Drawdown: -13.3%
- Barbell strategy offensive end: Small positions in high-odds targets boost overall returns
- Defensive end cash flow: High-dividend, arbitrage strategies provide stable returns
- Dynamic adjustment: Adjust weights of both ends based on market conditions
- Negative correlation allocation: Low correlation between offensive and defensive ends
- Volatility management: Control overall portfolio volatility within 15%
- Tail risk hedging: Option protection to prevent extreme declines
- After adopting the barbell strategy in 2025:
- Obtain stable returns from the defensive end (85%) (assuming 8%)
- Obtain excess returns from the offensive end (15%) (assuming 20%)
- Portfolio return: 0.85×8% +0.15×20% =9.8%
- Assume risk-free rate is 3%, portfolio volatility is6.8%
- Sharpe = (9.8% -3%)/6.8% =1.0 ✓
- Fundamental filter: ROE, free cash flow, moat assessment
- Valuation model: DCF, relative valuation, PEG
- Risk exclusion mechanism: Debt ratio, cash flow断裂 risk, corporate governance
f* = (bp - q)/b

Where:
f* = Optimal position ratio
b = Odds (profit/loss ratio)
p = Win rate
q = Loss rate (1-p)
- If a strategy has a 60% win rate and 2:1 odds
- f* = (2×0.6 -0.4)/2 =40%
- Actual Application: Use 0.5×f* =20% position considering estimation error
- Time trigger: Adjust weights quarterly
- Amplitude trigger: Adjust when weight deviates from target by ±5%
- Volatility trigger: Reduce position when portfolio volatility exceeds limit
###3. Psychological Control (50%): The Hardest Part of Investment
| Bias Type | Performance | Countermeasure Mechanism |
|---|---|---|
Confirmation Bias |
Only look at information supporting one’s own views | Pre-set falsification tests |
Loss Aversion |
Unwilling to stop loss when losing | Mandatory stop-loss rules |
Anchoring Effect |
Stick to purchase price | Focus on relative value |
Overconfidence |
Overestimate own prediction ability | Decision recording and replay |
Herd Effect |
Blindly follow the crowd | Independent thinking framework |
- Decision Log: Record logic, emotion, and result of each transaction
- Regular Replay: Review decision quality monthly, not just results
- Stress Testing: Assume response plans for extreme scenarios
- Third-Party Perspective: How would you operate if it were someone else’s account?
##7. Investment Competitiveness in the AI Era: Understanding Business Essence
In the AI era, the unique value of fund managers lies in:
- AI can process data, but it is difficult to understand the essence of business models
- Case: Sunac’s risk lies in the fragility of the ‘high leverage + pre-sale system’ model when policies shift
- This requires comprehensive judgment of business logic, policy environment, and industry cycle
- Management interviews, grassroots research, supply chain information
- These require human intuition and experience accumulation
- AI is trained on historical data and may fail in new crises
- Human crisis handling experience is crucial in extreme situations
┌─────────────────────────────────────────┐
│        AI-Enhanced Decision Framework   │
├─────────────────┬───────────────────────┤
│   AI Excels At        │    Humans Excel At            │
├─────────────────┼───────────────────────┤
│ ✓ Data Processing      │ ✗ Business Essence Understanding         │
│ ✓ Pattern Recognition      │ ✗ Logical Reasoning             │
│ ✓ Execution Discipline      │ ✗ Creative Thinking           │
│ ✓ Emotional Neutrality      │ ✗ Value Judgment             │
└─────────────────┴───────────────────────┘

Best Practice:
- AI is responsible for: Data screening, signal generation, risk monitoring
- Humans are responsible for: Strategy design, exception handling, value assessment
##8. Discounted Free Cash Flow (DCF) and Investment Essence
Enterprise Value = Σ [FCFt/(1+WACC)^t]

Where:
FCF = Free Cash Flow = Operating Cash Flow - Capital Expenditure
WACC = Weighted Average Cost of Capital
t = Time Period
- Cash Flow Is King: Profits can be manipulated, but cash flow cannot
- Long-Termism: DCF focuses on long-term value creation ability
- Margin of Safety: Conservative DCF assumptions provide downside protection
-
Traditional DCF model assumptions:
- ✓ Going concern assumption
- ✓ Capital availability
- ✓ Market efficiency
-
Actual Situation of Sunac:
- ✗ Cash flow断裂 (pre-sale fund supervision)
- ✗ Financing channels closed
- ✗ Equity dilution due to debt restructuring
##9. Building a Complete Risk Control System That Survives Bull and Bear Markets
┌──────────────────────────────────────┐
│  Pre-Risk Control Checklist          │
├──────────────────────────────────────┤
│1. Single asset weight cap (e.g.,10%) │
│2. Industry concentration limit (e.g.,<30%) │
│3. Liquidity requirement (cash + high-liquidity assets >20%) │
│4. Debt ratio screening (exclude high-debt targets) │
│5. Valuation margin of safety (require 30% discount) │
└──────────────────────────────────────┘
Real-Time Monitoring Indicators:
- Portfolio volatility > target value → Reduce position
- Maximum drawdown >-10% → Trigger warning
- Correlation突变 >0.8 → Check concentration
- VaR(95%) exceeds limit → Reduce risk exposure
Extreme Situation Response Plan:
- Market crash >20%: Activate hedging tools
- Individual stock default: Stop loss immediately and re-evaluate
- Liquidity crisis: Activate cash reserves
- Black swan event: Restart stress testing
The concept of ‘antifragile’ was proposed by Nassim Taleb, referring to a system that not only resists pressure but becomes stronger under pressure.
- Option Protection: Purchase put options as insurance
- Tail Risk Arbitrage: Reverse layout during market panic
- Nonlinear Return Structure: Limited loss, unlimited profit
- Evolution Under Stress Testing: Optimize the system after each crisis
##10. Practical Advice: How to Build Your Own Barbell System
- What is the maximum drawdown you can accept? (e.g.,-15%)
- Expected annual return? (e.g.,10-15%)
- Investment period? (e.g., over 3 years)
- Tolerance for volatility?
| Asset Class | Allocation Ratio | Return Expectation | Risk Characteristics |
|---|---|---|---|
| High Dividend Stocks | 30% | 6-8% | Low volatility |
| Bonds/Fixed Income+ | 25% | 4-5% | Very low risk |
| Money Market Fund | 15% | 2-3% | Risk-free |
| REITs | 10% | 5-7% | Medium-low volatility |
| Gold ETF | 5% | 0-5% | Inflation hedge |
| Asset Class | Allocation Ratio | Return Expectation | Risk Characteristics |
|---|---|---|---|
| Tech Growth Stocks | 10% | 15-30% | High volatility |
| Option Strategy | 5% | -100%~300% | Extreme distribution |
| Emerging Theme | 5% | 20-50% | High uncertainty |
| Merger Arbitrage | 5% | 8-15% | Event-driven |
| Special Opportunities | 5% | Uncertain | Scenario-dependent |
Buy Conditions (All Must Be Met):
1. Valuation below 30th percentile of historical distribution
2. Fundamental score >80 points
3. Technicals not in a downward trend
4. Portfolio weight not exceeding cap

Sell Conditions (Any Triggered):
1. Valuation above70th percentile of historical distribution
2. Fundamental deterioration (e.g., earnings miss)
3. Stop-loss line triggered (single stock -15%)
4. Find better alternative opportunities
[ ] Is the portfolio Sharpe ratio up to standard?
[ ] Is the maximum drawdown within tolerance?
[ ] Do the weights of both ends need adjustment?
[ ] Are there new risk exposures?
[ ] How is the decision quality? Any violations?
Insights are generated using AI models and historical data for informational purposes only. They do not constitute investment advice or recommendations. Past performance is not indicative of future results.
About us: Ginlix AI is the AI Investment Copilot powered by real data, bridging advanced AI with professional financial databases to provide verifiable, truth-based answers. Please use the chat box below to ask any financial question.