Seres Investment Value Analysis
Unlock More Features
Login to access AI-powered analysis, deep research reports and more advanced features

About us: Ginlix AI is the AI Investment Copilot powered by real data, bridging advanced AI with professional financial databases to provide verifiable, truth-based answers. Please use the chat box below to ask any financial question.
Related Stocks
Based on the latest data analysis, Seres (601127.SH) has the potential to ‘turn the corner’ (from adversity to prosperity), but attention should be paid to valuation fluctuations and macro risks. The following analysis covers four dimensions: fundamentals, valuation, industry outlook, and risks.
Seres’ recent performance has been under pressure:
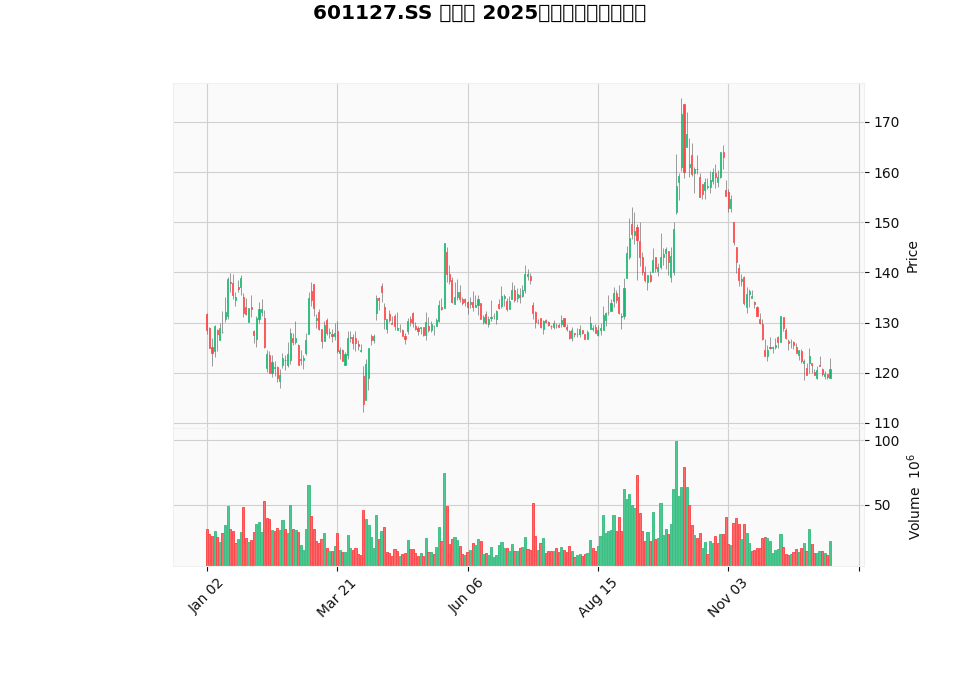
- Price Performance: Since the National Day holiday, the stock price has fallen by approximately 30%, with a 23.25% drop in the past three months and a cumulative decline of 6.12% year-to-date [0].
- Technical Indicators: As of the closing price on 2025-12-26 (120.67 yuan), technical indicators show an unclear trend (no clear MACD crossover, bearish KDJ), with a short-term trading range of approximately 119.15–123.14 yuan [0].
- Industry Environment: The non-essential consumer goods (discretionary/automotive) sector performed weakly on the day, falling by approximately 0.47% [0].
- Key Profitability Indicators: ROE (TTM) is approximately 32.11%, net profit margin is around 4.84%, and the upward trend in gross margin and operating margin continues [0].
- Revenue and Profit Trend: Q3 2025 EPS was 1.45 yuan, far exceeding the market expectation of 0.02 yuan; quarterly revenue reached 48.13 billion yuan, a year-on-year increase of approximately 74.7%, verifying the driving effect of the “Aito” series’ volume growth [0]. The 5-year historical revenue CAGR is as high as 78.5%, reflecting extremely high growth potential [0].
- Q3 Report Expenses and Year-over-Year Disturbances: There are divergences in the market’s interpretation of the increase in expenses and year-over-year data in the Q3 report. However, from the company’s perspective, the expense expansion is related to R&D, production capacity, and channel investment, which is a normal phenomenon in the high-growth stage. Subsequent scale effects are expected to dilute the expense ratio.
- Free Cash Flow: The latest free cash flow is approximately 15.371 billion yuan, showing significant improvement [0]. The accounting approach is relatively conservative, with high proportions of depreciation and capital expenditures, leaving room for subsequent profit release [0].
- Liquidity: The current ratio is approximately 0.91, and the quick ratio is around 0.87, slightly below 1. Attention should be paid to the rhythm of short-term debt and working capital management, but combined with the improvement in hand orders and payment collection, liquidity risk is controllable [0].
- Product Structure: High-end models such as Aito M7 and M9 continue to see volume growth, with average unit prices and gross margins higher than the industry average. The iteration and capacity ramp-up of subsequent models like M8 will create incremental growth.
- Overseas Layout: Overseas factories in Indonesia, Mexico, etc., are planned to reach production capacity in 2026, opening a second growth curve and mitigating single-market fluctuations.
- Technical Reserves: With the superposition of Huawei’s Smart Selection car ecosystem and ADS (intelligent driving) iterations, the company is upgrading from “selling cars” to “providing intelligent mobility solutions”. The commercialization pace of L3/high-level intelligent driving will also enhance valuation premiums.
- New Business Imagination: Strategic directions such as robotics provide the company with a “call option” for medium-to-long-term valuation. Although short-term contributions are limited, they can enhance the market’s perception of its tech attributes.
- P/E (TTM): Approximately 27.30x, significantly higher than the average of the whole vehicle industry, matching its “high-end intelligent electric vehicle” attribute [0].
- P/B: Approximately 7.09x, reflecting asset premium in the high-growth stage [0].
- P/S: Approximately 1.32x, combined with high revenue growth rate, it is a relatively positive but not extreme level [0].
The three-scenario DCF analysis based on the base date of 2024-12-31 shows great valuation elasticity [0]:
- Conservative Scenario: Fair value is approximately 1399.22 yuan (about +1059.5% relative to the current price), assuming 0% revenue growth, -4.8% EBITDA margin, and 2% terminal growth rate.
- Base Scenario: Approximately 3970.57 yuan (+3190.4%), assuming 78.5% revenue growth, -5.1% EBITDA margin, and 2.5% terminal growth rate.
- Optimistic Scenario: Approximately 6040.64 yuan (+4905.9%), assuming 81.5% revenue growth, -5.3% EBITDA margin, and 3.0% terminal growth rate.
- Probability-Weighted Value: Approximately 3803.48 yuan (+3052.0%) [0].
- This valuation highly depends on the assumption of “high-speed growth + continuous improvement in profitability” and is very sensitive to changes in sales volume, product structure, cost control, and profit margins.
- The high valuation premium reflects the market’s long-term confidence in the company’s transformation toward high-end intelligent electric vehicles and robotics, but it also means that if growth slows or profit margin recovery is less than expected in the future, there is a high risk of valuation compression.
- Total Volume and Structure: In 2025, the penetration rate of new energy vehicles in China will continue to rise, but the growth rate will slow down, and the industry will enter the “stock optimization + high-endization” stage. The Huawei Smart Selection car camp (Aito) has strong influence in the mid-to-high-end market due to its ecosystem and intelligent driving advantages.
- Competitive Situation: Competition among leading brands intensifies, with price wars and subsidy policies coexisting. The product iteration cycle is shortened, requiring car companies to continuously improve in supply chain management, cost control, and software capabilities.
- Market Space: Markets such as Southeast Asia and Latin America have strong demand for cost-effective intelligent electric vehicles, providing incremental growth for the company.
- Localization Barriers: Overseas factory construction, supply chain localization, and service system building require time and investment. The 2026 production capacity expectation needs to track capacity ramp-up and policy environment.
- Intelligent Driving: The key window period for high-level intelligent driving to move from “pilot to large-scale commercialization”. Car companies with data closed-loop capabilities and computing power investment will enjoy valuation premiums.
- Robotics and New Businesses: Automobile manufacturers are extending to humanoid robots, smart energy, etc. The valuation logic is partially evolving from manufacturing to “intelligent manufacturing platform”, but the contribution realization will take more than 3-5 years.
- Valuation Digestion Pressure: Before profits are fully released, a high P/E ratio needs continuous exceeding-expectation support; if future growth is less than expected, valuation regression will amplify stock price fluctuations.
- Technology and Product Rhythm: Intelligent driving iterations and new car cycles face uncertainties and supply chain disturbances; changes in technical routes (such as switching preferences between pure electric and extended-range) may affect product structure.
- Policy and Macro: Subsidy withdrawal, export tariffs, and rising overseas compliance costs will affect export profit margins and pricing strategies.
- Liquidity Risk: The short-term current ratio is low; it is necessary to ensure a stable match between hand order payment collection and debt structure [0].
- Capital Preference and Sentiment: Current capital hotspots are rotating from the automotive sector to other fields, which may suppress valuation repair in the short term.
- Optimistic Scenario (Medium Probability): The 2026 sales target of approximately 650,000 units is successfully achieved, overseas production capacity ramps up as scheduled, L3 intelligent driving is commercially launched, and the valuation logic of new businesses is strengthened; combined with significant profit margin repair brought by expense ratio optimization, the stock price is expected to experience a “Davis Double Click” of valuation and profit.
- Neutral Scenario (High Probability): Domestic sales grow steadily, overseas business contributes gradually, but gross margin and profit margin repair are slow; valuation remains oscillating at current high levels; the stock price is more affected by industry beta and capital rotation.
- Pessimistic Scenario (Low Probability but Need to Be Alert): Intensified industry price wars, blocked overseas expansion, and less-than-expected technology landing lead to a significant slowdown in growth; valuation falls from high levels, combined with less-than-expected profits, putting pressure on the stock price.
- Long-term Growth Investors: Can deploy in batches at low prices, focusing on tracking quarterly delivery data, changes in gross margin, and overseas production capacity progress.
- Short-term/Band Investors: Seize policy catalysts (such as intelligent driving/export policies) and financial report disclosure windows, and pay attention to high volatility risks.
[0] Gilin API Data
Insights are generated using AI models and historical data for informational purposes only. They do not constitute investment advice or recommendations. Past performance is not indicative of future results.
About us: Ginlix AI is the AI Investment Copilot powered by real data, bridging advanced AI with professional financial databases to provide verifiable, truth-based answers. Please use the chat box below to ask any financial question.