Comprehensive Analysis of Investment Value and Financial Status of EGing Photovoltaic (600537)
Unlock More Features
Login to access AI-powered analysis, deep research reports and more advanced features
About us: Ginlix AI is the AI Investment Copilot powered by real data, bridging advanced AI with professional financial databases to provide verifiable, truth-based answers. Please use the chat box below to ask any financial question.
Related Stocks
Based on the latest data analysis of EGing Photovoltaic, industry background research, and evaluation of public compliance information, the following is a comprehensive assessment of the impact of the company’s legal disputes and capacity issues on its investment value and financial status:
- Current Stock Price: 4.33 yuan (as of 2025-12-26)
- Market Capitalization: 5.13 billion yuan
- 52-Week Price Range: 2.60 - 5.12 yuan
- P/E Ratio (TTM): -2.96 (sustained losses)
- P/B Ratio (TTM): 22.80
- Return on Equity (ROE): -520.26%
- Net Profit Margin: -74.51%
- Current Ratio: 0.88 (below 1.0, liquidity pressure)
- Quick Ratio: 0.75
- Latest Quarterly EPS (2025Q3): -0.05 yuan
- Q3 Revenue: 375 million yuan
- Free Cash Flow: -138 million yuan (persistent cash flow pressure)
- Debt Risk Rating: High Risk (classified by financial analysis tools) [0]
- Year-to-Date (YTD) Increase: +40.13% (rebound trend)
- 6-Month Increase: +50.87%
- 3-Year Cumulative Return: -23.09% (weak long-term trend)
- Volatility: Daily return standard deviation of approximately 3.51% [0]
- Technical Aspect: Shows sideways/shock consolidation state, trading range of about 4.01-4.42 yuan; Beta=0.61 (low elasticity to CSI 300) [0]
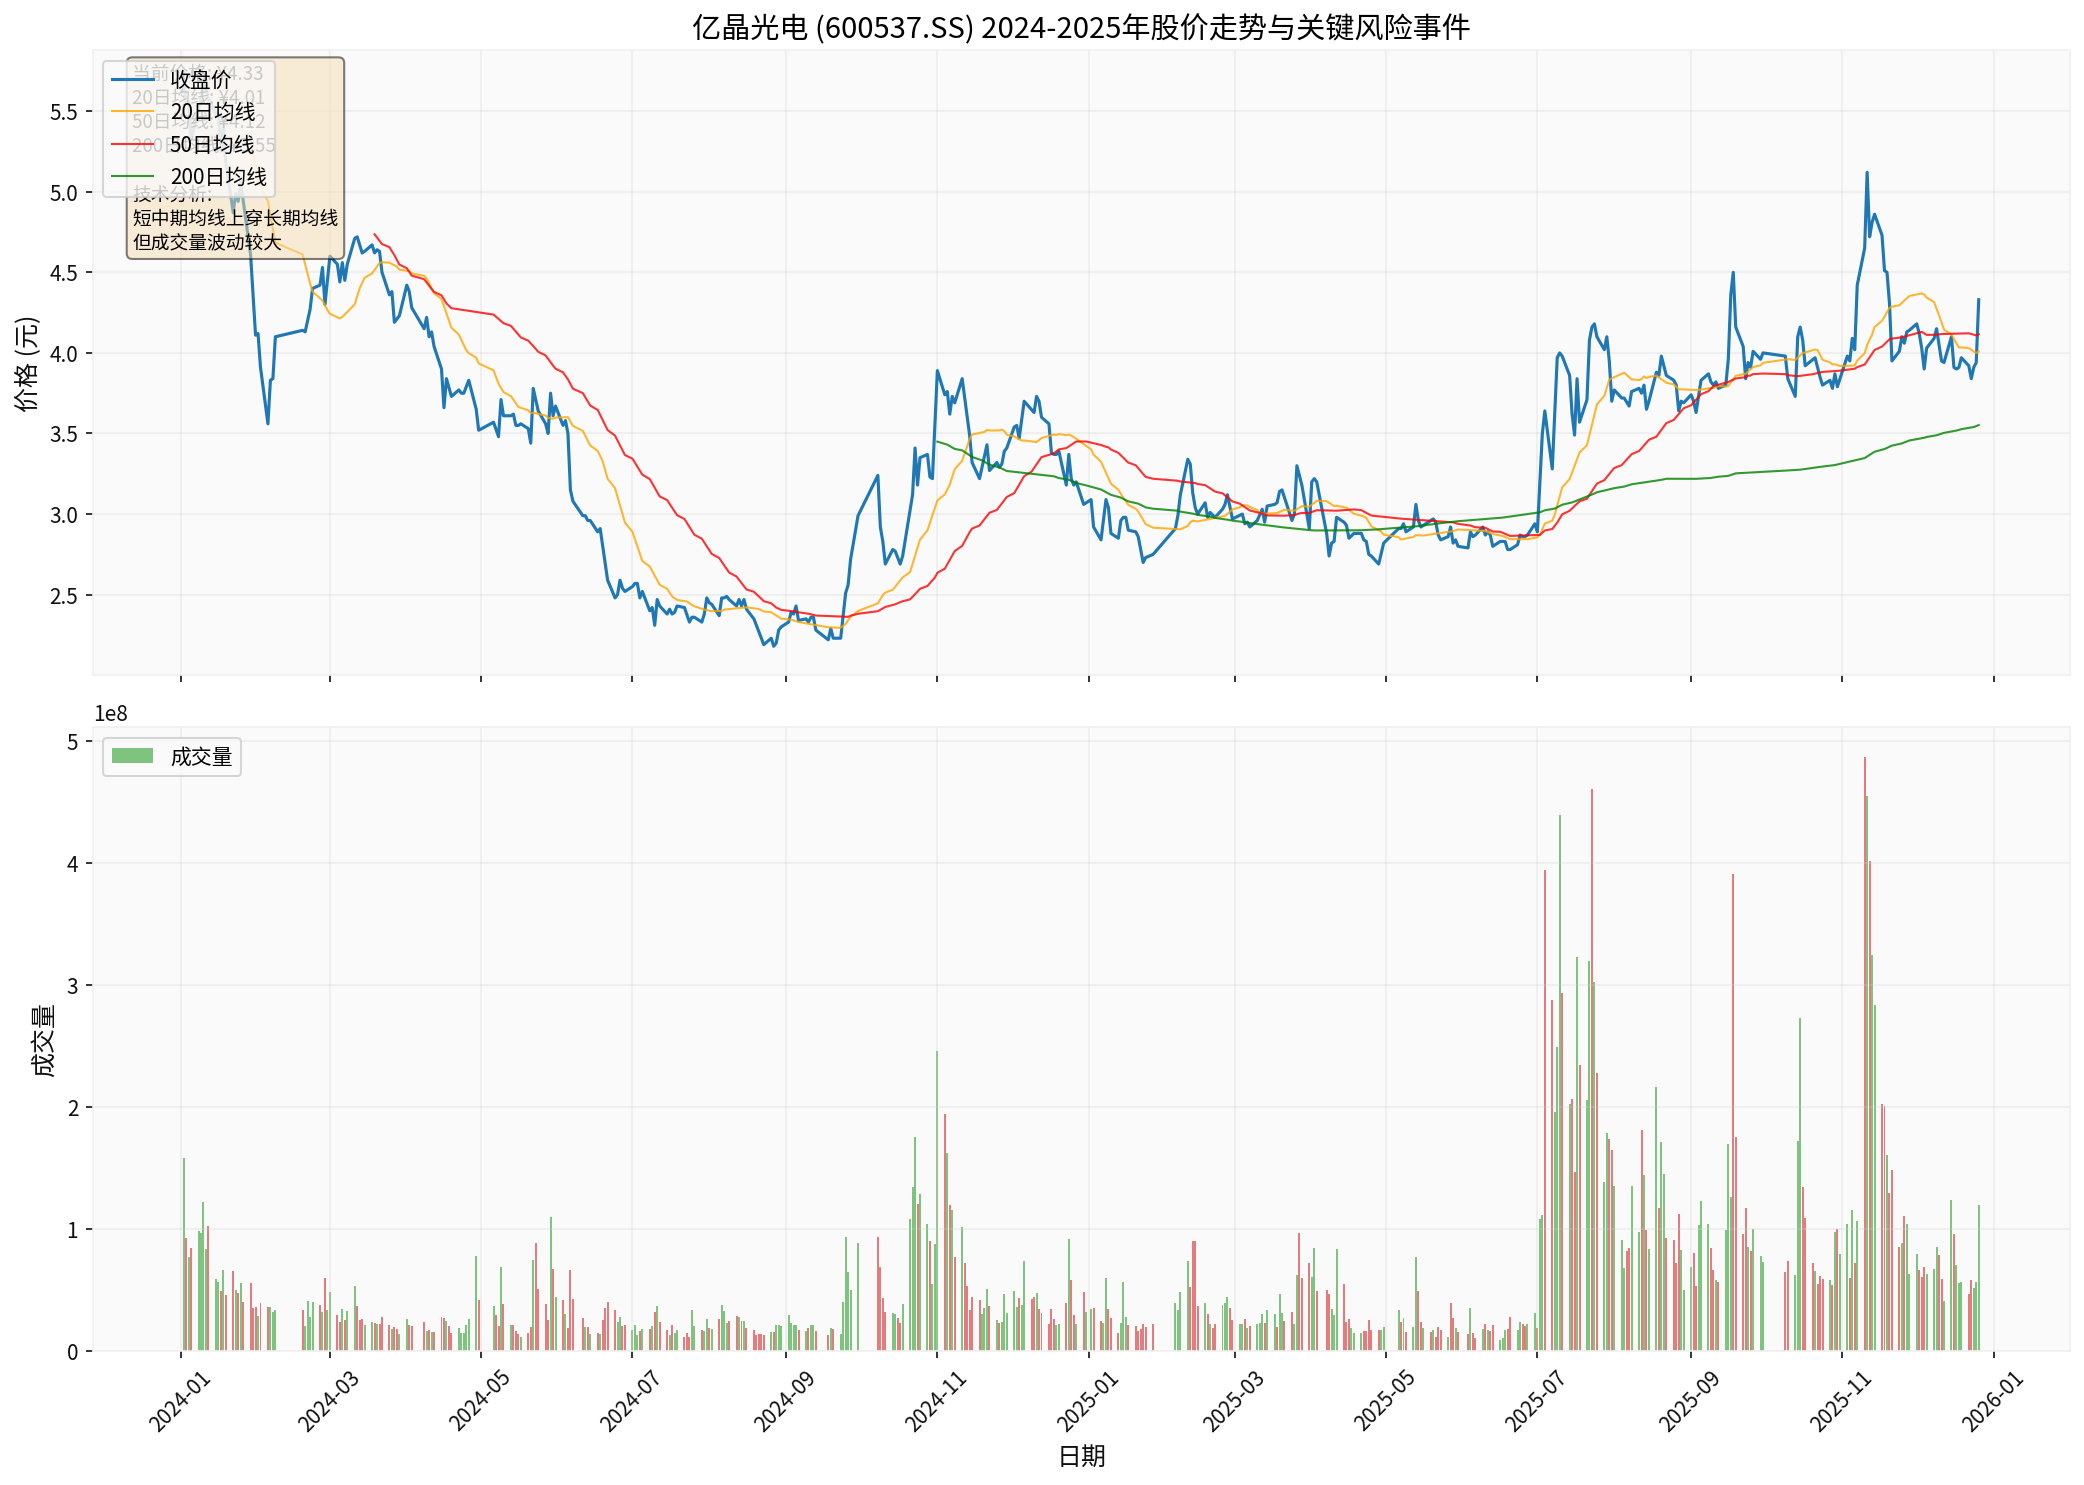
Chart Description: This chart is generated based on exchange market data, showing closing prices and 20/50/200-day moving averages from 2024 to 2025. Key events in the chart: “Chuzhou Base Shutdown” corresponds to information disclosed by the company (see later section); “140 Million Yuan Recovery Notice” refers to risk matters faced by the company as per public compliance materials.
Based on public compliance information, the company’s main legal and financial risks include:
- Project Investment Agreement Dispute Risk: The Quanjiao County Photovoltaic Project (planned on a large scale) only completed Phase I (about 7.5GW), with subsequent progress restricted; the company has received notifications from relevant parties regarding the investment agreement, involving claims for breach of contract such as “termination of the investment agreement”, “recovery of 140 million yuan capital contribution”, and “repayment of construction-agent fees and capital occupation costs” (derived from summaries of public disclosure documents and interpretations of announcement images on compliance platforms).
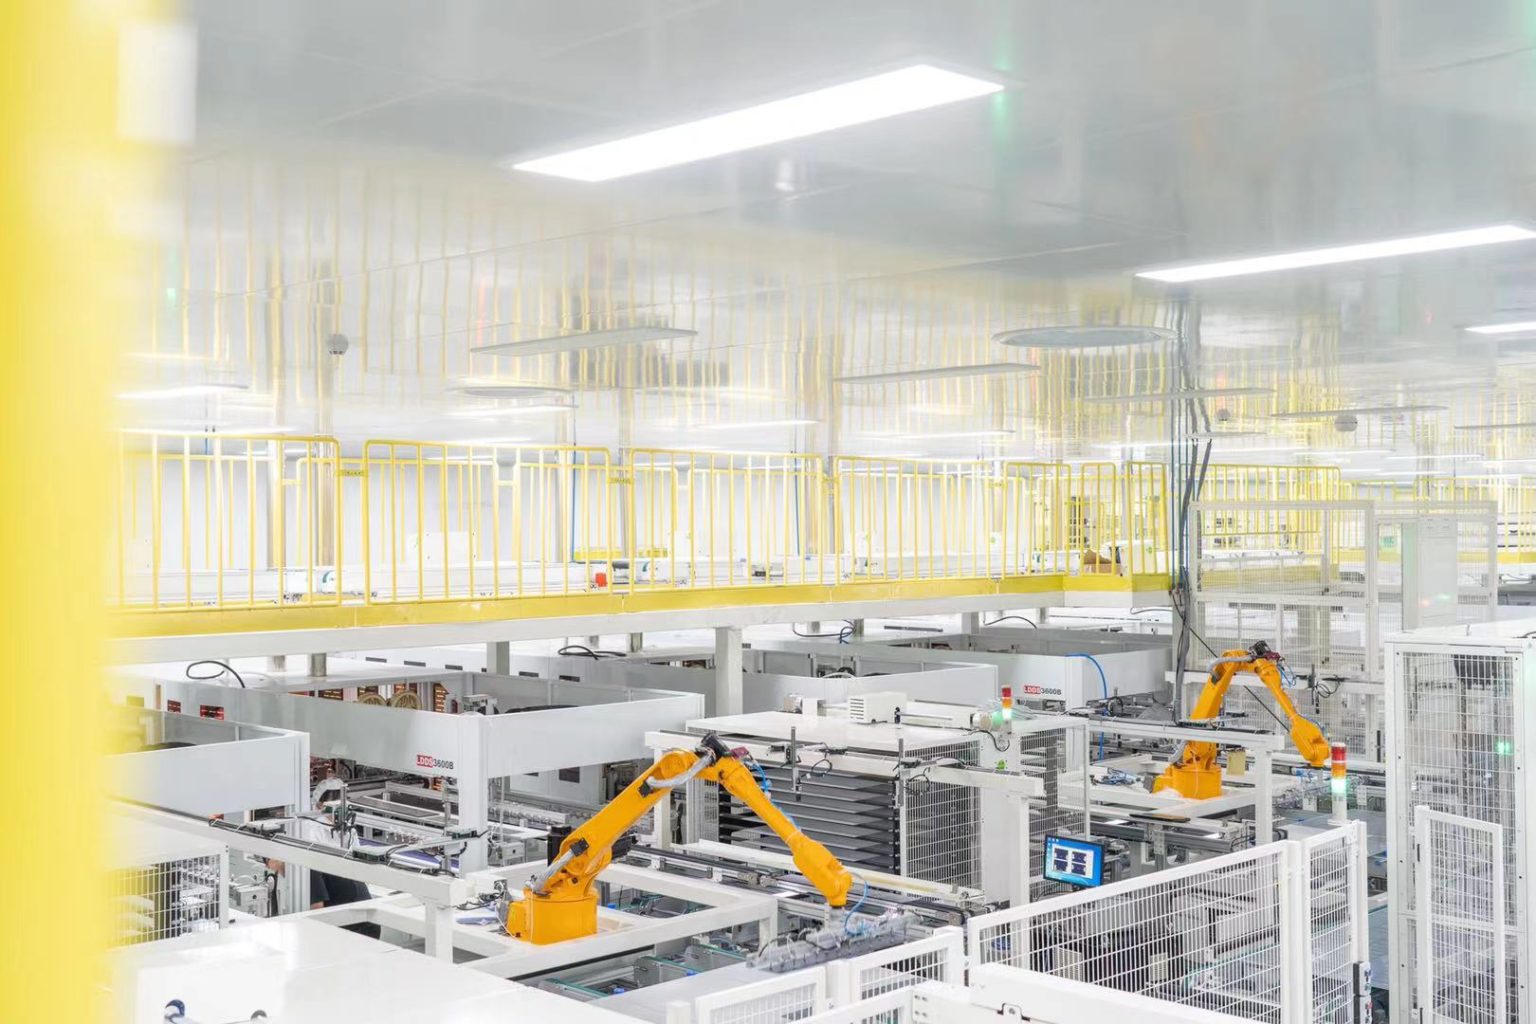
- Shutdown and Operational Adjustments: The company’s Chuzhou Base has been shut down since October 2024, which is related to project progress and industry environment; the shutdown has put pressure on the company’s current capacity and revenue.
- Contingent Liabilities and Contingent Losses: If the claims of relevant parties are finally supported through arbitration/litigation, in addition to the 140 million yuan capital contribution, the company may need to bear construction-agent fees, capital occupation costs, and legal fees.
The following is a quantitative assessment framework based on public information, with uncertain results:
- Impact on Net Assets: If all recovery claims are established, the 140 million yuan loss will directly reduce net assets. Based on the latest reporting period’s net assets, the net asset scale may decrease by approximately 27%-30% (estimated based on company-disclosed data), further weakening solvency and refinancing space.
- Cash Flow Pressure: The company’s free cash flow is negative (-138 million yuan) [0]; if an additional 140 million yuan and related costs need to be paid, the cash and liquidity situation will be further strained.
- Deterioration of Financial Ratios: Assuming losses are recorded in current profits and losses, indicators such as net profit margin, ROE, and current ratio may weaken further.
- Price Decline and Profit Squeeze: Solar panel prices have dropped from about $0.30/Watt in 2022 to about $0.10/Watt in early 2024 [1], reflecting supply-demand imbalance and price involution.
- Industry Consolidation Trend: To cope with overcapacity, industry leaders are promoting “anti-involution” and capacity optimization; several Chinese photovoltaic/silicon material enterprises have established an acquisition platform (initial scale of about 30 billion yuan) for “capacity optimization”, but M&A exits and closure of inefficient capacity face difficulties in financing and local interest coordination [2].
- Competition and Profit Pressure: Industry price wars and structural overcapacity weaken gross margins; leading enterprises have stronger risk resistance and profit recovery capabilities due to technology, scale, and overseas layout [3], while second-tier enterprises’ profit recovery is slower.
- Expansion Risks: The industry generally has insufficient capacity utilization, leading the company to be more cautious about promoting large-scale capital expenditure projects (such as Phase II and III projects), or even shelve them, further amplifying the impairment and repayment risks of previous investments.
- Legal and Contingent Liability Risks: If the 140 million yuan capital contribution and related costs are finally ruled to be borne, it will significantly affect the balance sheet and cash flow statement (public information shows that relevant notifications have been received, and recovery claims exist).
- Deterioration of Financial Health: Continuous losses, negative free cash flow, high debt risk rating [0], coupled with potential additional losses, exacerbate debt repayment and financing pressure.
- Stagnation of Strategic Projects: The Quanjiao Project only completed Phase I and subsequent progress is stagnant; coupled with the shutdown of the Chuzhou Base, revenue and growth expectations are weakened.
- Prolonged Industry Cycle Bottom: The recovery rhythm of photovoltaic industry prices and capacity utilization is uncertain; industry profit recovery requires time and policy/M&A-driven factors [1][2].
- Valuation and Rebound: The YTD increase of about +40.13% reflects market pricing of risks/events and partial expectation correction; however, the current P/B ratio is 22.80, combined with loss fundamentals, the valuation safety margin is limited.
- Industry Policies and Consolidation: If “anti-involution” and capacity optimization accelerate, leading enterprise consolidation may improve the competitive landscape; whether the company can benefit depends on its relative position in technology and cost.
- Capacity Restart and Cooperation: If the shutdown base restarts capacity through debt restructuring, government support, or partner collaboration, it is expected to partially offset the impact of negative cash flow (with high uncertainty).
- High-Risk Tolerance Investors: Can participate in trading opportunities with small positions and set strict stop-losses; given the sideways technical trend and high event uncertainty, it is advisable to enter and exit quickly and avoid long-term holdings.
- Conservative Investors: It is recommended to avoid or only observe; re-evaluate after any of the following situations occur: 1) Official announcements clearly state the exemption or significant mitigation of responsibilities related to the 140 million yuan; 2) The company reaches an executable written agreement with local governments/partners on project restart and cost sharing; 3) The industry shows a clear boom inflection point and the company’s quarterly reports verify substantial improvement in profits and cash flow.
- Company regular reports, interim announcements, and arbitration/litigation progress (qualification and amount of the 140 million yuan recovery).
- Liquidity indicators: Monetary funds, operating cash flow, refinancing progress, and guarantee/mortgage status.
- Industry indicators: Silicon material/module prices, capacity utilization rate, capital expenditure of leading enterprises, and capacity clearance rhythm [1][2].
[0] Jinling API Data (including company overview, real-time quotes, technical analysis, financial analysis, market data, and Python code-generated charts)
[1] WSJ — “China’s solar panel prices from 2022 to 2024 amid oversupply concerns” (Price trend chart and analysis)
[2] Reuters — “China’s polysilicon giants set up acquisition firm to tackle oversupply” (2025-12-10, background on industry consolidation platform and capacity optimization)
[3] Comprehensive financial and industry news reports — Trend of “anti-involution” in the photovoltaic industry and profit improvement of leading enterprises (cases like Longi Green Energy, JinkoSolar, etc.)
(Note: The specific release date of the announcement related to the “140 Million Yuan Recovery Notice (January 2025)” was not clearly identified in this search result; the above analysis does not rely on unconfirmed date assumptions. For further verification of announcement details, it is recommended to refer to the company’s official announcements and authoritative disclosure platforms.)
Insights are generated using AI models and historical data for informational purposes only. They do not constitute investment advice or recommendations. Past performance is not indicative of future results.
About us: Ginlix AI is the AI Investment Copilot powered by real data, bridging advanced AI with professional financial databases to provide verifiable, truth-based answers. Please use the chat box below to ask any financial question.