Nike (NKE) Days Inventory Change and Inventory Pressure Analysis
Unlock More Features
Login to access AI-powered analysis, deep research reports and more advanced features
About us: Ginlix AI is the AI Investment Copilot powered by real data, bridging advanced AI with professional financial databases to provide verifiable, truth-based answers. Please use the chat box below to ask any financial question.
Related Stocks
| Indicator | Value | YoY Change |
|---|---|---|
| Current Stock Price | $60.93 | +1.55% |
| Days Inventory (August 2025) | 105.04 days |
↓ 8.6 days |
| Days Inventory (August 2024) | 113.64 days | - |
| FY2025 Inventory | $7.489 billion | Flat |
| 52-Week Stock Price Range | $52.28 - $82.44 | - |
According to GuruFocus data, Nike’s days inventory decreased from
- Improved Inventory Management Capability: A decrease in days inventory means Nike is managing its inventory more effectively, shortening the cycle from goods warehousing to sale
- Industry Comparative Advantage: The 105.04-day turnover is better than the industry average of 126.01 days, and Nike ranks in the top 40% of the Manufacturing - Apparel and Accessories industry [1]
| Time Point | Inventory Amount (in millions of USD) | Trend |
|---|---|---|
| May 2022 | $9,326 | Peak Period |
| May 2023 | $8,454 | ↓ 9.4% |
| May 2024 | $7,519 | ↓ 11.1% |
| May 2025 | $7,489 | ↓ 0.4% |
- Nike’s inventory has decreased from the FY2023 peak of $8.454 billion to $7.489 billion in FY2025, a drop of11.4%[2][3]
- FY2025 inventory is roughly flat with FY2024 (only a slight drop of 0.4%), indicating that inventory clearance has entered a stable phase [3]
Latest quarterly data shows seasonal fluctuations in inventory:
- August 31, 2025: $8.114 billion (seasonal stocking)
- May 31, 2025: $7.489 billion (end of fiscal year)
- February 28, 2025: $7.539 billion
Inter-quarterly fluctuations are within the normal range, and the August peak conforms to the autumn stocking pattern of the apparel industry.
| Assessment Dimension | Status | Explanation |
|---|---|---|
| Inventory Turnover Efficiency | ✅ Improved | Days inventory decreased by 7.6%, outperforming industry average |
| Absolute Inventory Value | ✅ Decreased | Down 11.4% from FY2023 peak |
| Inventory-to-Revenue Ratio | ⚠️ Attention Needed | FY2025 revenue $46.3 billion, inventory-to-revenue ratio about 16.2% (FY2022: 18%) |
| Cash Flow Impact | ⚠️ Under Pressure | FY2025 cash and cash equivalents dropped to $7.464 billion (YoY -24%) [3] |
- Potential pressure from revenue decline (FY2025 revenue down 9.6% YoY) on inventory turnover [3]
- Challenges in the Greater China market may affect overall inventory efficiency
- Positive Factors: Significant results in inventory clearance, improved turnover efficiency
- Risk Factors: Revenue decline, stock price down 26% from peak, reduced cash flow
- Valuation Level: Current P/E ratio of 35.63x, slightly higher than historical average
[1] GuruFocus - Nike (NKE) Days Inventory (https://www.gurufocus.com/term/days-inventory/NKE)
[2] Macrotrends - NIKE Inventory 2012-2025 (https://www.macrotrends.net/stocks/charts/NKE/nike/inventory)
[3] NIKE, Inc. Reports Fiscal 2025 Fourth Quarter and Full Year Results (https://investors.nike.com/investors/news-events-and-reports/investor-news/investor-news-details/2025/NIKE-Inc--Reports-Fiscal-2025-Fourth-Quarter-and-Full-Year-Results/default.aspx)
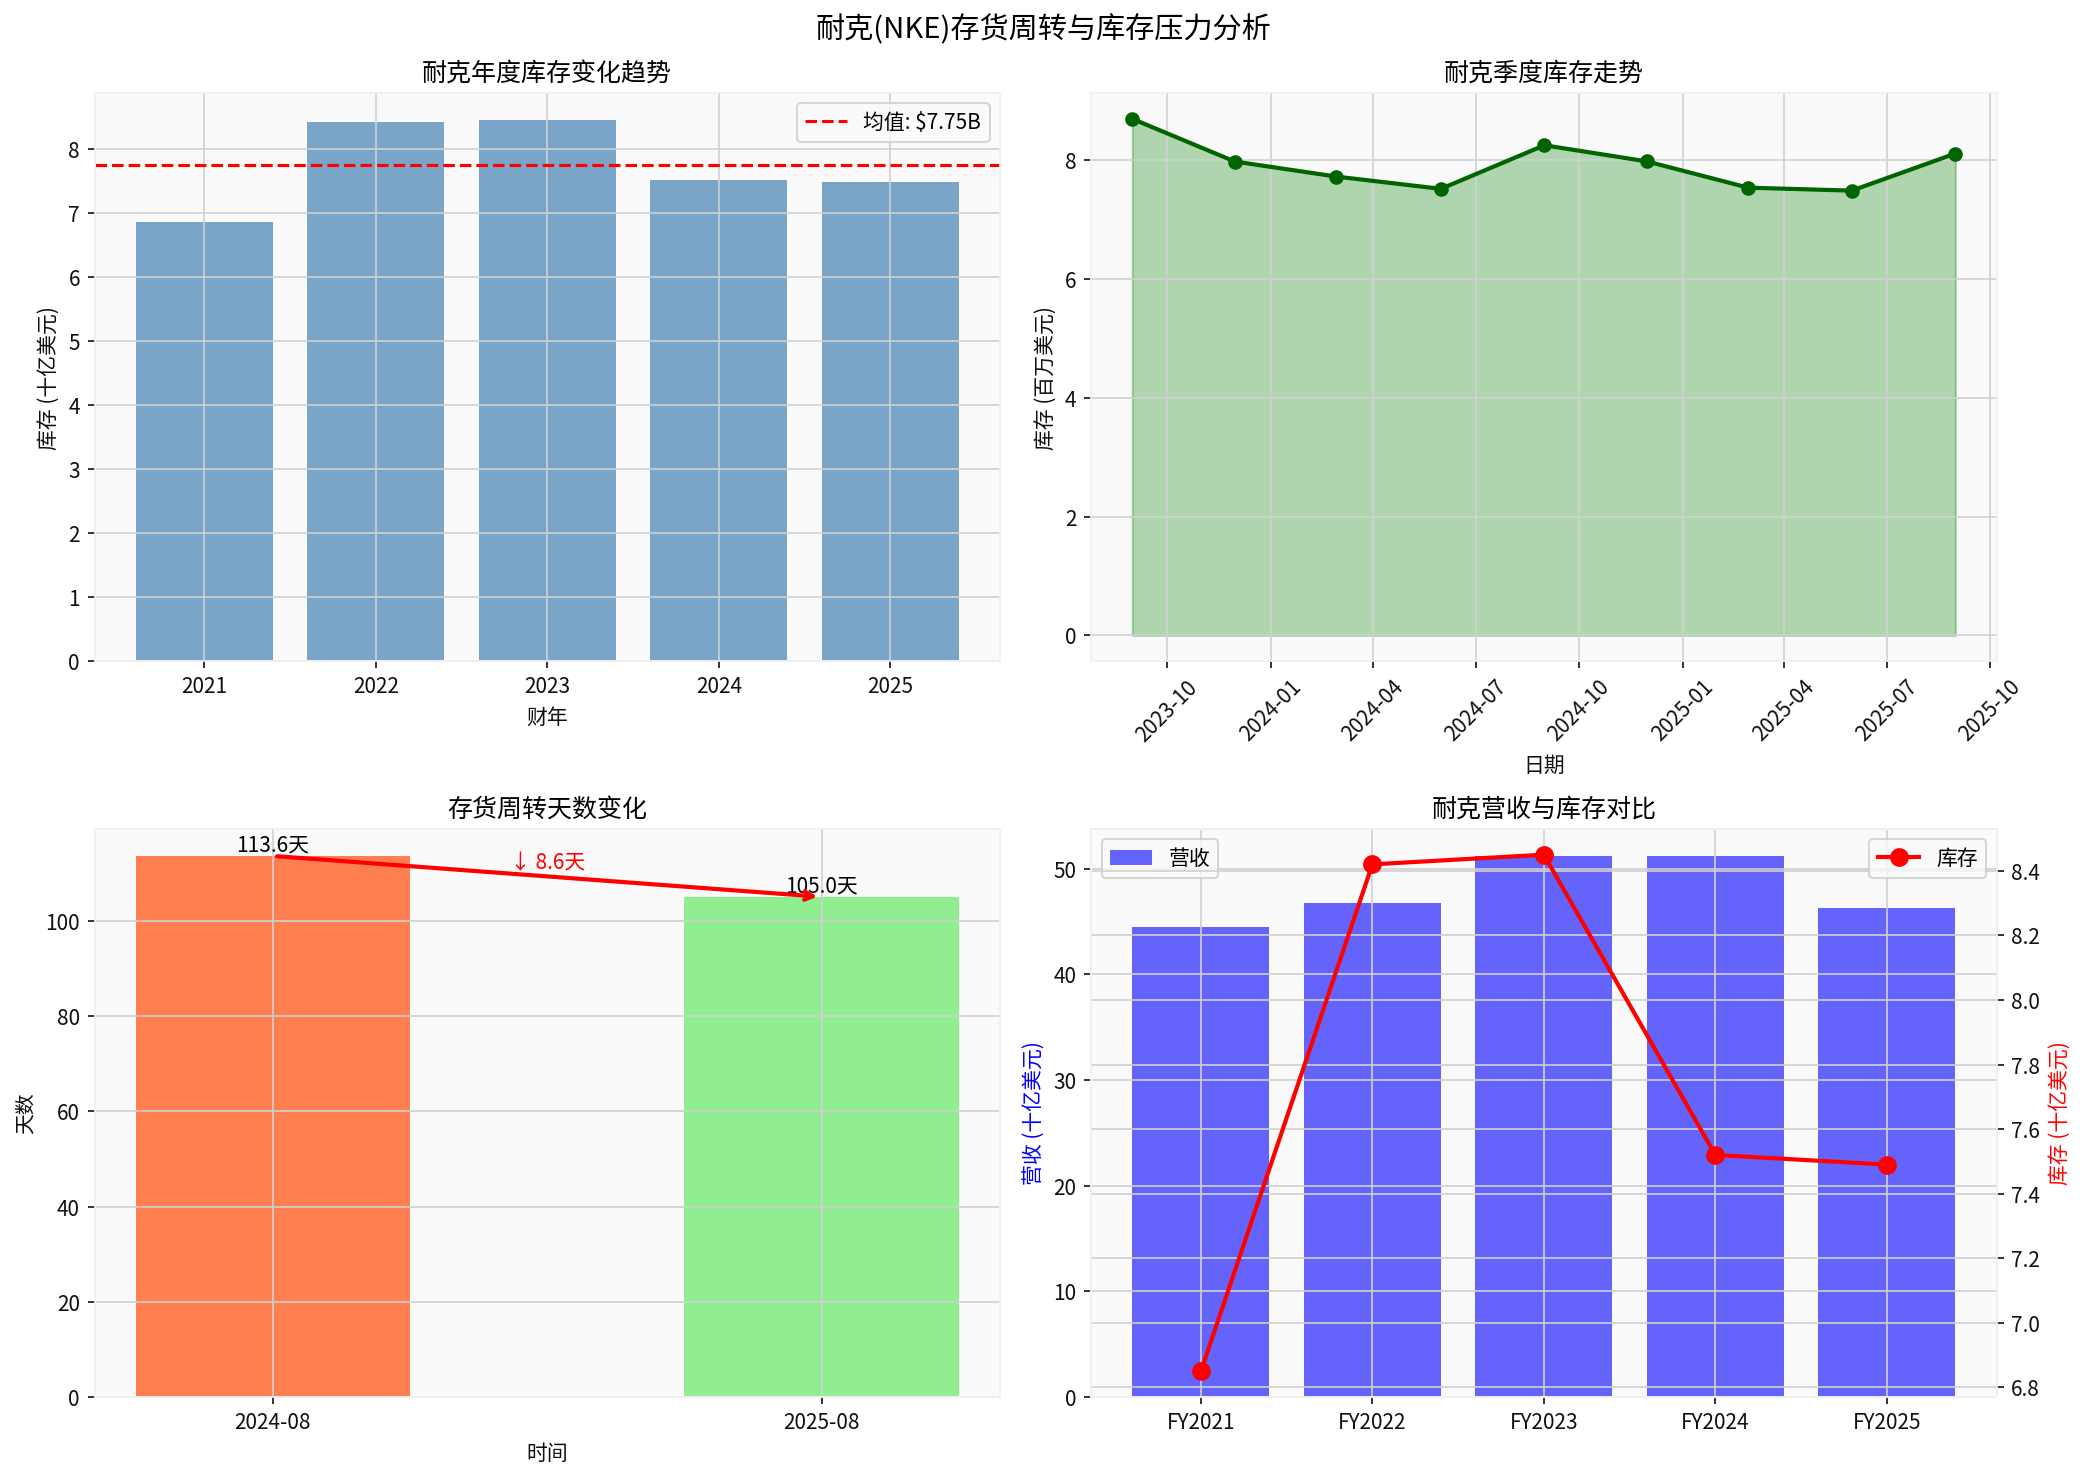
Chart Description: The chart above shows Nike’s inventory change trend from FY2019 to FY2025, quarterly inventory trend, comparison of days inventory, and correlation analysis between revenue and inventory.
耐克库存周转天数分析:去库存周期接近尾声,投资评级买入
Insights are generated using AI models and historical data for informational purposes only. They do not constitute investment advice or recommendations. Past performance is not indicative of future results.
About us: Ginlix AI is the AI Investment Copilot powered by real data, bridging advanced AI with professional financial databases to provide verifiable, truth-based answers. Please use the chat box below to ask any financial question.