Analysis of Investment Value in the Photovoltaic Industry Under Anti-Involution Policies — Comparative Study of Tongwei Co., Ltd. and Hesheng Silicon Industry
Unlock More Features
Login to access AI-powered analysis, deep research reports and more advanced features
About us: Ginlix AI is the AI Investment Copilot powered by real data, bridging advanced AI with professional financial databases to provide verifiable, truth-based answers. Please use the chat box below to ask any financial question.
Related Stocks
Now I will provide you with a comprehensive investment analysis report on the photovoltaic industry based on the obtained data.
The ‘anti-involution’ policy for the photovoltaic industry was launched in July 2024, with the main goal of solving the industry’s overcapacity problem. According to search results, the capacity of all links in the photovoltaic industry chain expanded rapidly in the past two years, leading to:
- Component overcapacity: Global component manufacturing capacity has reached nearly 4 times the annual demand [1]
- Industry-wide losses: The top 10 global component manufacturers lost a total of $2.2 billion in the first half of 2025 [2]
- Continuous price decline: The collapse of module prices affected all enterprises including the largest manufacturers [2]
From July 2024 to November 2025, relevant departments introduced a series of anti-involution measures, including:
- Capacity regulation policies
- Credit lending restrictions
- Higher industry access thresholds
- Encouraging the development of upstream core materials (such as polysilicon) and restricting blind expansion of mid-downstream links
According to chart data from search results, polysilicon prices rose significantly in December 2025:
- Price increase: Polysilicon prices rose by 141.17% in December 2025 to 16.11 yuan/gram
- N-type polysilicon: Average transaction price was about 53,900 yuan/ton
- Industry chain impact: The proportion of polysilicon in the cost of photovoltaic modules increased significantly, promoting value restructuring of the industry chain
| Financial Indicator | Current Value | Evaluation |
|---|---|---|
| Market Capitalization | 95.88 billion yuan | Industry Leader |
| Current Stock Price | 21.79 yuan | -1.36% (YTD) |
| EPS (TTM) | -1.86 yuan | In Loss Status |
| P/E | -11.72x | Negative, in Loss Cycle |
| P/B | 2.19x | Above Book Value |
| ROE | -18.28% | Profitability Under Pressure |
| Current Ratio | 1.24 | Liquidity Acceptable |
| Quick Ratio | 0.99 | Short-Term Debt Repayment Pressure Exists |
- Q1: EPS -0.75 yuan, Revenue 23.72 billion yuan
- Q2: EPS -0.52 yuan, Revenue 24.58 billion yuan
- Q3: EPS -0.07 yuan, Revenue 24.09 billion yuan
- Trend: Loss margin narrowed quarter by quarter, profitability gradually recovering [0]
| Financial Indicator | Current Value | Evaluation |
|---|---|---|
| Market Capitalization | 63.19 billion yuan | Medium-Sized Leader |
| Current Stock Price | 53.90 yuan | -1.57% (YTD) |
| EPS (TTM) | -0.02 yuan | Slight Profit Status |
| P/E | -2695.00x | Basically Invalid |
| P/B | 1.97x | Close to Book Value |
| ROE | -0.11% | Extremely Weak Profitability |
| Current Ratio | 0.31 | High Liquidity Risk |
| Quick Ratio | 0.11 | High Short-Term Debt Repayment Pressure |
- Q1: EPS 0.25 yuan, Revenue 6.32 billion yuan
- Q2: EPS -0.16 yuan, Revenue 4.55 billion yuan
- Q3: EPS 0.06 yuan, Revenue 5.43 billion yuan (Below Expectation)
- Trend: Performance fluctuates greatly, Q3 revenue increased by 7.6% YoY but EPS was far below expectation (-75.9%) [0]
| Indicator | Tongwei Co., Ltd. | Hesheng Silicon Industry |
|---|---|---|
| Opening Price at Year Start | 22.16 yuan | 55.44 yuan |
| Current Price | 21.79 yuan | 53.90 yuan |
| Annual Change | -1.67% | -2.78% |
| Annual High | 27.75 yuan (+25.1%) | 67.46 yuan (+21.7%) |
| Annual Low | 14.89 yuan (-32.8%) | 44.73 yuan (-19.3%) |
| Price Volatility | 2.81% (Daily) | 2.29% (Daily) |
| Maximum Retracement | -34.12% | -23.07% |
| Above 20-Day MA | 21.52 yuan | 52.90 yuan |
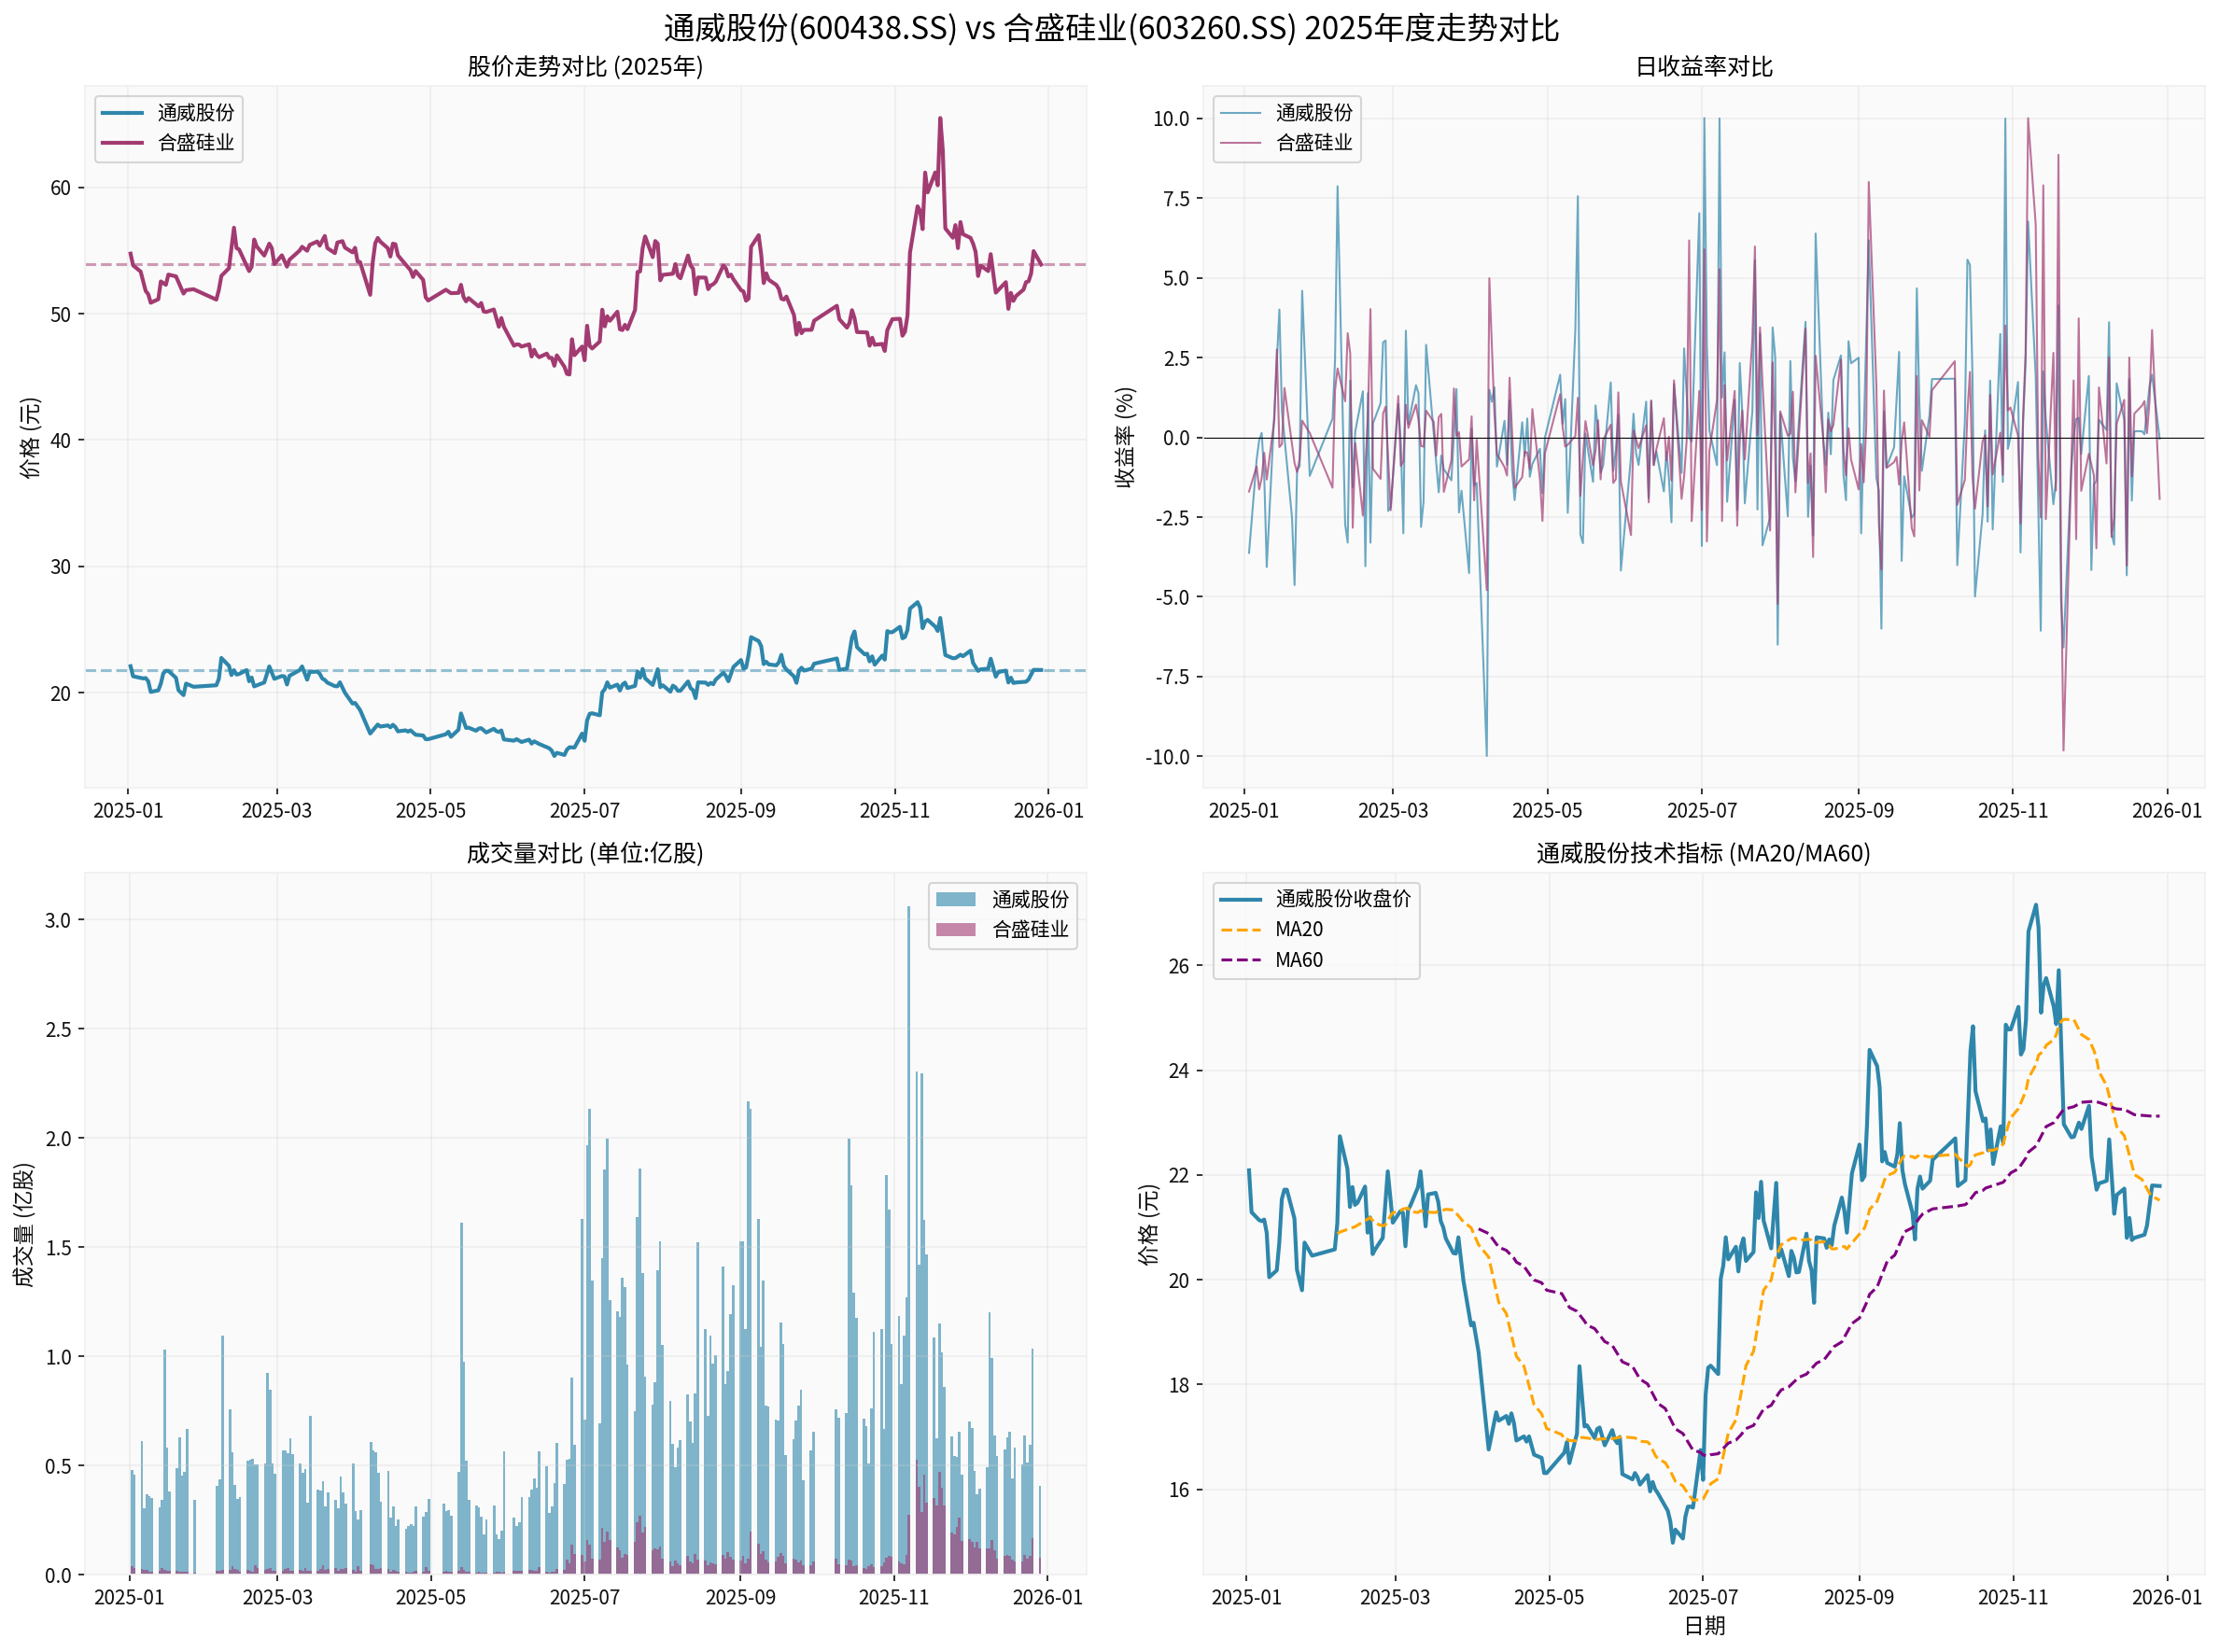
Chart Description: The above chart shows the 2025 annual stock price trends, daily returns, trading volume comparisons of Tongwei Co., Ltd. and Hesheng Silicon Industry, as well as Tongwei’s technical indicators (MA20/MA60).
- Trend: Sideways Oscillation, No Clear Direction
- Support Level:21.39 yuan
- Resistance Level:22.19 yuan
- KDJ Indicator: K:56.4, D:40.0, J:89.1 → Golden Cross Bullish Signal
- Beta:0.7 vs CSI300, Volatility Lower Than Market
- Trend: Sideways Oscillation, No Clear Direction
- Support Level:52.90 yuan
- Resistance Level:54.84 yuan
- KDJ Indicator: K:72.5, D:60.8, J:96.0 → Golden Cross Bullish Signal
- Beta:0.25 vs CSI300, Low Volatility
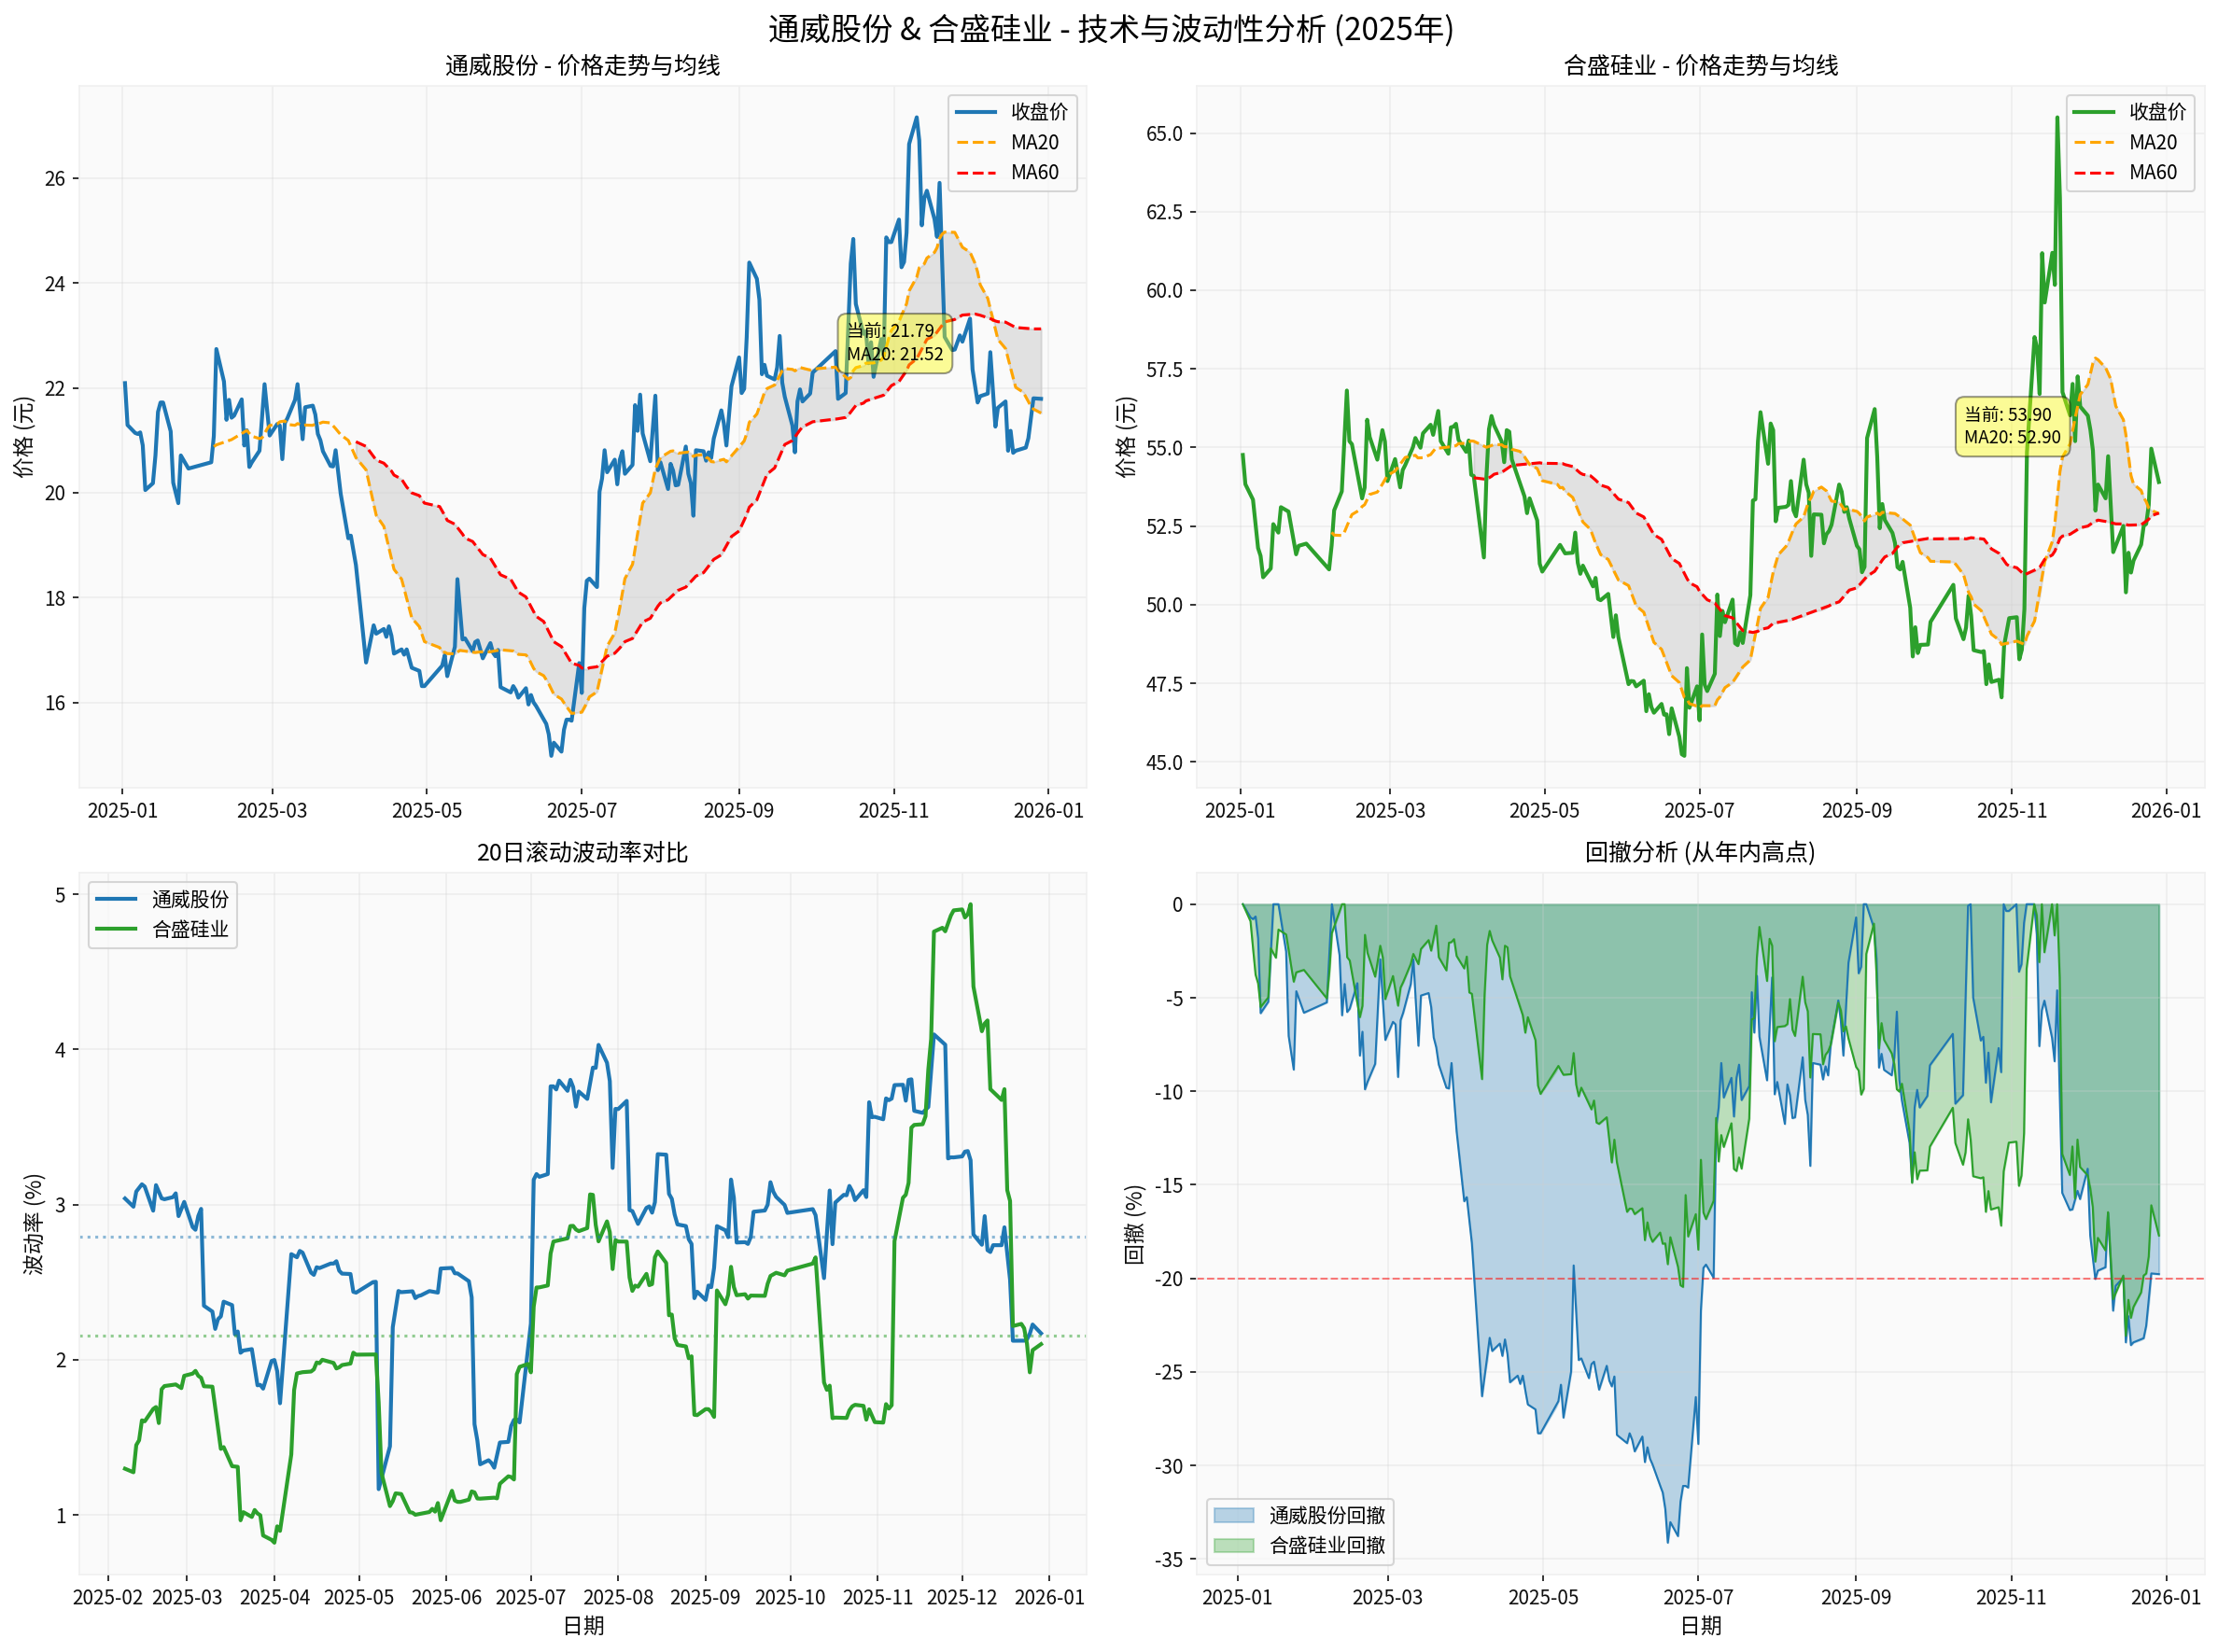
Chart Description: The above chart shows the price trends and moving averages, 20-day rolling volatility comparison of the two companies, as well as retracement analysis from the annual high. Tongwei Co., Ltd.'s maximum annual retracement reached 34%, significantly higher than Hesheng Silicon Industry’s 23%.
| Scenario | Intrinsic Value | Potential Increase |
|---|---|---|
| Conservative Scenario | 362.83 yuan | +1,565% |
| Baseline Scenario | 384.24 yuan | +1,663% |
| Optimistic Scenario | 750.22 yuan | +3,343% |
Probability Weighted |
499.10 yuan |
+2,191% |
- Revenue Growth Rate:20.1% (5-Year CAGR)
- EBITDA Margin:19.0%
- WACC:6.4%
- Terminal Growth Rate:2.5%
| Scenario | Intrinsic Value | Potential Increase |
|---|---|---|
| Conservative Scenario | 964.92 yuan | +1,690% |
| Baseline Scenario | 1,567.22 yuan | +2,808% |
| Optimistic Scenario | 4,375.76 yuan | +8,018% |
Probability Weighted |
2,302.63 yuan |
+4,172% |
- Revenue Growth Rate:31.3% (5-Year CAGR)
- EBITDA Margin:32.8%
- WACC:5.5%
- Terminal Growth Rate:2.5()
The DCF valuations of both companies show
- Historical high-growth period data (2020-2024 PV industry boom)
- Assumption of industry recovery from loss cycle
- Profit repair driven by polysilicon price recovery
| Dimension | Current Status | Judgment |
|---|---|---|
| Capacity Utilization Rate | Overall Low in Industry | Capacity Clearance Stage |
| Product Price | Polysilicon Price Rebounding | Price Bottoming and Recovering |
| Corporate Profit | Most in Loss, Some Reducing Losses | Profit Bottom Area |
| Policy Orientation | Anti-Involution, Capacity Control | Policy Supports Clearance |
| Technology Iteration | Rapid Penetration of N-Type Batteries | Technology Upgrade Period |
| Comparison Dimension | Tongwei Co., Ltd. | Hesheng Silicon Industry | Advantage Side |
|---|---|---|---|
| Market Position | Dual Leader in Polysilicon + Solar Cells | Industrial Silicon + Organic Silicon + Polysilicon | Tongwei |
| Business Structure | High Purity in PV | Diversified Business | Each Has Advantages |
| Profitability | In Loss but Improving Quarter by Quarter | Slight Profit, High Volatility | Tongwei |
| Financial Risk | Current Ratio 1.24 | Current Ratio 0.31⚠️ | Tongwei |
| Valuation Safety | P/B 2.19x | P/B1.97x | Hesheng More Affordable |
| Risk Resistance Ability | Stronger | Weaker (High Leverage) | Tongwei |
| Elasticity | Large Cycle Elasticity | Larger Cycle Elasticity | Hesheng |
- Gross Margin Repair: Polysilicon price recovery from the bottom directly improves upstream companies’ gross margin
- Capacity Value Enhancement: Value of high-quality capacity will be re-evaluated
- Accelerated Industry Integration: High-cost capacity exits, leading companies’ market share increases
- Sustainability of Price Increase: Doubtful whether demand can support continuous price increase
- Overcapacity Still Exists: Industry capacity clearance takes time
- Policy Regulation Intensity: Anti-involution policy intensity may affect price recovery space
| Investment Strategy | Recommended Target | Reason |
|---|---|---|
Stable Allocation |
Tongwei Co., Ltd. |
Industry Leader, Financial Stability, High Certainty of Profit Repair |
Elastic Allocation |
Hesheng Silicon Industry |
Low Valuation, High Elasticity, But Need to Bear Financial Risk |
Wait and See |
Wait for Industry Inflection Point Confirmation | Pay Attention to Capacity Clearance Progress and Continuous Price Recovery Signal |
- Investors with Strong Risk Tolerance: Can consider gradually building positions in Tongwei Co., Ltd. at current levels, with batch layout
- Conservative Investors: Suggest waiting for clear profit improvement signals of the industry before entering
- Polysilicon Price Trend: Continuously observe N-type polysilicon transaction price
- Capacity Utilization Rate: Whether industry operating rate回升 to above 80%
- Corporate Profit: Whether 2026 Q1-Q2 financial reports achieve overall profit
- Policy Implementation: Effect of anti-involution policies on backward capacity clearance
⚠️
⚠️
⚠️
⚠️
⚠️
- Obvious Industry Bottom Characteristics: After long-term adjustment, the photovoltaic industry shows multiple signals such as capacity clearance, policy regulation, price recovery, indicating it is at the cycle bottom area.
- Polysilicon Price Recovery is a Key Signal: The 141.17% increase in polysilicon prices in December 2025 indicates that the upstream supply-demand relationship is improving, but whether the price can continue to rise still needs observation.
- Tongwei Co., Ltd. Has More Allocation Value: As an industry leader, Tongwei Co., Ltd. is superior to Hesheng Silicon Industry in terms of profitability, financial stability, and business focus, making it more suitable as a core allocation target.
- Profit Recovery Will Be Gradual: Currently, the industry is still in loss or slight profit state; it takes time for price repair to transmit to profit, so 2026 will be a key observation window.
- Investment Strategy: Buy on Dips, Batch Layout: Suggest paying attention to industry inflection point signals, and gradually allocate high-quality leaders under risk control.
[0] Gilin API Data - Including real-time market, company overview, financial analysis, DCF valuation, technical analysis and other financial data
[1] Energetica India - “MNRE Flags Module Overcapacity, Urges Banks to Prioritise Funding Upstream Solar Components” (https://energetica-india.net/news/mnre-flags-module-overcapacity-urges-banks-to-prioritise-funding-upstream-solar-components)
[2] SolarQuarter - “JA Solar, Trinasolar Jointly Top Wood Mackenzie’s Global Solar Module Manufacturer Ranking for H1 2025” (https://solarquarter.com/2025/12/18/ja-solar-trinasolar-jointly-top-wood-mackenzies-global-solar-module-manufacturer-ranking-for-h1-2025/)
Insights are generated using AI models and historical data for informational purposes only. They do not constitute investment advice or recommendations. Past performance is not indicative of future results.
About us: Ginlix AI is the AI Investment Copilot powered by real data, bridging advanced AI with professional financial databases to provide verifiable, truth-based answers. Please use the chat box below to ask any financial question.