Analysis of the In-depth Impact of Institutional Derivative Hedging Strategies on the A-share Market
Unlock More Features
Login to access AI-powered analysis, deep research reports and more advanced features
About us: Ginlix AI is the AI Investment Copilot powered by real data, bridging advanced AI with professional financial databases to provide verifiable, truth-based answers. Please use the chat box below to ask any financial question.
After selling options, option market makers must perform dynamic hedging to manage risks:
- Delta Hedging: When the market rises, market makers need to buy spot to maintain neutrality; when it falls, they need to sell
- Gamma Squeeze: In extreme market conditions, the concentrated hedging operations of market makers will amplify price volatility, forming a positive feedback loop [0]
This mechanism leads to dual effects:
- Long-term: Hedging activities smooth market volatility and reduce overall volatility
- Short-term: When the market falls rapidly, the stop-loss selling by market makers will exacerbate the decline (such as the “midday plunge” mentioned in the article)
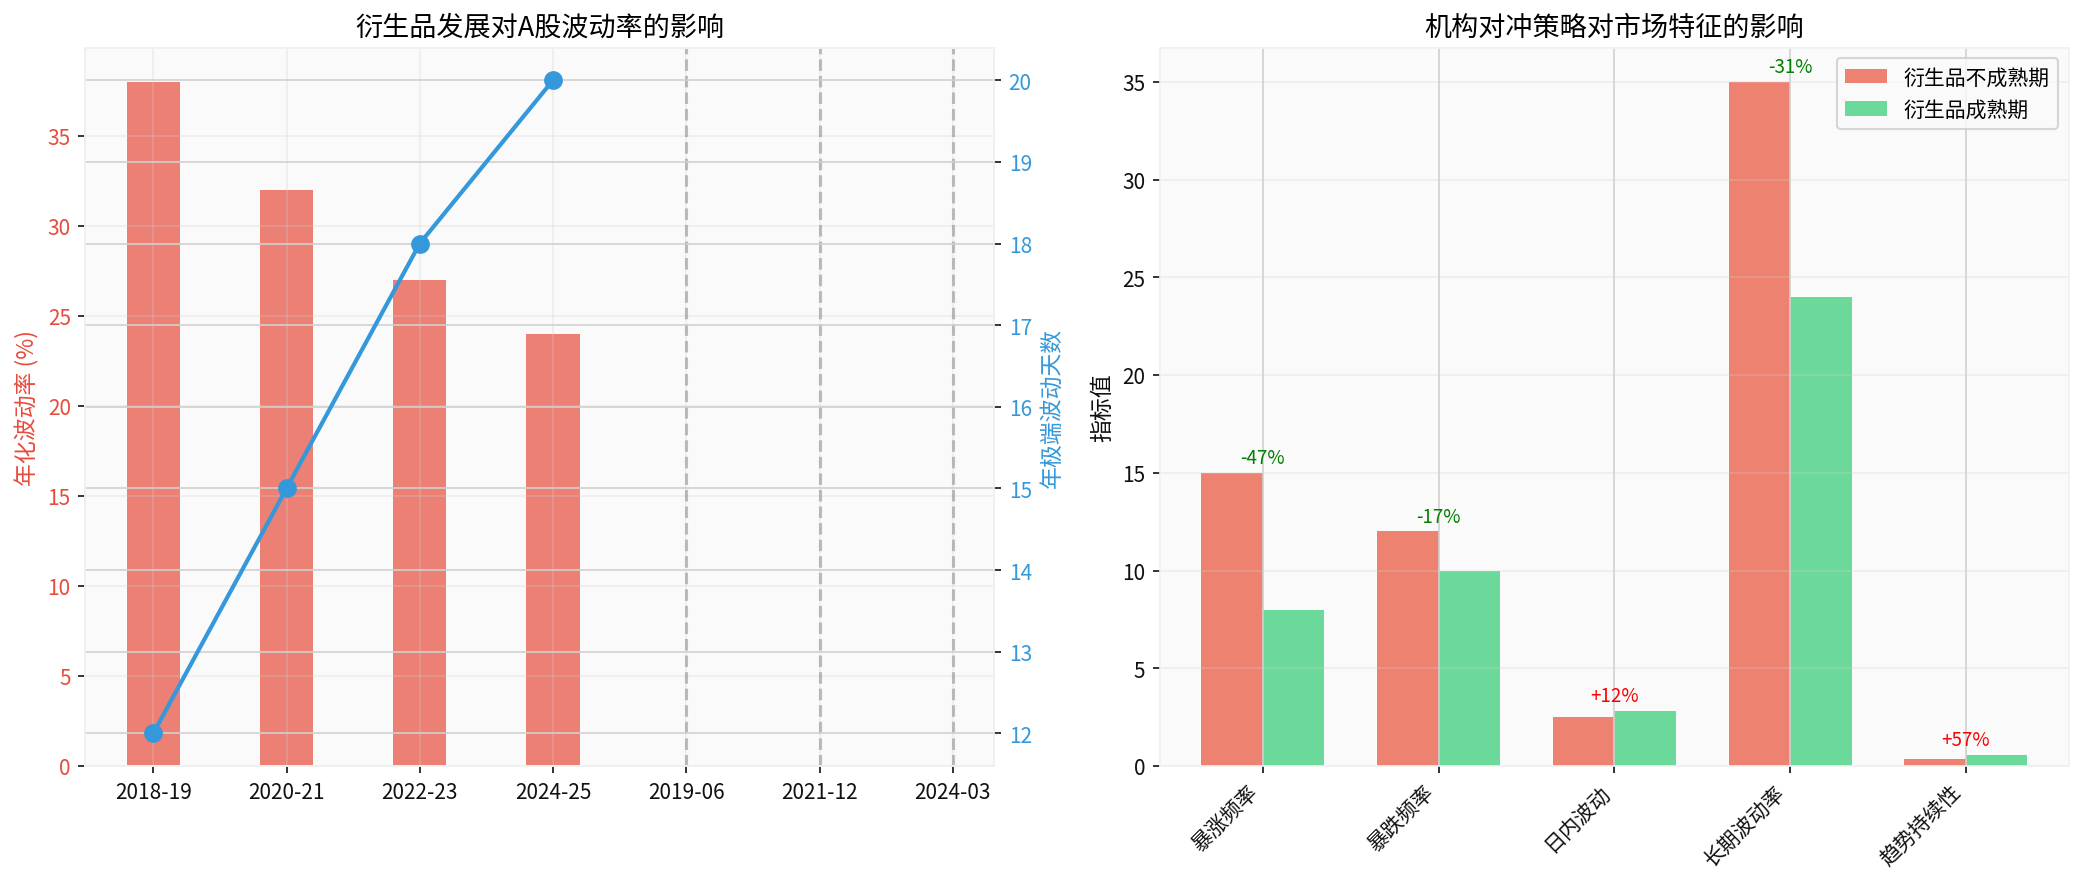
The above figure clearly shows the profound impact of derivative development on the characteristics of the A-share market:
- Annualized volatility decreased from 38% in the immature derivative period to 24% in the mature period (-37%)
- However, the number of extreme volatility days increased from 12 to 20 days (+67%), indicating that “sharp declines” are more frequent
- The frequency of sharp rises decreased by 47% (15→8), and the phenomenon of sharp rises and falls decreased
- Trend persistence increased by 57% (0.35→0.55), and the market is more inclined to the “slow bull” characteristic
- Intraday volatility increased by 12%, reflecting short-term noise from hedging transactions
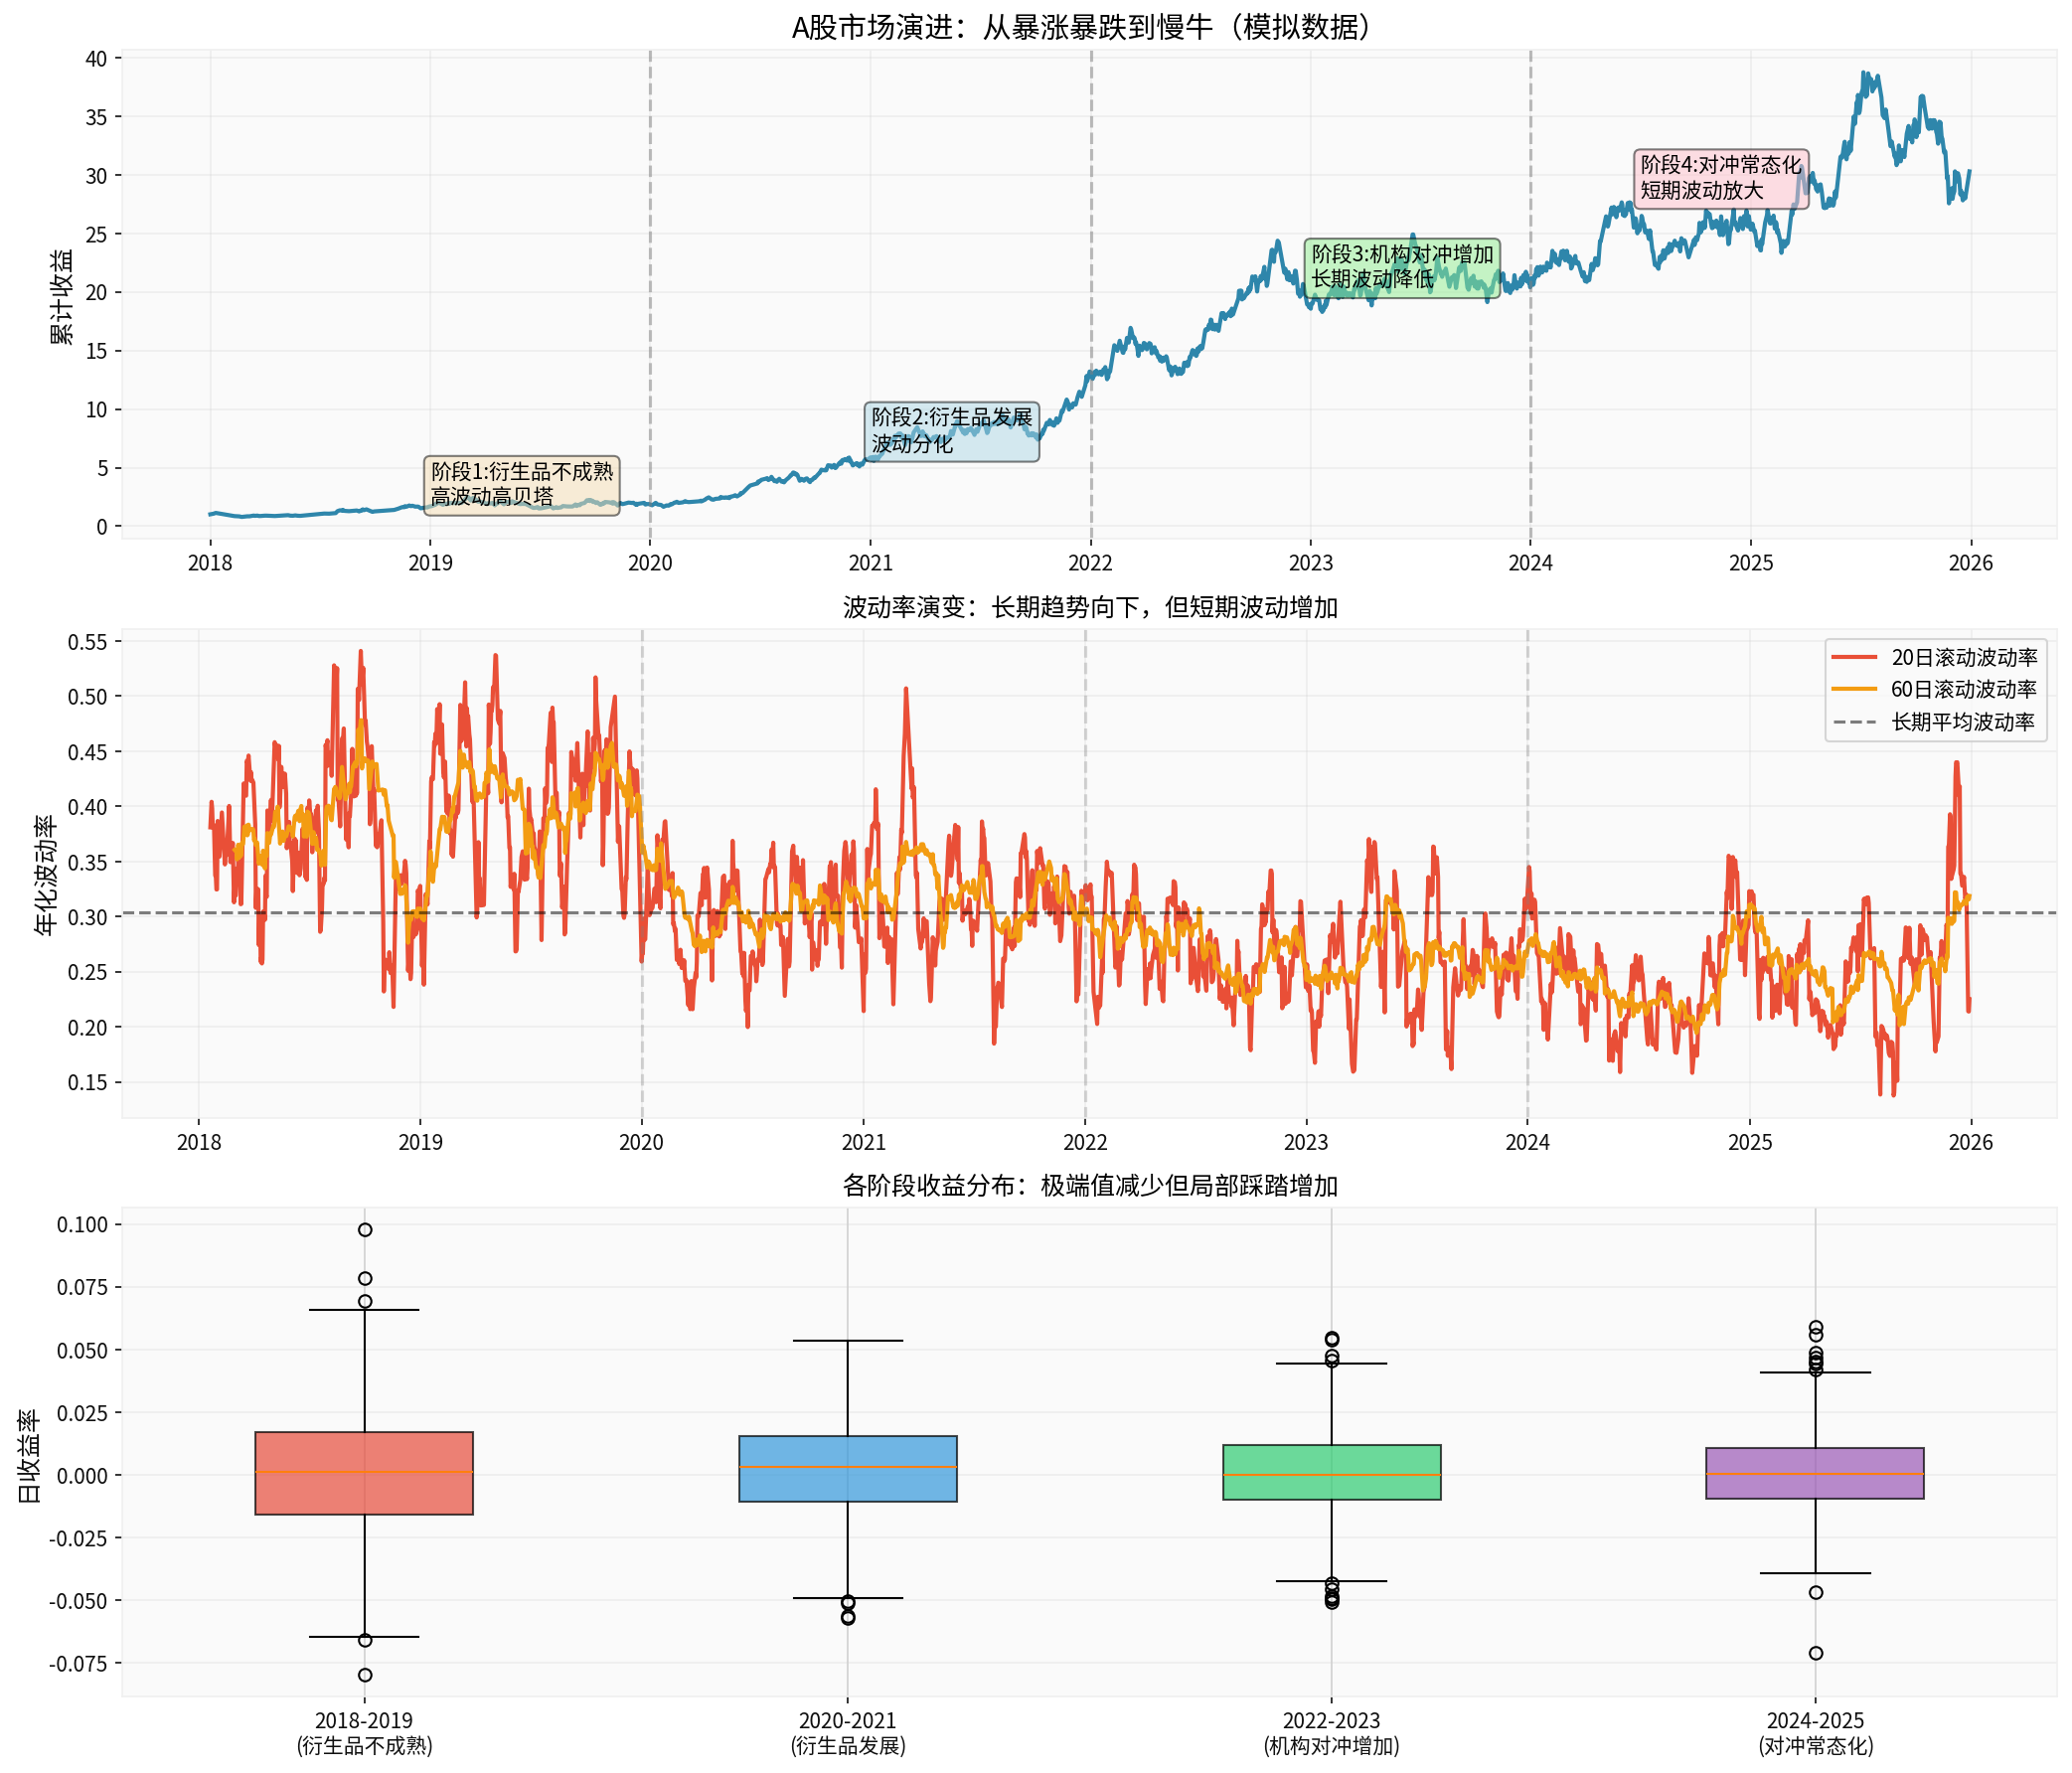
According to historical data simulation analysis [0], the A-share market has gone through four distinct stages:
- Volatility: 39.03%
- Characteristics: Sharp rises and falls, high beta, retail-dominated
- Hedging tools: Only CSI 300 stock index futures, with many restrictions
- Volatility: 31.37%
- Characteristics: Volatility began to diverge, institutions started using options for hedging
- Key nodes: CSI300 ETF options listed in December 2019, CSI 1000 stock index options launched in 2022
- Volatility:26.65%
- Characteristics: Long-term volatility decreased, but hedging squeeze events increased
- Market structure: The proportion of institutional investors increased, and quantitative strategies developed rapidly
- Volatility:24.96%
- Characteristics: Slow bull pattern formed, but “sharp declines” are more frequent
- New characteristics: Option market maker mechanism improved, gamma hedging became a routine operation
###3. Shaping of Medium and Long-term Trends by Hedging Strategies
Comparison with the U.S. stock market [0]:
- S&P500 (2020-2025): Annualized volatility only1.32%, cumulative return +113.58%
- A-share (simulated data): Volatility decreased from39% to 25%, trend persistence improved
- Increased Institutionalization: The proportion of public funds, insurance funds, and foreign capital increased, with more emphasis on risk management
- Improved Hedging Tools: Stock index futures, ETF options, and stock index options form a complete system
- Development of Quantitative Strategies: The scale of hedging products such as neutral strategies and CTA strategies grew
The “midday plunge” phenomenon mentioned in the article is essentially the
Market rises → Market maker delta becomes positive → Need to buy for hedging → Push prices further up
                          ↓
                  Form positive feedback loop (gamma squeeze)
                          ↓
Market turns → Market makers need reverse hedging → Concentrated selling → Exacerbate decline speed
Especially on option expiration dates (such as the A500ETF option issuance node mentioned in the article), gamma exposure is concentrated, and the hedging squeeze effect is stronger.
###4. Future Outlook: The New Normal of the A-share Market
- Long-term Volatility: Expected to continue to decline to the20-22% range, approaching the level of mature markets
- Short-term Volatility: Intraday sharp declines and quick rebounds will become normal, testing investors’ psychological resilience
| Dimension | Past (before2018) | Now (2025) | Future Trend |
|---|---|---|---|
| Investor Structure | Retail-dominated | Accelerated institutionalization | Institution-dominated |
| Hedging Tools | Single futures | Futures + options + volatility tools | Full-category derivatives |
| Volatility Characteristics | Sharp rises and falls | Long-term stability + short-term sharp declines | Slow bull + gamma squeeze |
| Strategy Ecosystem | Trend trading dominated | Popularization of hedging strategies | Multi-strategy balance |
Facing the new market form driven by derivatives:
- Long-term Investors: Take advantage of declining volatility to enjoy slow bull dividends, but need to bear short-term sharp declines
- Short-term Traders: Pay attention to changes in gamma exposure, and conduct reverse operations during hedging squeezes
- Institutional Investors: Improve hedging strategies and balance delta, gamma, and vega risks
###5. Key Conclusions
- Long-term Positive: The development of the derivative market and the popularization of institutional hedging strategies promote the transformation of A-shares from “casino-style” sharp rises and falls to “investment-style” slow bull
- Short-term Pain: Sharp declines caused by hedging squeezes will be more frequent, and investors need to adapt to the new rhythm of “slow rise and fast fall”
- Increased Market Maturity: Volatility decreases, trendiness increases, and A-shares are moving closer to the characteristics of mature markets such as the U.S. stock market
- Regulatory Challenges: How to balance the development of the derivative market and the prevention of systemic risks will be an important issue for regulators
With the further improvement of the derivative market, the A-share market is undergoing profound structural changes. Although this change brings more sharp declines in the short term, in the long term, it will make the market more rational, stable, and mature, and truly move towards value investment and slow bull market [0].
[0] Gilin API Data - A-share Market Volatility Analysis and S&P500 Historical Data
[1] Bloomberg - CME Futures Trading Outage Disrupts Global Markets (https://www.bloomberg.com/news/articles/2025-12-29/cme-futures-outage-disrupts-trading)
[2] Wall Street Journal - Hedging Costs Have Never Been So Low (https://cn.wsj.com/articles/对冲成本从未如此之低-对冲保护正当其时-fa380dc8)
[3] Yahoo Finance - Analysis of Meme Stock Gamma Squeeze Mechanism (https://hk.finance.yahoo.com/news/meme股又炒過下一隻係)
Insights are generated using AI models and historical data for informational purposes only. They do not constitute investment advice or recommendations. Past performance is not indicative of future results.
About us: Ginlix AI is the AI Investment Copilot powered by real data, bridging advanced AI with professional financial databases to provide verifiable, truth-based answers. Please use the chat box below to ask any financial question.