In-depth Analysis of Systemic Risks from the Market Dominance of U.S. Tech Giants
Unlock More Features
Login to access AI-powered analysis, deep research reports and more advanced features
About us: Ginlix AI is the AI Investment Copilot powered by real data, bridging advanced AI with professional financial databases to provide verifiable, truth-based answers. Please use the chat box below to ask any financial question.
Related Stocks
Based on the data and analysis I have collected, I will provide you with a comprehensive and in-depth analysis report.
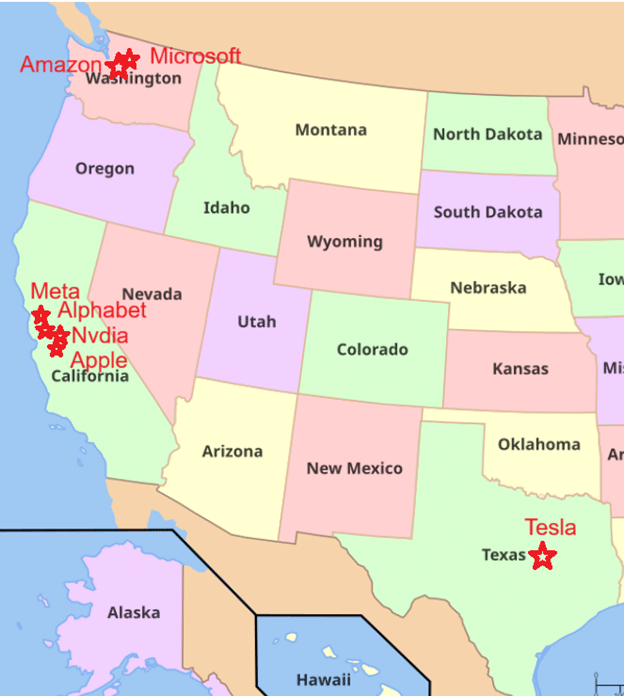
According to the latest data, the ‘Magnificent 7’ (Apple, Microsoft, NVIDIA, Google, Amazon, Meta, Tesla) has formed an unprecedented market dominance:
- Total market capitalization of the 7 companies reaches $21.78 trillion
- Accounts for 43.6%of the total market capitalization of the S&P 500 Index [0]
- This ratio far exceeds the level of less than 20% for the top 5 companies during the 2000 dot-com bubble [1]

Chart 1: Market Concentration and Valuation Analysis of the Magnificent 7
Between 2024-2025, the EPS growth of the S&P 500 is almost entirely contributed by tech giants:
- Magnificent 7: Contributed115%of EPS growth [0]
- Other 493 companies: Combined contribution is-15%[0]
This means that if tech giants are excluded, the overall earnings of the S&P500 are actually in
- Average P/E of Magnificent7: 65.96x
- Average P/E of S&P500: 21.5x
- Valuation premium magnitude: 206.8%
Among them, the valuations of individual companies are even more extreme:
- Tesla: P/E 250.10x
- NVIDIA: P/E 47.16x
- Apple: P/E 36.60x

Chart 2: Historical Trend of Tech Sector Concentration and Systemic Risk Indicators
- March 2000 (peak of dot-com bubble): Tech sector accounted for 29%of S&P500 [1]
- December 2025: Tech sector accounts for 35%of S&P500 [0]
- Current concentration has exceeded the dot-com bubble period, reaching a historical high
Market breadth indicators show that
- Q4 2024: Only 45%of stocks traded above their 200-day moving average [0]
- Q1 2023: 65%of stocks were above their 200-day moving average [0]
Although the S&P500 index rose in 2024,
- Extreme Multiples: Average P/E of 65.96x far exceeds historical average
- Growth Expectation Overdraft: Returns from AI investments have not yet been fully reflected in earnings
- Sentiment-Driven: Investor optimism about AI has formed a positive feedback loop
- Investors passively hold Mag7 exposure through index funds far beyond expectations
- If any leading company encounters problems, it will quickly spread to the entire market
- Passive investment strategies exacerbate concentration risk
- If Mag7 falls by 10%, even if the other 493 companies remain flat, the S&P500 will suffer significant losses
- This phenomenon of “concentration risk disguised as diversified investment” is extremely dangerous [1]
- The U.S. Department of Justice and Federal Trade Commission (FTC) are conducting antitrust investigations into multiple tech giants
- The EU’s Digital Markets Act (DMA) is implementing a strict regulatory framework
- China’s regulatory experience shows that tech giants may face sudden policy risks
- Capital expenditure of the eight major North American cloud service providers is expected to increase by about 40% annually in 2025, reaching $600 billion [3]
- However, the speed of commercial monetization of AI applications still has uncertainty
- Historical experience shows that major technological revolutions often go through the cycle of “expectation inflation - trough of disappointment - steady rise”
- High-valuation tech stocks are extremely sensitive to interest rates
- If inflation persists leading the Federal Reserve to maintain high interest rates, it will severely hit growth stock valuations
- The 2025 U.S. stock rally faces many potential threats, including high valuations and narrow leading sectors [4]
| Market | P/E Ratio | Valuation Attractiveness |
|---|---|---|
| S&P500 (Mag7) | 65.96 | 🔴 Extremely High Valuation |
| S&P500 (Equal Weight) | 21.5 | 🟡 Reasonable Valuation |
| Hang Seng Tech Index | 12.3 | 🟢 Significantly Undervalued |
| Europe (Stoxx600) | 14.5 | 🟢 Low Valuation |
| Japan (Nikkei Index) | 16.8 | 🟢 Reasonably Low |
| Emerging Markets | 13.2 | 🟢 Low Valuation |
- Current valuation is only 18.6%of U.S. tech giants [0]
- Regulatory environment has stabilized
- Chinese tech companies still maintain strong cash flow and profitability
- Continuous inflow of southbound funds and improved corporate performance support Hong Kong stock upside [4]
- DBS Bank: Hang Seng Index target of 30,000 points in 2026 (bull case 36,500 points) [4]
- CICC: Hang Seng Index target of 28,000-29,000 points in 2026 [4]
- Morgan Stanley: Baseline scenario 27,500 points (bull market 34,700 points) [4]
-
Core Satellite Strategy
- Core: Undervalued broad market indices (Hang Seng Tech, Europe, Japan)
- Satellite: Selected AI beneficiary targets, but control positions
-
Value Regression Strategy
- Increase exposure to value factors
- Focus on high-dividend, low-valuation stocks
- Reduce excessive exposure to growth factors
-
Geographical Diversification
- Reduce weight of U.S. market
- Increase allocation to Asia (excluding Japan) and Europe
- Consider opportunities in emerging markets
- Reduce exposure to U.S. tech giants
- Increase allocation to cash or cash equivalents
- Focus on high-dividend, defensive sectors
- Consider volatility hedging tools
- Hang Seng Tech Index: Huge room for valuation repair
- European Defense Industry: Benefiting from geopolitical tensions [5]
- Japanese Market: Benefiting from improved corporate governance and weak yen
- Emerging Markets: Significant relative valuation advantage
- AI infrastructure builders (not pure concept stocks)
- Energy transition-related industries
- Healthcare related to population aging
- Beneficiaries of supply chain diversification
The extreme dominance of U.S. tech giants
✅
- Market concentration reaches historical high
- Valuation extremely deviates from historical average
- Market breadth deteriorates significantly
- Earnings growth is extremely concentrated
⚠️
- Regulatory risk exists but is relatively controllable
- Whether Mag7’s earnings growth continues to exceed expectations
- Whether AI investment returns start to materialize
- Progress of antitrust regulation
- Impact of interest rate trends on growth stock valuations
- Whether market breadth improves
The
- Timing is crucial
- Need to build positions in batches to avoid one-time bets
- Maintain portfolio diversification and flexibility
- Focus on fundamental improvement rather than pure valuation repair
[0] Gilin API Data - Market Data, Valuation Indicators, Technical Analysis (December 29, 2025)
[1] Investopedia - “The Mag 7 in Charts: How Big Tech Dominates the Market” (https://www.investopedia.com/the-mag-7-in-charts-how-big-tech-dominates-the-market-11866473)
[2] Bloomberg - “Why Oaktree’s Howard Marks Is on the Watch for a Market Bubble” (https://www.bloomberg.com/news/articles/2025-01-27/why-oaktree-s-howard-marks-is-on-the-watch-for-a-market-bubble)
[3] Nomura Asset Management - “Outlook 2026: AI Still Shines, Taiwan Active ETFs Lead the Way!” (https://hk.finance.yahoo.com/news/展望2026-ai仍精彩-台股主動式etf帶勁-010332944.html)
[4] Yahoo Finance Hong Kong - “Review and Outlook: Hong Kong Stocks Expected to Rise First Then Fall in 2026, Recommend Focus on High-Dividend Stocks” (https://hk.finance.yahoo.com/news/回�%A��與展望-港股2026年料先升後回-建議關注高息股-054326744.html)
[5] Bloomberg Intelligence - “Returns-reflect-performance-through-April” European Defense Index Analysis (2024)
[6] Yahoo Finance - “US stock market concentration risks come to fore” (https://finance.yahoo.com/news/us-stock-market-concentration-risks-101509312.html)
[7] Investopedia - “There is a ‘bubble risk’ in the S&P 500, Deutsche Bank says” (https://finance.yahoo.com/news/bubble-risk-p-500-deutsche-112656744.html)
[8] Yahoo Finance Hong Kong - “U.S. Stock Rally Faces Unsmooth Road Ahead: List of Potential Risks in 2026” (https://hk.finance.yahoo.com/news/美股多頭前路不平-2026年潛在風險清單-覽-102740972.html)
Insights are generated using AI models and historical data for informational purposes only. They do not constitute investment advice or recommendations. Past performance is not indicative of future results.
About us: Ginlix AI is the AI Investment Copilot powered by real data, bridging advanced AI with professional financial databases to provide verifiable, truth-based answers. Please use the chat box below to ask any financial question.