Seres (601127) 2026 Performance Turnaround Feasibility In-Depth Analysis
Unlock More Features
Login to access AI-powered analysis, deep research reports and more advanced features
About us: Ginlix AI is the AI Investment Copilot powered by real data, bridging advanced AI with professional financial databases to provide verifiable, truth-based answers. Please use the chat box below to ask any financial question.
Related Stocks
- Current Stock Price: $120.36 (2025-12-29)
- Market Capitalization: $196.59B
- Year-to-Date Performance: -6.36%; Past 3 Months: -24.39%; 1 Year: -10.71%
- 52-Week Range: $112.14—$174.66 (≈-31.1% from the high, close to 52-week low support)
- P/E (TTM):27.23x
- P/B:7.07x
- ROE:32.11%
- Net Profit Margin:4.84%
- Current Ratio:0.91 (tight liquidity)
- Intrinsic values under conservative/benchmark/optimistic scenarios are all significantly higher than current price (probability-weighted≈$3,803, corresponding to≈+3060%), but this result highly depends on high growth and profit improvement assumptions, and includes historical data of negative EBITDA Margin—need to be cautious. This difference also implies the market remains观望 (wait-and-see) on the sustainability of high growth and profit path [0].

- Market Capitalization: Seres ($196.59B) significantly leads Xpeng ($19.74B) and Li Auto ($17.60B), forming a leading echelon with BYD ($112.58B)
- Valuation: Seres’ P/E (27.23x) is between Li Auto (16.15x) and BYD (62.50x); Xpeng is negative (loss)
- Growth: Seres’ 5-year revenue CAGR of78.5% leads the industry (comparison: Li Auto, BYD estimated at35% and42% respectively)
- Profitability: Seres’ ROE (32.11%) and net profit margin (4.84%) are at good levels; Xpeng’s net profit margin remains negative
- Annual Performance: Seres’ YTD -6.36% drop is significantly smaller than Li Auto and BYD, with stronger resilience
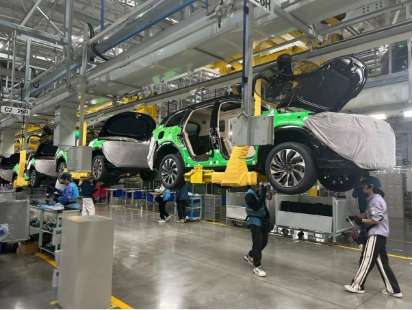
- In 2024, the volume growth of AITO M7 and M9 was reflected in the company’s high revenue growth and profit转正 (turning positive) with positive net profit margin [0].
- After the launch of AITO M8 in2025, it quickly gained volume (third-party reports show M8 entered the top model echelon with monthly sales exceeding 20,000 units a few months after launch [1]), indicating significant new product pull effect.
- The above facts show: The AITO series models with continuous iteration capability and channel synergy have verifiable driving force for sales and revenue.
- Uncertainties: Users mentioned models like “M6/M9L/M9 Premium”, but no exact launch time or official plan was retrieved in the tool results, so their contribution time and scale are uncertain.
###2) Overseas Expansion (Progress and Rhythm Need Tracking)
- Public reports show multiple Chinese car companies are promoting overseas factories (e.g., Indonesia, Mexico) to reduce logistics and tariff costs [2][3]. As of the tool result retrieval scope, no clear overseas factory production schedule or official capacity guidance for Seres/AITO was found.
- Opportunities: If overseas channels and localized production are implemented, it will help open the second growth curve in the medium and long term and diversify single market risks.
- Risks: Overseas regulations, channel construction, brand awareness, and supply chain localization are highly difficult, and the pace of capacity ramp-up may be lower than expected.
###3) Autonomous Driving Technology (Clear Route but Long Time)
- Huawei’s autonomous driving roadmap: Targets large-scale rollout of L3 in highway scenarios by2027 and launches urban L4 pilot at the same time [4]. Huawei’s ADS continues to upgrade, but the overall rollout pace is long.
- Implications for Seres: Medium and long-term technical support can improve product premium and repurchase, but the certainty of large-scale realization of profits in2026 is limited.
- Free Cash Flow: The tool shows the latest FCF is15.371 billion yuan, cash generation capacity improved significantly, but operating cash flow is still in the high investment stage [0].
- Debt Risk: Assessed as medium risk; current ratio 0.91, quick ratio0.87—short-term debt repayment and working capital turnover still need attention [0].
- Capital Allocation: Historical high capital expenditure and depreciation ratio reflect expansion investment, consistent with “high investment in new energy vehicle track”.
If the “2026650k sales/12.5B yuan net profit” mentioned by users becomes a reality, it usually requires the superposition of the following conditions:
- Continuous volume growth of AITO new products (including M8 and subsequent models) and maintenance of high ASP;
- Accelerated domestic channel sinking and overseas expansion, improved sales structure;
- Scale effect and supply chain optimization promote gross margin and expense ratio improvement;
- Autonomous driving and other value-added services improve software and brand premium, but the rhythm of full profit contribution in 2026 is uncertain;
- Industry competition pattern does not deteriorate significantly (price war, channel squeeze, policy and geopolitical risks are controllable).
- From the historical base of revenue and profit, new product cycle, and channel expansion, the 2026 sales and net profit have “certain possible upside space”, but the broker API does not provide direct verification and confidence interval for the 650k/12.5B yuan net profit target;
- Current P/E (27.23x) implies the market is relatively cautious about profit realization expectations; if profit realization exceeds expectations, there is room for valuation upward revision; if it is lower than expected, valuation digestion pressure still exists.
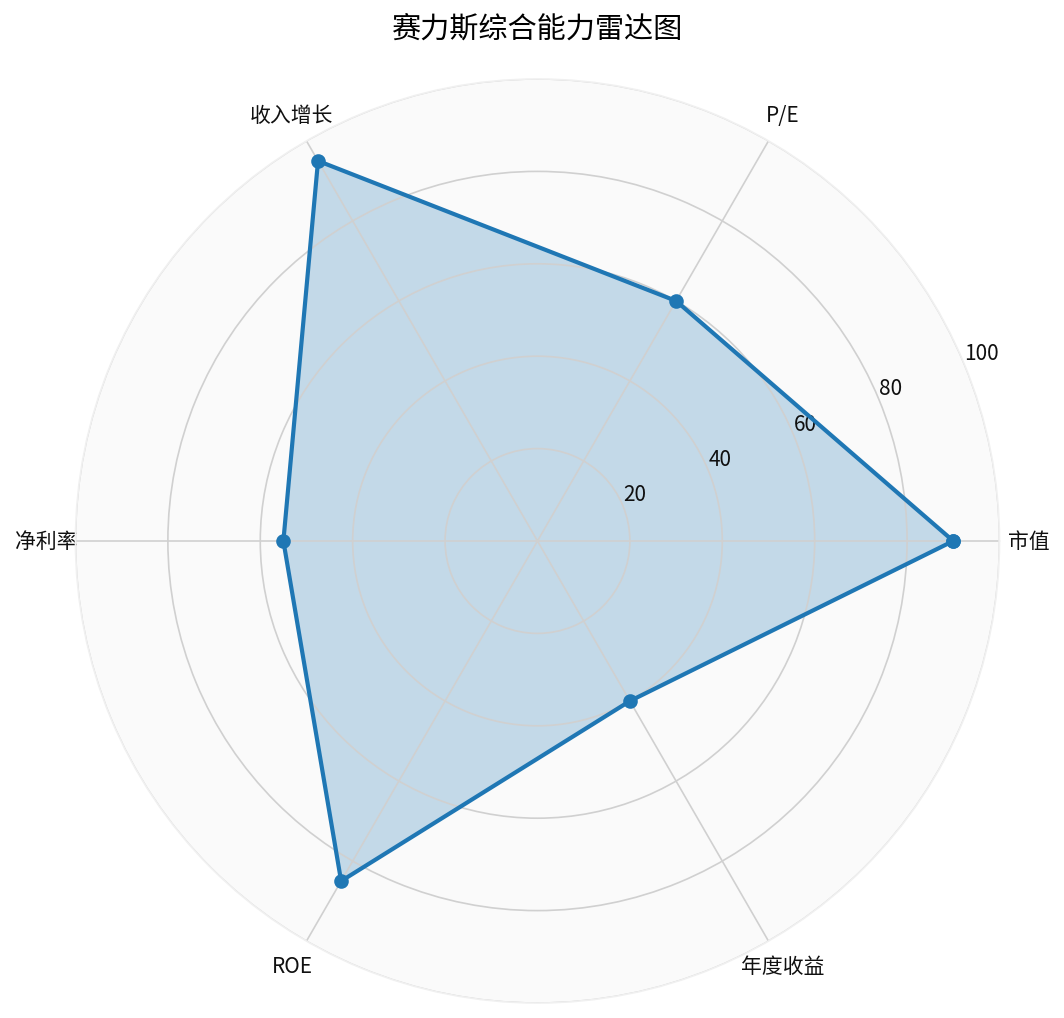
- Strengths: Revenue growth, ROE, market capitalization lead the industry;
- Neutral: P/E is in a reasonable range, net profit margin still has room for improvement;
- To Be Improved: Short-term stock price performance is weak, profit realization rhythm needs verification.
- The “possibility” of a turnaround exists, but it needs to be premised on continuous profit realization, continuous volume growth of new products, and implementation of overseas/technical layout;
- Current valuation has certain safety margin relative to its growth (revenue and profit improvement), but the market remains wait-and-see on the sustainability of high growth;
- The 2026 650k/12.5B yuan net profit is a relatively optimistic assumption, and subsequent official guidance and quarterly verification need to be tracked; currently, no tool results directly confirm this target, so it should be regarded as a “scenario assumption” rather than a confirmed target.
- Quarterly sales and gross margin/net profit margin trends;
- AITO new product rhythm and market feedback;
- Overseas factory and channel progress (if there is official disclosure or third-party verifiable data);
- Huawei ADS commercialization rhythm and policy/regulation progress;
- Industry policies, subsidies, and changes in competition pattern.
- If subsequent financial reports and sales continue to verify profitability improvement, there is room for valuation upward revision;
- If the 2026 target is not achieved or industry competition intensifies, current valuation has digestion pressure;
- It is recommended to take “profit verification + new product rhythm + overseas implementation” as key monitoring points and dynamically adjust positions and time windows.
- [0] Gilin API Data
- [1] CleanTechnica —53% EV Share in China! June2025 Sales Report (mentions AITO M8 entered the top model echelon with monthly sales exceeding20,000 units a few months after launch) https://cleantechnica.com/2025/07/21/53-ev-share-in-china-june-2025-sales-report/
- [2] Jakarta Globe —Indonesia Begins Construction of $5.9 Billion Mega EV Battery Hub (Indonesia battery and EV supply chain construction progress) https://jakartaglobe.id/business/indonesia-begins-construction-of-59-billion-mega-ev-battery-hub-with-chinas-catl-consortium
- [3] Automotive World —BYD confirms Indonesian factory on-track for2025 completion (overseas factory rhythm case) https://www.automotiveworld.com/articles/byd-confirms-indonesian-factory-on-track-for-2025-completion/
- [4] Automotive World —Huawei sets 2027 target for large-scale SAE Level3 rollout (Huawei autonomous driving roadmap) https://www.automotiveworld.com/articles/huawei-sets-2027-target-for-large-scale-sae-level-3-rollout/
Insights are generated using AI models and historical data for informational purposes only. They do not constitute investment advice or recommendations. Past performance is not indicative of future results.
About us: Ginlix AI is the AI Investment Copilot powered by real data, bridging advanced AI with professional financial databases to provide verifiable, truth-based answers. Please use the chat box below to ask any financial question.