2026 Container Shipping Industry Investment Value In-Depth Analysis: The Game Between Oversupply and Effective Capacity 'Black Hole'
Unlock More Features
Login to access AI-powered analysis, deep research reports and more advanced features
About us: Ginlix AI is the AI Investment Copilot powered by real data, bridging advanced AI with professional financial databases to provide verifiable, truth-based answers. Please use the chat box below to ask any financial question.
Related Stocks
Based on a comprehensive analysis of supply-demand patterns, geopolitics, and environmental regulations, I judge that
Current global container handheld order volume has reached
- 2025:Capacity supply growth of 6.0% (down from the early-year forecast)
- 2026:Capacity supply growth of 3.0%
- 2027:Capacity supply growth of 3.5%
- 2028:Large container ships (12,000-24,000 TEU) are expected to grow by 20% [1]
Orders are mainly concentrated in large ships of
- Severe oversupply of large ship capacity
- Possible shortage of small ships for regional routes
- Intensified structural differentiation of the fleet
Dock slots of major global shipyards have been scheduled until
- On one hand, high handheld orders indicate future supply pressure
- On the other hand, shipowners continue to place orders to seize market share, forming a ‘snowball effect’
Global container transport demand growth has dropped sharply from
- Supply chain regionalization:Trade flows shift from ‘Asia-Europe/Americas’ to diversified routes like ‘Asia-Asia’ and ‘Asia-Middle East’
- U.S. tariff policy:U.S. tariffs in 2025 led to a 2% drop in海运 imports in Q2, but Southeast Asia became the biggest beneficiary [8]
- Consumption downgrade and inventory adjustment:Weak growth in European and American consumer demand, slow inventory turnover
BIMCO predicts that the capacity demand growth rate will be
- Positive factors:Global economic soft landing expectations, rise of manufacturing in India and Southeast Asia
- Negative factors:Sustained U.S. tariff policy, sluggish European economy, geopolitical uncertainty
- Red Sea detour via the Cape of Good Hope absorbs about 7-9%of effective capacity [2]
- The originally expected 13%-14% capacity oversupply is compressed to 3.5%-4%[2]
- Giants like CMA CGM and Maersk have started试探性 resumption of the Suez Canal route [4]
| Scenario | Assumptions | Oversupply Rate | Impact on Freight Rates |
|---|---|---|---|
Base Scenario |
Gradual resumption in mid-2026, 50% resumption rate | 8%-10% | Drop by 20%-30% |
Optimistic Scenario |
Sustained geopolitical risks, detour throughout the year | 3%-5% | Sideways oscillation |
Pessimistic Scenario |
Full resumption in early 2026 | 14%-15% | Drop by40%-50% |
- Once the Red Sea resumes navigation, 6%-7%of detour capacity will return to the market instantly [4]
- Combined with new ship deliveries in 2027, the oversupply rate may soar to 20%[2]
- Short-term disturbances like port congestion and rising insurance costs [2][4]
###4.2 Environmental Regulation Constraints: ‘Mandatory Slowdown’ of CII/EEXI
- CII (Carbon Intensity Indicator):Forces old ships to slow down or exit the market
- EEXI (Existing Ship Energy Efficiency Index):Requires new ships after 2025 to meet stricter energy efficiency standards
- Ship slowdown can absorb 3%-5%of oversupply capacity
- If the speed decreases by 0.25 knots in 2026-2027 respectively, capacity supply will increase by an additional1.2% [1]
- It is expected that environmental regulations will lead to about 60% of ships exiting the compliance market by 2030[10]
- EU ETS (Emissions Trading System) will be fully implemented in2026, increasing operating costs
- Alternative fuel (methanol, ammonia, LNG) ships are expensive, but infrastructure lags behind [9]
###4.3 Aging Ship Scrapping: Slow Market Clearing
- BIMCO predicts scrapping of 750,000 TEUin2026-2027
- There is an expected 1.8 million TEUgap in pending scrapping capacity [1]
- Ship types below3,000 TEUwill dominate the scrapping market (accounting for 85% of ships over25 years old) [1]
- Large ships (12,000+ TEU) have insufficient scrapping motivation due to good economics
- Key Risk:If actual scrapping volume is lower than forecast, capacity oversupply will further intensify
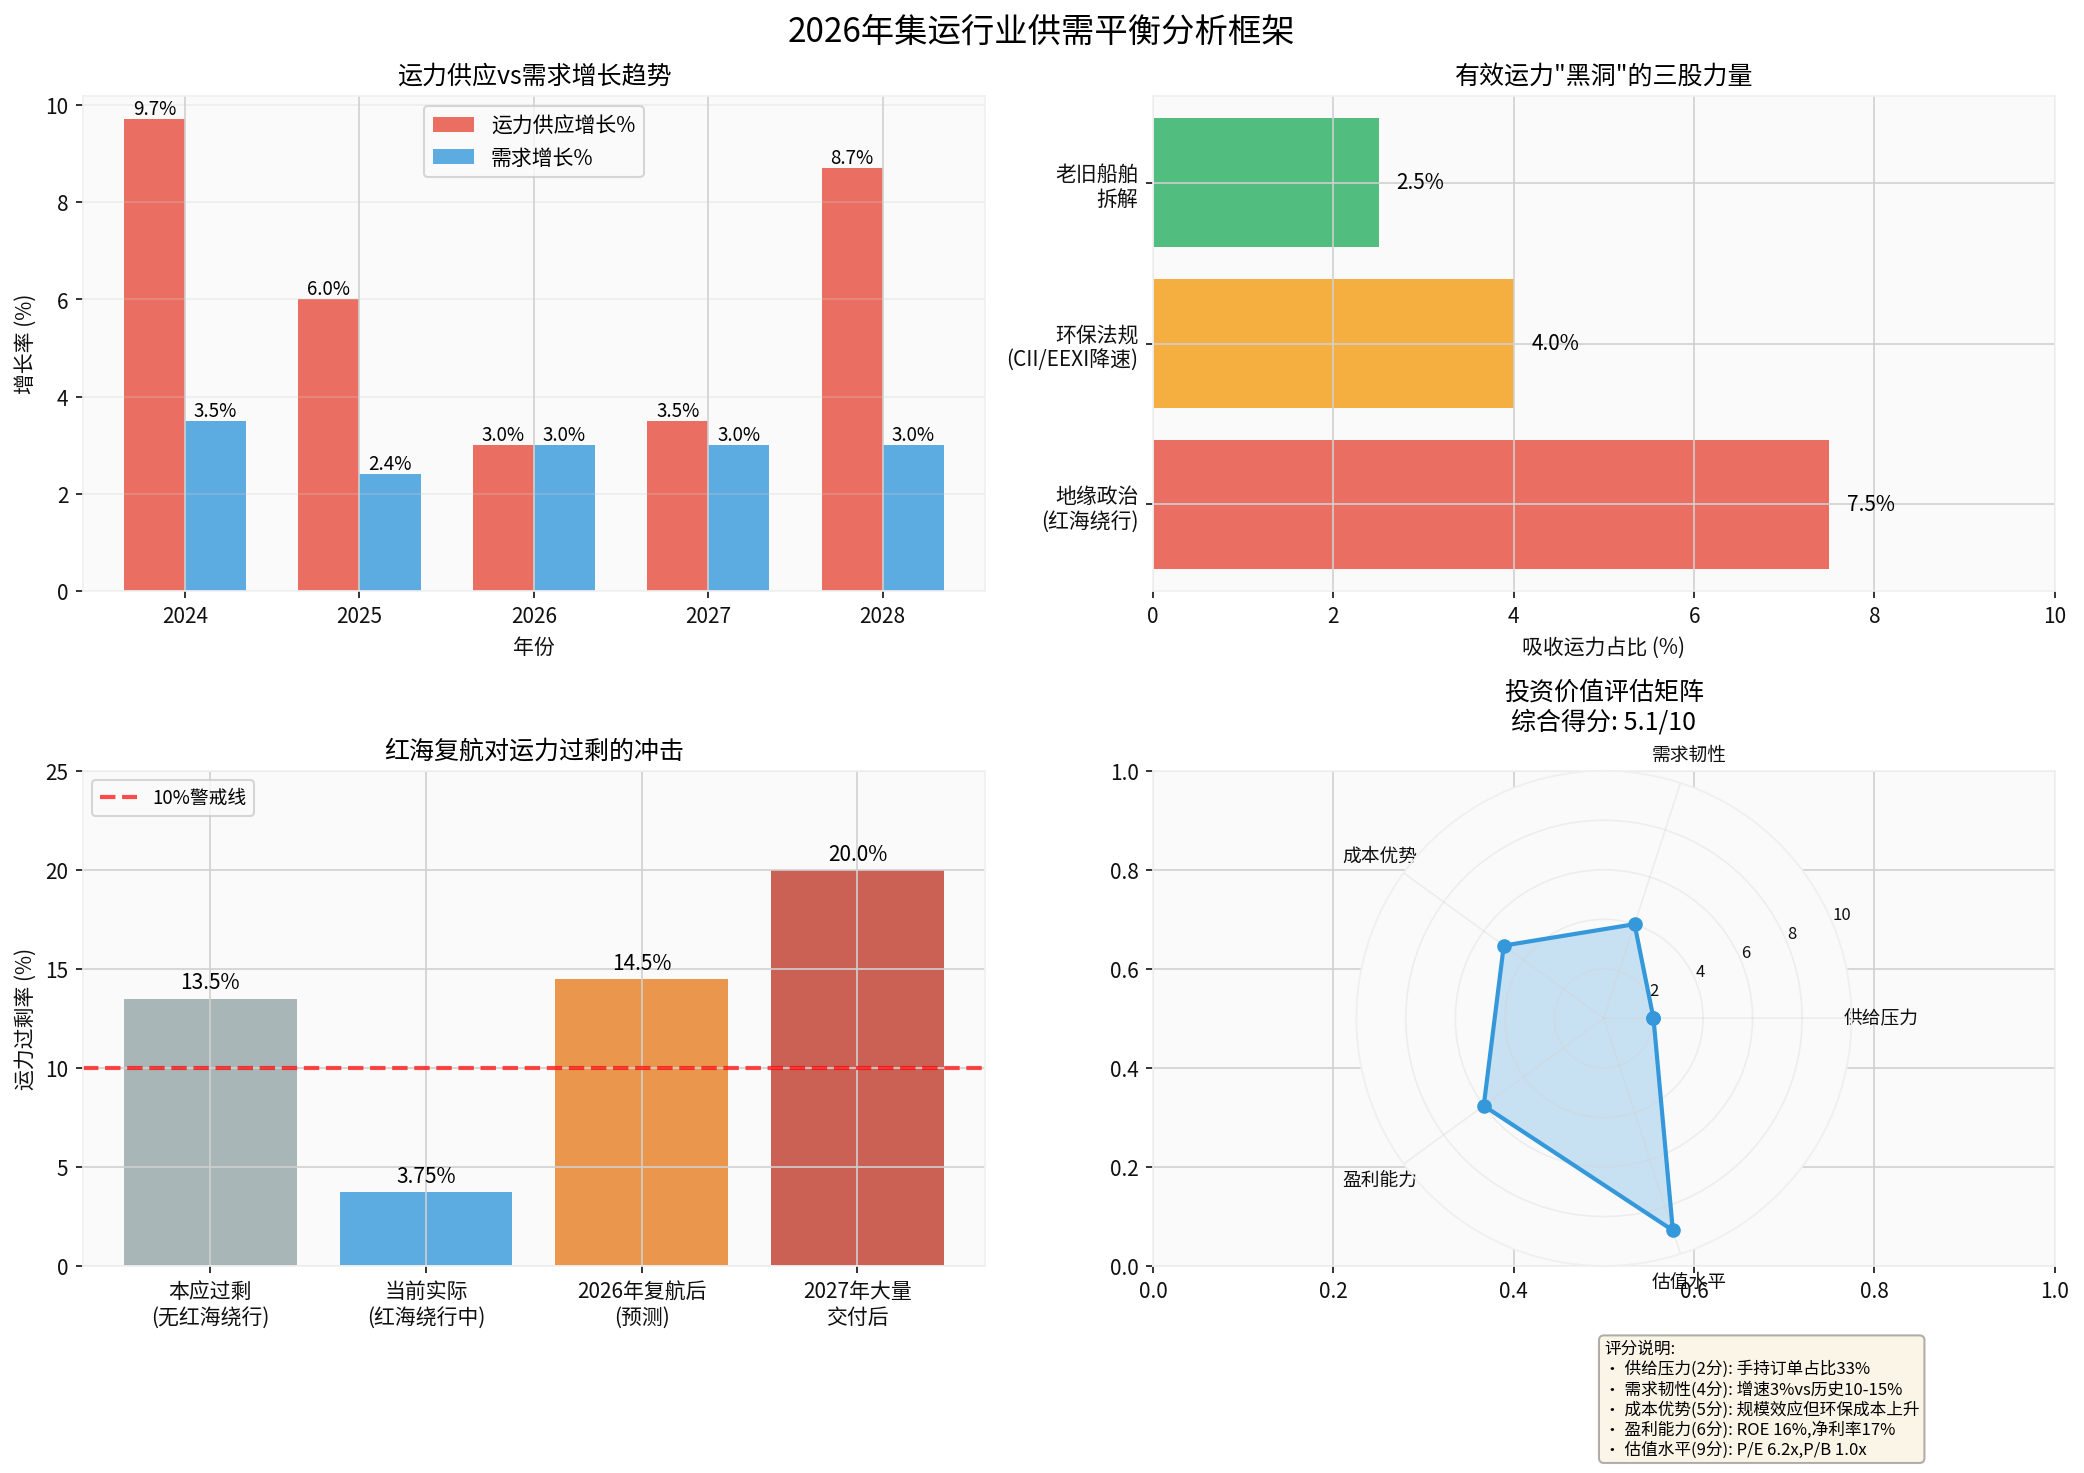
- Top-left chartshows the supply-demand gap narrows in 2026-2027 but widens again in2028 due to concentrated deliveries
- Top-right chartquantifies the absorption effect of the ‘three forces’ on effective capacity, totaling about14%
- Bottom-left chartshows the impact of Red Sea resumption on capacity oversupply, which may reach the 20% warning line in 2027
- Bottom-right chartis the investment value evaluation matrix, with valuation level (9 points) significantly higher than other dimensions
###5.1 Current Status of Freight Rate Indices (December2025)
| Index | Latest Value | Month-on-Month Change | Year-on-Year Change | Trend |
|---|---|---|---|---|
CCFI Composite Index |
1,146.67 | +2.0% | -24.3% | Four consecutive rises [8] |
SCFI Composite Index |
1,656.32 | +6.7% | -32.7% | Rebound after two consecutive drops [8] |
European Route |
1,519.06 | +3.1% | -33.2% | Price support during contract season [8] |
West US Route |
788.12 | -0.5% | -20.9% | Weak demand [8] |
###5.2 2026 Freight Rate Forecast
Based on the supply-demand balance model, I predict that freight rates in2026 will show a
- Q1-Q2:Relatively firm freight rates (Red Sea detour not fully recovered)
- Q3-Q4:Freight rates under pressure to decline (new ship deliveries + resumption impact)
- Full-year average:Drop by20%-30%compared to2025
###5.3 Industry Profitability Differentiation
- Can still maintain 10%-15%net profit margin relying on scale effect and long-term contract cargo ratio
- Abundant cash flow to survive the cycle trough
- Face cash flow断裂 risk
- May be merged or exit the market
###6.1 Valuation Analysis (December29,2025)
| Indicator | Hong Kong Stock (1919.HK) | A-Shares (601919.SS) | Evaluation |
|---|---|---|---|
Stock Price |
13.91 HKD | 15.21 CNY | - |
P/E (TTM) |
6.19x | 4.83x | Historical low |
P/B |
1.01x | - | Near net-breaking edge |
ROE |
16.14% | - | High quality |
Net Profit Margin |
16.78% | - | Strong profitability |
Dividend Yield |
~6% | - | High dividend |
Current valuation has fully reflected pessimistic expectations,
###6.2 Financial Health Analysis
According to financial analysis tool data [0]:
- Cash Flow:2024 free cash flow reached 43.3 billion USD, showing significant cash cow characteristics
- Debt Risk:Low risk category, sound balance sheet
- Financial Attitude:Neutral, conservative and moderate accounting policies
###6.3 Competitive Advantages
- Scale Advantage:One of the world’s largest container fleets, unit cost lower than industry average
- Network Advantage:Perfect layout of ports, logistics, end-to-end services
- Capital Advantage:Abundant cash flow to resist industry troughs and acquire high-quality assets
- Central Enterprise Background:High strategic importance and strong policy support
###6.4 Key Risk Factors
- Red Sea resumption may lead to 6%-7% of detour capacity return [2][4]
- If fully resumed in early2026, freight rates may drop by 40%-50%
- EU ETS, CII/EEXI push up operating costs [9][10]
- Huge investment in green ships with long return cycle
- Linerlytica predicts that ‘the real price war may have just begun’ [3]
- Giants seize market share, small and medium carriers face survival crisis
- Sustained U.S. tariff policy, sluggish European economy
- AI bubble burst may lead to global economic chain reaction [1]
###7.1 Allocation Advice: Moderate Underweight, Wait for Inflection Point
- Current (End of2025):Can establish a10% observation position with sufficient valuation safety margin
- Q12026:If the Red Sea crisis continues, can increase position to 20%
- Q2-Q32026:Closely monitor Red Sea resumption progress; if full resumption signals appear, reduce position timely
- 2027:Wait for the peak of capacity delivery to pass, look for medium-to-long-term buying points
###7.2 Target Selection
- Reasons: Lowest valuation, strongest cash flow, central enterprise background, high dividend
- Reasons: Global network layout, leading in environmental transformation
- Reasons: High price war risk, fragile capital chain
###7.3 Exit Strategy
- Red Sea crisis continues to ferment, freight rates rise beyond expectations
- Industry integration accelerates, leading share increases
- Full resumption of Red Sea navigation, freight rates drop by over30% in a single month
- Global trade falls into recession, cargo volume negative growth for two consecutive quarters
###8.1 Accelerated Industry Clearing and Integration
The next three years will be the most important structural inflection point in the past two decades [3]:
- The strong get stronger:Leading enterprises control larger market share through scale, network, and capital advantages
- Survival of the fittest:Small and medium carriers are forced to exit or be merged
- Alliance restructuring:Existing 2M, Ocean Alliance, THE Alliance may disintegrate and restructure
###8.2 Green Transformation Becomes New Moat
- Green premium:Methanol and ammonia fuel ships can charge higher freight rates
- Compliance cost:Old ships that fail to meet standards are forced to scrap or slow down
- Technical barrier:Enterprises with green fleets will gain long-term competitive advantages
###8.3 Supply Chain Diversification Brings New Opportunities
- Regional trade:Demand growth for regional routes like intra-Asia and Middle East-Africa
- Multimodal transport:Alternative solutions like China-Europe Railway Express and Arctic Route divert part of capacity [6]
- End-to-end services:Integrated logistics, port, and warehousing services become differentiated competitive advantages
###9.1 Key Observation Indicators (2026)
- CCFI/SCFI freight rate index trend
- Number of ships passing through the Red Sea (current 120 ships/month vs 583 ships/month before crisis) [4]
- New ship delivery progress
- Aging ship scrapping volume
- Global container capacity supply-demand gap
- Load factor of major liner companies
- Industry concentration change
###9.2 Three Major Uncertainties
- Geopolitics:When will the Red Sea crisis end? Will new waterway conflicts occur?
- Environmental policy:How strong is the implementation of IMO greenhouse gas emission reduction strategy? Will carbon costs exceed expectations?
- Global economy:Will the U.S. economy soft land? Will the AI bubble burst?
###10.1 Core View Reiteration
In 2026, the container shipping industry will face triple pressures of
- Valuation has fully reflected pessimistic expectations, with leading companies like COSCO Shipping Holdings having P/E only 4-6x
- Effective capacity ‘black hole’ still exists, with Red Sea detour, environmental regulations, and scrapping absorbing about14% of capacity
- Industry concentration increases, leading enterprises are expected to survive the cycle
###10.2 Investment Value Rating
- Short-term (6 months):Neutral to bearish, wait-and-see为主
- Medium-term (1-2 years):Cautious to bullish, layout leading enterprises at low prices
- Long-term (3-5 years):Recommend, industry clearing leads to optimized structure
###10.3 Final Advice for Investors
The container shipping industry is a
- Control position:Do not exceed 10% of the portfolio
- Long-term perspective:Hold for 3-5 years to survive the complete cycle
- Dynamic adjustment:Closely track key indicators like Red Sea resumption, freight rate trend, new ship delivery
- Choose leading enterprises:Central enterprises like COSCO Shipping Holdings have the strongest risk resistance ability
In the
[0] Jinling API Data - COSCO Shipping Holdings (1919.HK/601919.SS) real-time quotes, company overview, financial analysis, historical price data
[1] China Shipping Weekly - “When Will Ships Return to the Suez Canal to Dominate Future Expectations of the Container Shipping Market” (December26,2025)
https://news.csi.com.cn/bc9f4dd5-c9a3-4012-b9c1-f1534930e489.html
[2] NetEase News - “Red Sea Resumption Has Become a Reality, May Change the Container Shipping Market Structure” (December22,2025)
https://www.163.com/dy/article/KHSTR4160514C1PI.html
[3] NetEase/ Xinde Maritime - “Knowing Capacity Oversupply, Why Are Major Container Shipping Companies Still Crazy About Building Ships?” (December22,2025)
https://www.163.com/dy/article/KHDCHDNB0514C1PI.html
[4] Sina Finance - “Red Sea Resumption Cautiously” (December22,2025)
https://finance.sina.com.cn/jjxw/2025-12-22/doc-inhcsvvh1470253.shtml
[5] Sohu Finance - “Everyone Is Snatching Ship Slots: Global New Shipbuilding Market Rebounds Comprehensively in the Second Half of2025”
https://www.sohu.com/a/969696810_175033
[6] 36Kr - “Farewell to Malacca, China-Europe + Arctic Route: How to Help China Break Through Maritime Hegemony?”
https://m.36kr.com/p/3579492228971400
[7] Shanghai Shipping Exchange - C
Insights are generated using AI models and historical data for informational purposes only. They do not constitute investment advice or recommendations. Past performance is not indicative of future results.
About us: Ginlix AI is the AI Investment Copilot powered by real data, bridging advanced AI with professional financial databases to provide verifiable, truth-based answers. Please use the chat box below to ask any financial question.