Comparison of Valuation Risks Between US and Hong Kong Stocks and Investment Strategy Recommendations
Unlock More Features
Login to access AI-powered analysis, deep research reports and more advanced features
About us: Ginlix AI is the AI Investment Copilot powered by real data, bridging advanced AI with professional financial databases to provide verifiable, truth-based answers. Please use the chat box below to ask any financial question.
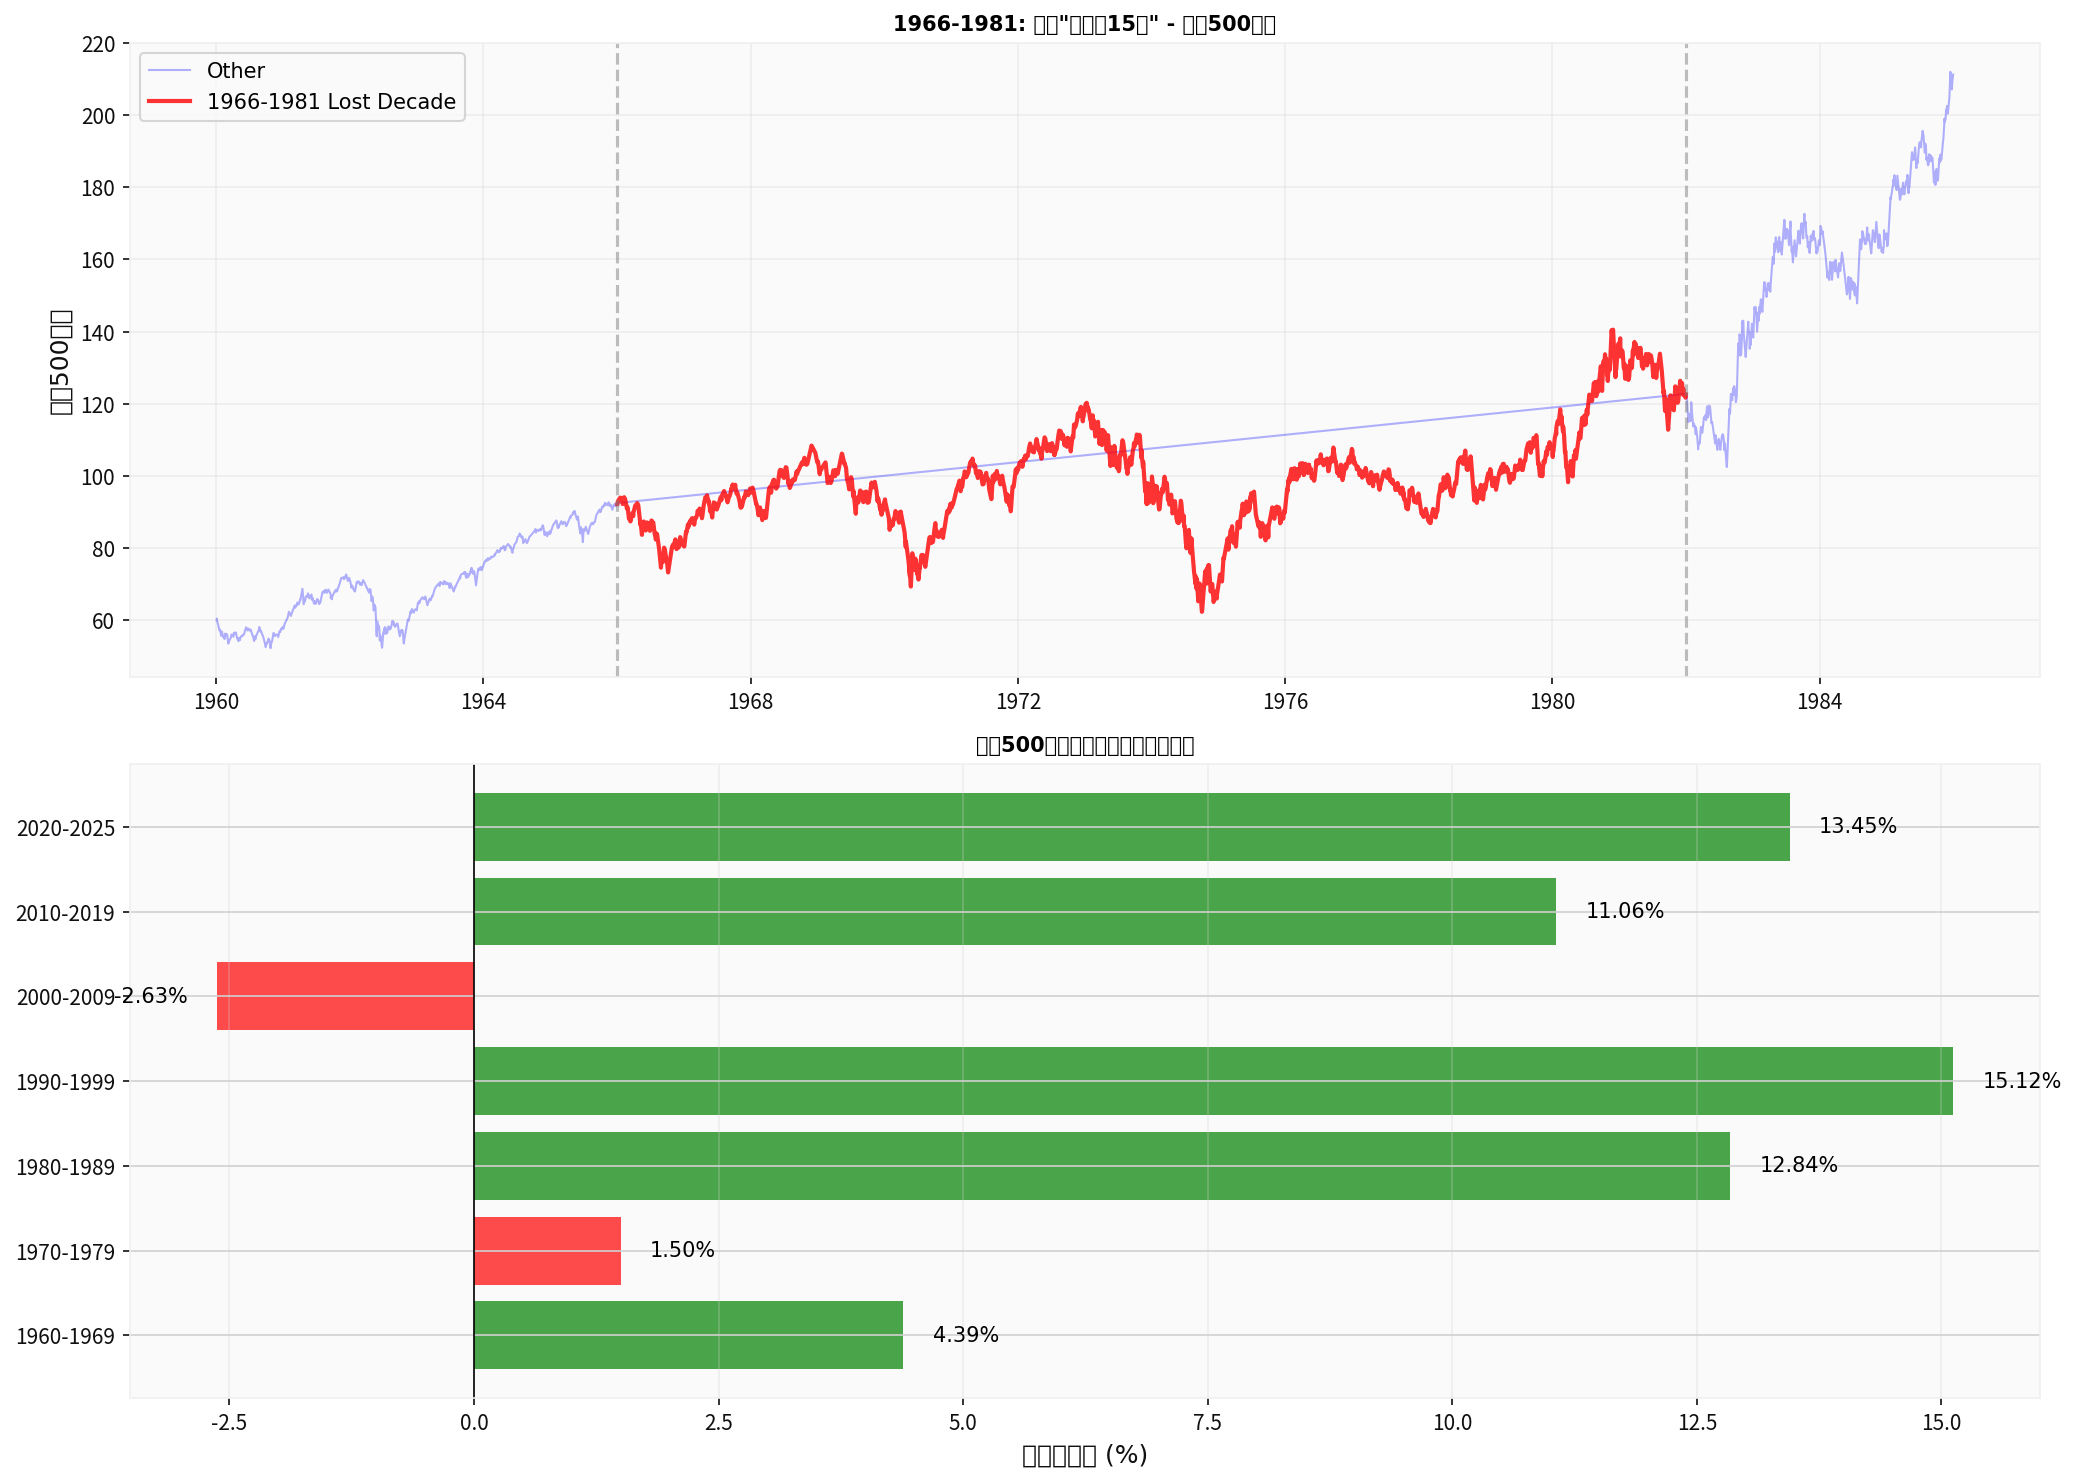
- From 1966-1981, the S&P 500 rose only 32.95% with an annualized return of less than 2%, and a maximum drawdown of 55.7% during the period, highlighting the “sideways movement + significant drawdown” pattern when high valuations, inflation, and geopolitical turmoil coexist [0]. This “lost 15 years” reminds us: the long-term return compression caused by high valuations may be prolonged by external shocks (such as energy crises, geopolitical tensions, and monetary system transitions), so investors must dynamically balance the three main lines of valuation, politics, and inflation [0].
- Similar risks are repeating in current US stocks: the Shiller CAPE has risen to 40.74, a stone’s throw away from the 1999 peak, and every time CAPE exceeds 30x, it is followed by a major adjustment of at least 20%-89% [1]. Although new factors like technological progress and more完善 Fed tools exist, history has never spared the risks released by high valuations [0].
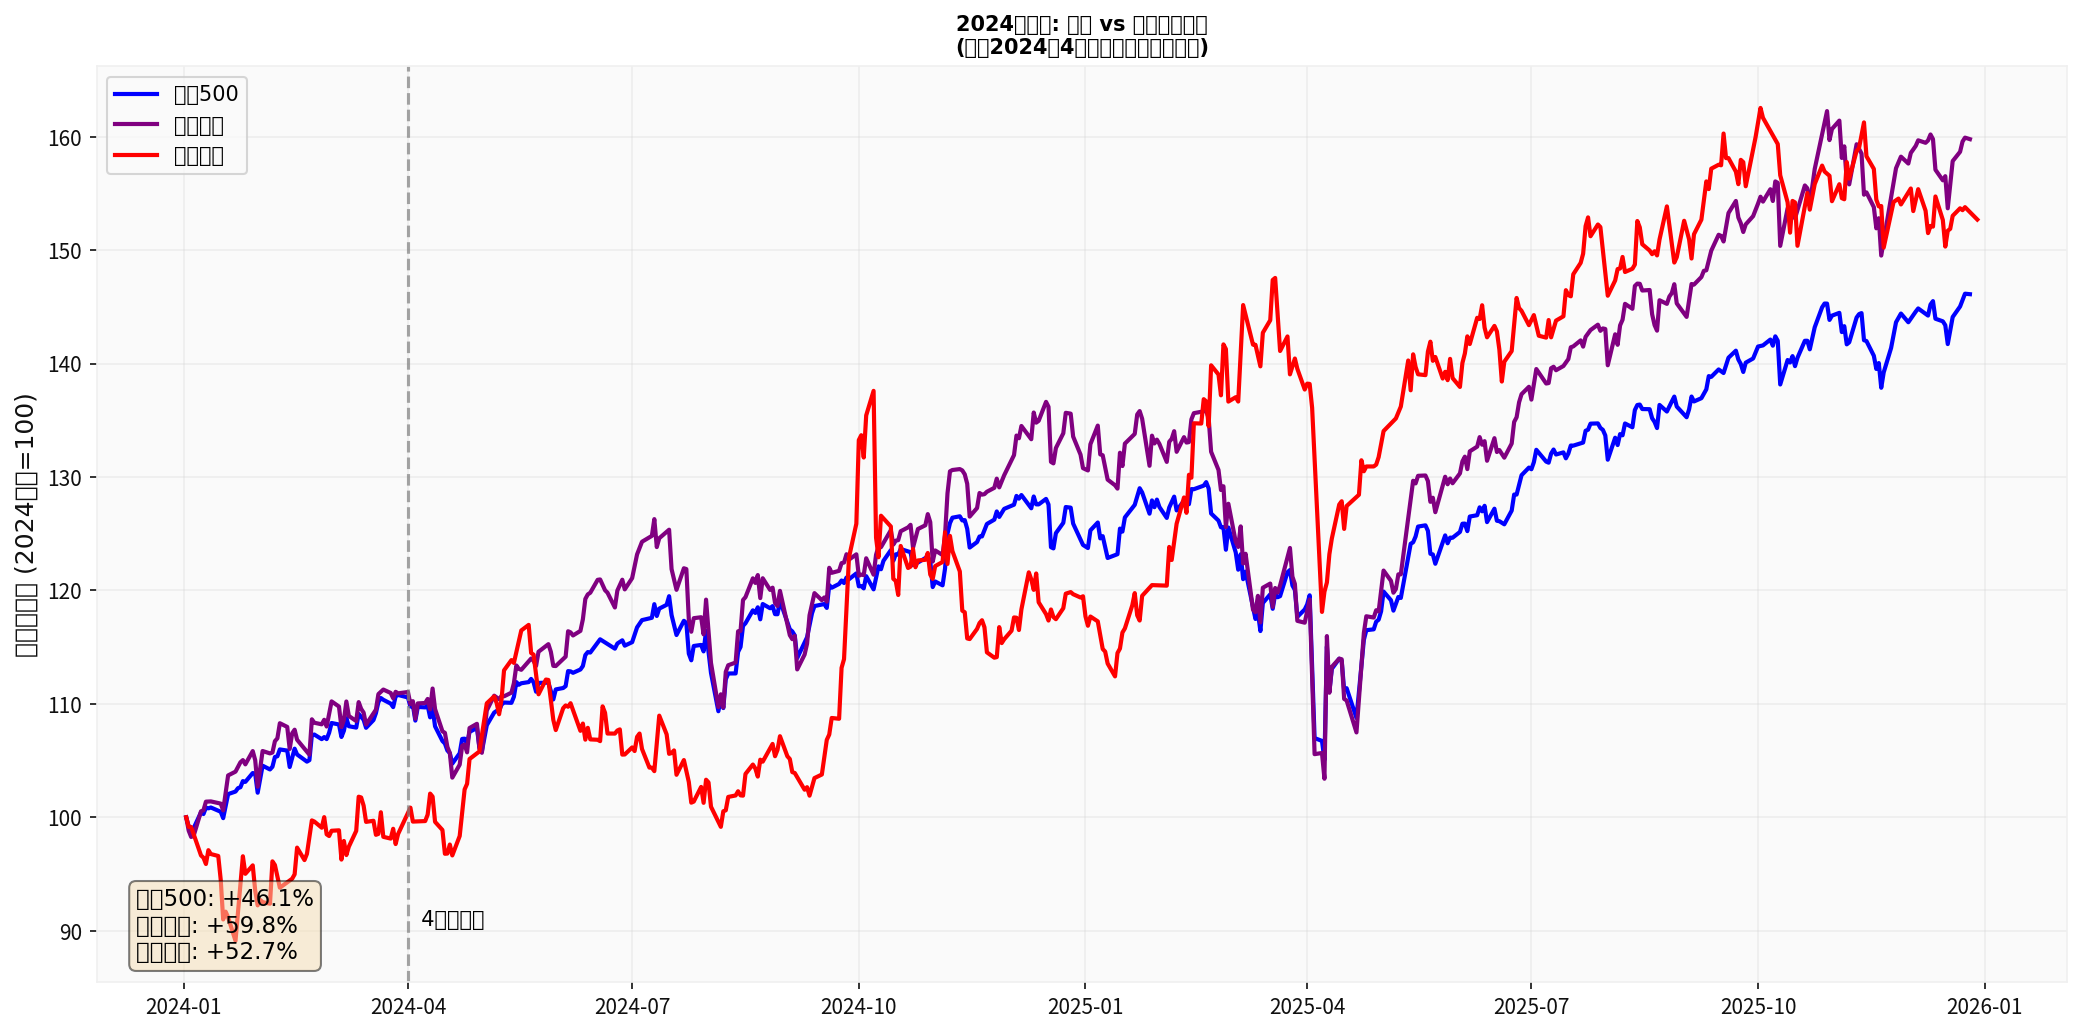
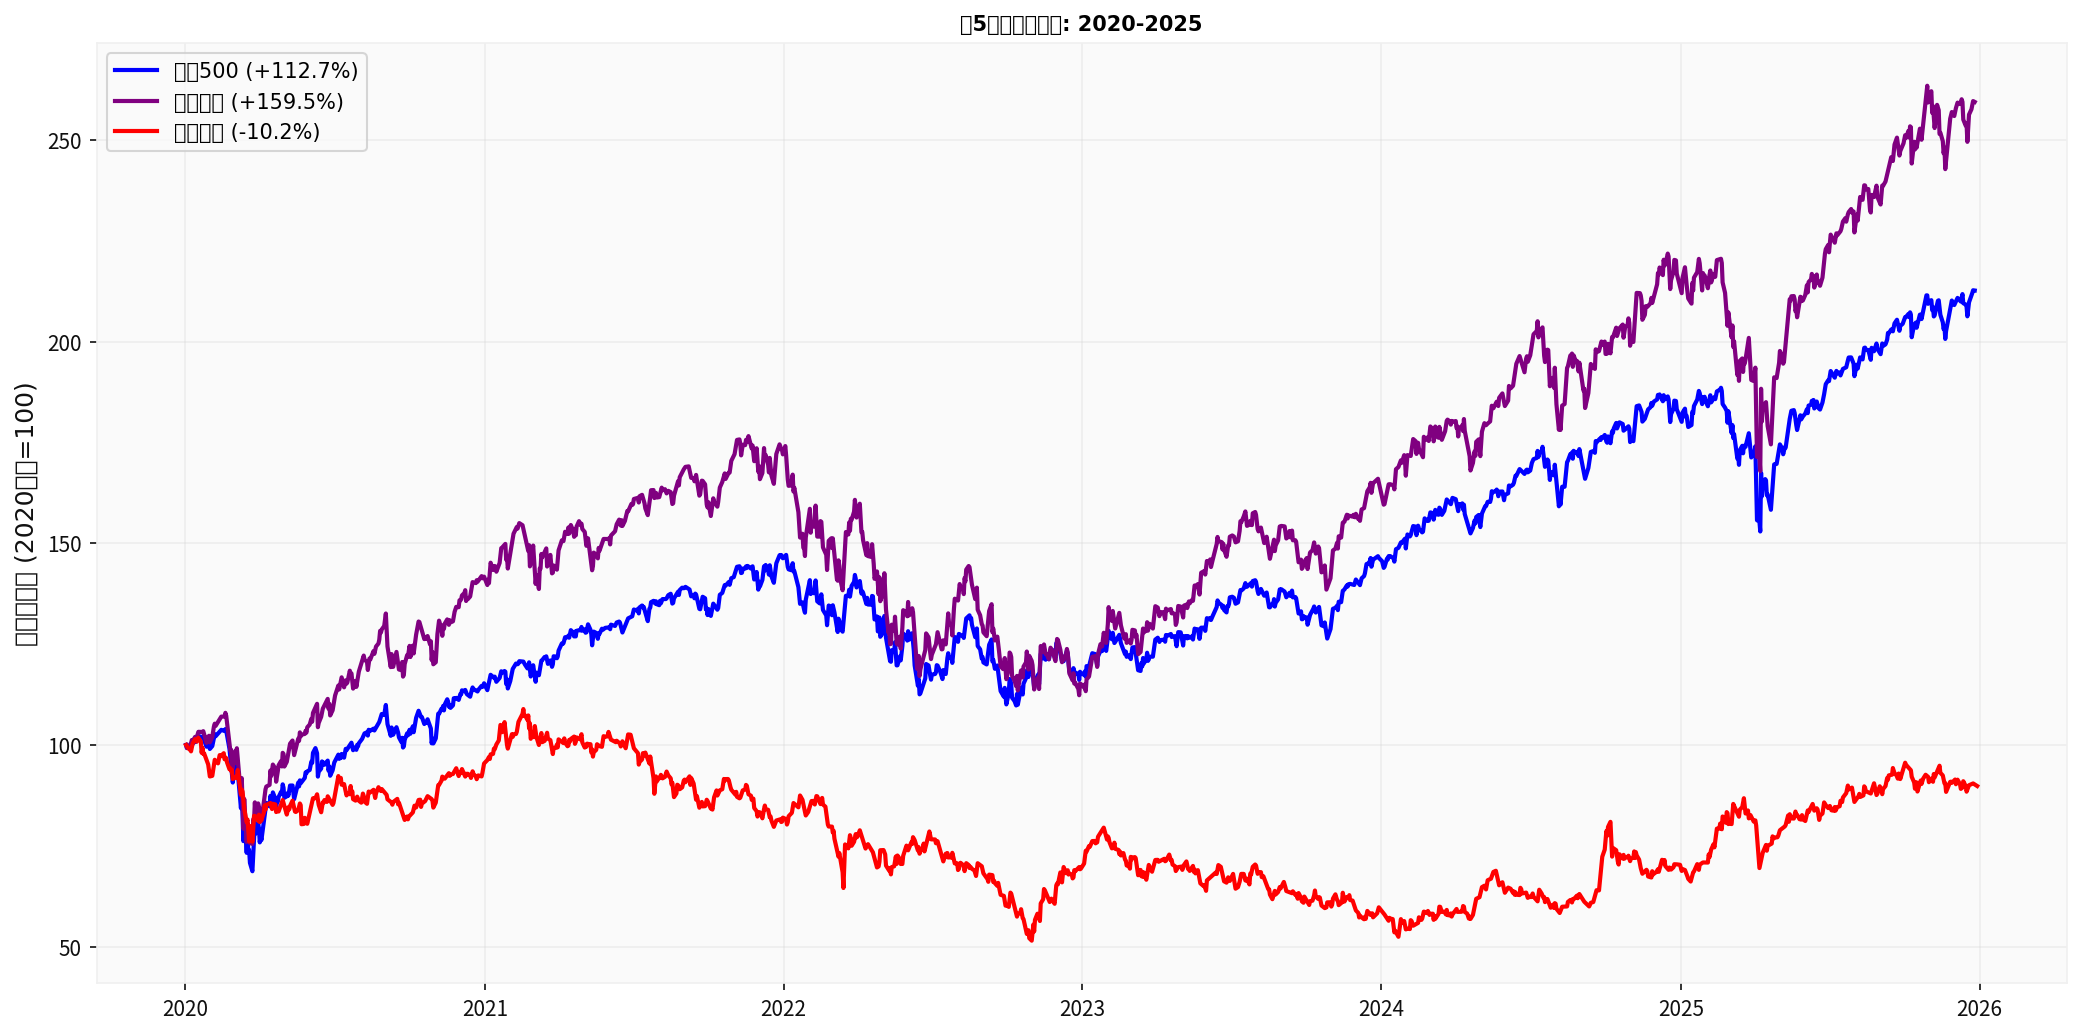
- From April 2024 to now, the Nasdaq has risen 43.9% and the Hang Seng Index has risen 51.4%, with Hong Kong stocks slightly stronger in short-term performance; but the cumulative return gap over the past 5 years is huge: Nasdaq +159.5%, Hang Seng -10.2%, indicating that Hong Kong stocks’ “valuation rebound” comes more from a low base than long-term growth [0].
- From the volatility perspective, the annualized volatility of US stocks is about 16% and that of Hong Kong stocks is about 24.5%; the Sharpe ratios for the same period are 2.49 vs 1.94, indicating that US stocks bear lower unit risk while enjoying excess returns [0].
- The Nasdaq has a high broad-based valuation (PE≈34.4x; tech weight 36%) and lacks an obvious risk discount; in contrast, the Hang Seng Tech dynamic PE≈25x, with a historical percentile of only 40%, still having room for valuation repair [0][2]. Therefore, from the perspective of short-term risk/reward, switching to the lower-valued Hong Kong tech sector is logically valid—provided that the sector can still deliver profits and policy support.
- The Hong Kong tech sector has a complete Chinese AI industry chain (infrastructure, chips, computing power, applications) and benefits from dual catalysis of policy and capital; while Hang Seng Tech’s valuation is still in the middle-low range, capital misalignment and foreign capital allocation gaps provide potential room for premium expansion [2].
- The key investment logic is: against the backdrop of narrowing global capital interest rate spreads and loosening US dollar hegemony, Hong Kong tech provides a valuation safety margin; but it must also be意识到 that Hong Kong stocks have higher liquidity, regulatory, exchange rate (HKD pegged to USD but RMB fluctuates) and volatility risks than US stocks [0], so tactical position adjustments should be made in a non-leveraged way with hedging.
- The current US political situation and de-dollarization trend are eroding the quasi-dominant position of the USD: geopolitical conflicts, sanction toolization, and major country hedging have led most countries to reshape settlement systems and foreign reserve portfolios, with the USD’s share in global reserves declining (about 56.3% in Q2 2025), raising investors’ doubts about the “credit premium” of USD assets [3].
- In this macro structure, expanding allocation to non-US assets like Hong Kong stocks can reduce single-point exposure to US policy shocks by diversifying geopolitical risks and aligning with capital reallocation trends; but still need to警惕 liquidity changes during USD weakness and sudden changes in global interest rate paths.
- Figure1 - “1966-1981 US Stocks’ Lost 15 Years” vs. 10-Year Annualized Comparison: Contrasting high CAPE and low cycles, emphasizing the historical lesson of long-term return compression from high valuations (X-axis: Year, Y-axis: Index/Annualized Return%); data and annotations from Jinling API logic statistics [0].
- Figure2 - “Normalized Performance of US and Hong Kong Stocks from April 2024 to Now”: Normalized to 100 as of early 2024, highlighting the relative outperformance and time nodes of Nasdaq and Hang Seng after the switching window (X-axis: Date, Y-axis: Index Normalized Value), showing the effectiveness of short-term strategies [0].
- Figure3 - “2020-2025 5-Year Cumulative Return Comparison”: Clearly showing the continuous leading of Nasdaq and the historical downturn of Hang Seng, emphasizing the need for long-term style differences and risk allocation (X-axis: Time, Y-axis: Normalized Return) [0].
Chart Links:
- Elevated Priority of Valuation Risks: Nasdaq CAPE is close to historical peak with significant long-term return risks; the probability of short-term pullbacks is increasing, so it is appropriate to gradually deploy after confirming pullbacks (set a trigger for increasing positions when pullbacks ≥20%).
- Valuation Repair and Industry Advantages of Hong Kong Stocks: Hang Seng Tech still has advantages in the AI/new quality productivity chain, and current valuations are in a reasonable or low position, which can be used as a tactical allocation for “low valuation and high growth”, but individual stock and liquidity risks should be strictly controlled.
- Diversification and Dynamic Allocation: Recommend a framework of “40% US stocks +40% Hong Kong stocks +20% others” (such as USD bonds outside the US/Hong Kong, emerging market assets), with rebalancing based on macro and valuation changes; Hong Kong stock allocation can focus on AI, cloud, digitalization, and new energy tracks.
- Macro Risk Control: Pay attention to US policies (Fed path, fiscal deficit), CAPE/PE fluctuations, USD trends, and geopolitical hotspots; any signal of valuation cliff or USD credit crisis should trigger short-term defense mechanisms (cash/low volatility assets).
- Learn from History but Not Make Simple Analogies: The warning of “high valuation + geopolitics/inflation” from 1966-1981 is relevant, but AI productivity, depth of global capital markets, and China’s growth engine make the current cycle have new variables, so it is necessary to grasp “risk margin” and “growth opportunities” in dynamic judgment.
For further use of in-depth research mode, more granular financial reports, industry data, and strategy simulations can be obtained to support more decisive allocation ratios.
[0] Jinling API Data
[1] Sina Finance - “Before stepping down in 2026, Powell left Wall Street a sentence: US stocks are already very expensive” (https://finance.sina.com.cn/stock/hkstock/hkstocknews/2025-12-29/doc-inhemmwr8176647.shtml)
[2] Securities Times - “Valuation repair and structural reshaping resonate: 2026 Hong Kong stocks anchor four core tracks” (https://www.stcn.com/article/detail/3532621.html)
[3] Al Jazeera Chinese - “The US dollar is facing difficulties: Will Trump shake the hegemonic position of the US dollar?” (https://chinese.aljazeera.net/economy/2025/10/31/美元正面临困境特朗普会撼动美元的霸权地位吗)
Insights are generated using AI models and historical data for informational purposes only. They do not constitute investment advice or recommendations. Past performance is not indicative of future results.
About us: Ginlix AI is the AI Investment Copilot powered by real data, bridging advanced AI with professional financial databases to provide verifiable, truth-based answers. Please use the chat box below to ask any financial question.