Digital Brands Group (DBGI) S&P Total Market Index Inclusion Impact Analysis
Unlock More Features
Login to access AI-powered analysis, deep research reports and more advanced features
About us: Ginlix AI is the AI Investment Copilot powered by real data, bridging advanced AI with professional financial databases to provide verifiable, truth-based answers. Please use the chat box below to ask any financial question.
Related Stocks
According to the latest data, Digital Brands Group (DBGI) was officially included in the S&P Total Market Index (TMI) on December 21, 2025, and the company announced this news to the public on December 29 [0]. This event has had multi-dimensional impacts on the company’s liquidity, valuation, and stock price performance. Below is a comprehensive analysis based on data and research:
- Effective Inclusion Date: December 21, 2025
- Announcement Date: December 29, 2025
- Current Market Capitalization: ~$52.33 million (small-cap stock)
- Industry: Consumer Discretionary - Apparel Retail
- Current Stock Price: $11.67 (closing on December 26, 2025) [0]
From November 1 to December 29, DBGI’s stock price performed strongly:
- Period Gain: From $8.03 to $11.67, an increase of 45.33% [0]
- Year-to-Date (YTD) Gain: 662.75% [0]
- 1-Year Gain: 941.96% [0]
- Announcement Day (December 29): Rose sharply by 11.25%, with trading volume reaching 136,772 shares, higher than the average daily volume of 108,490 shares [0]
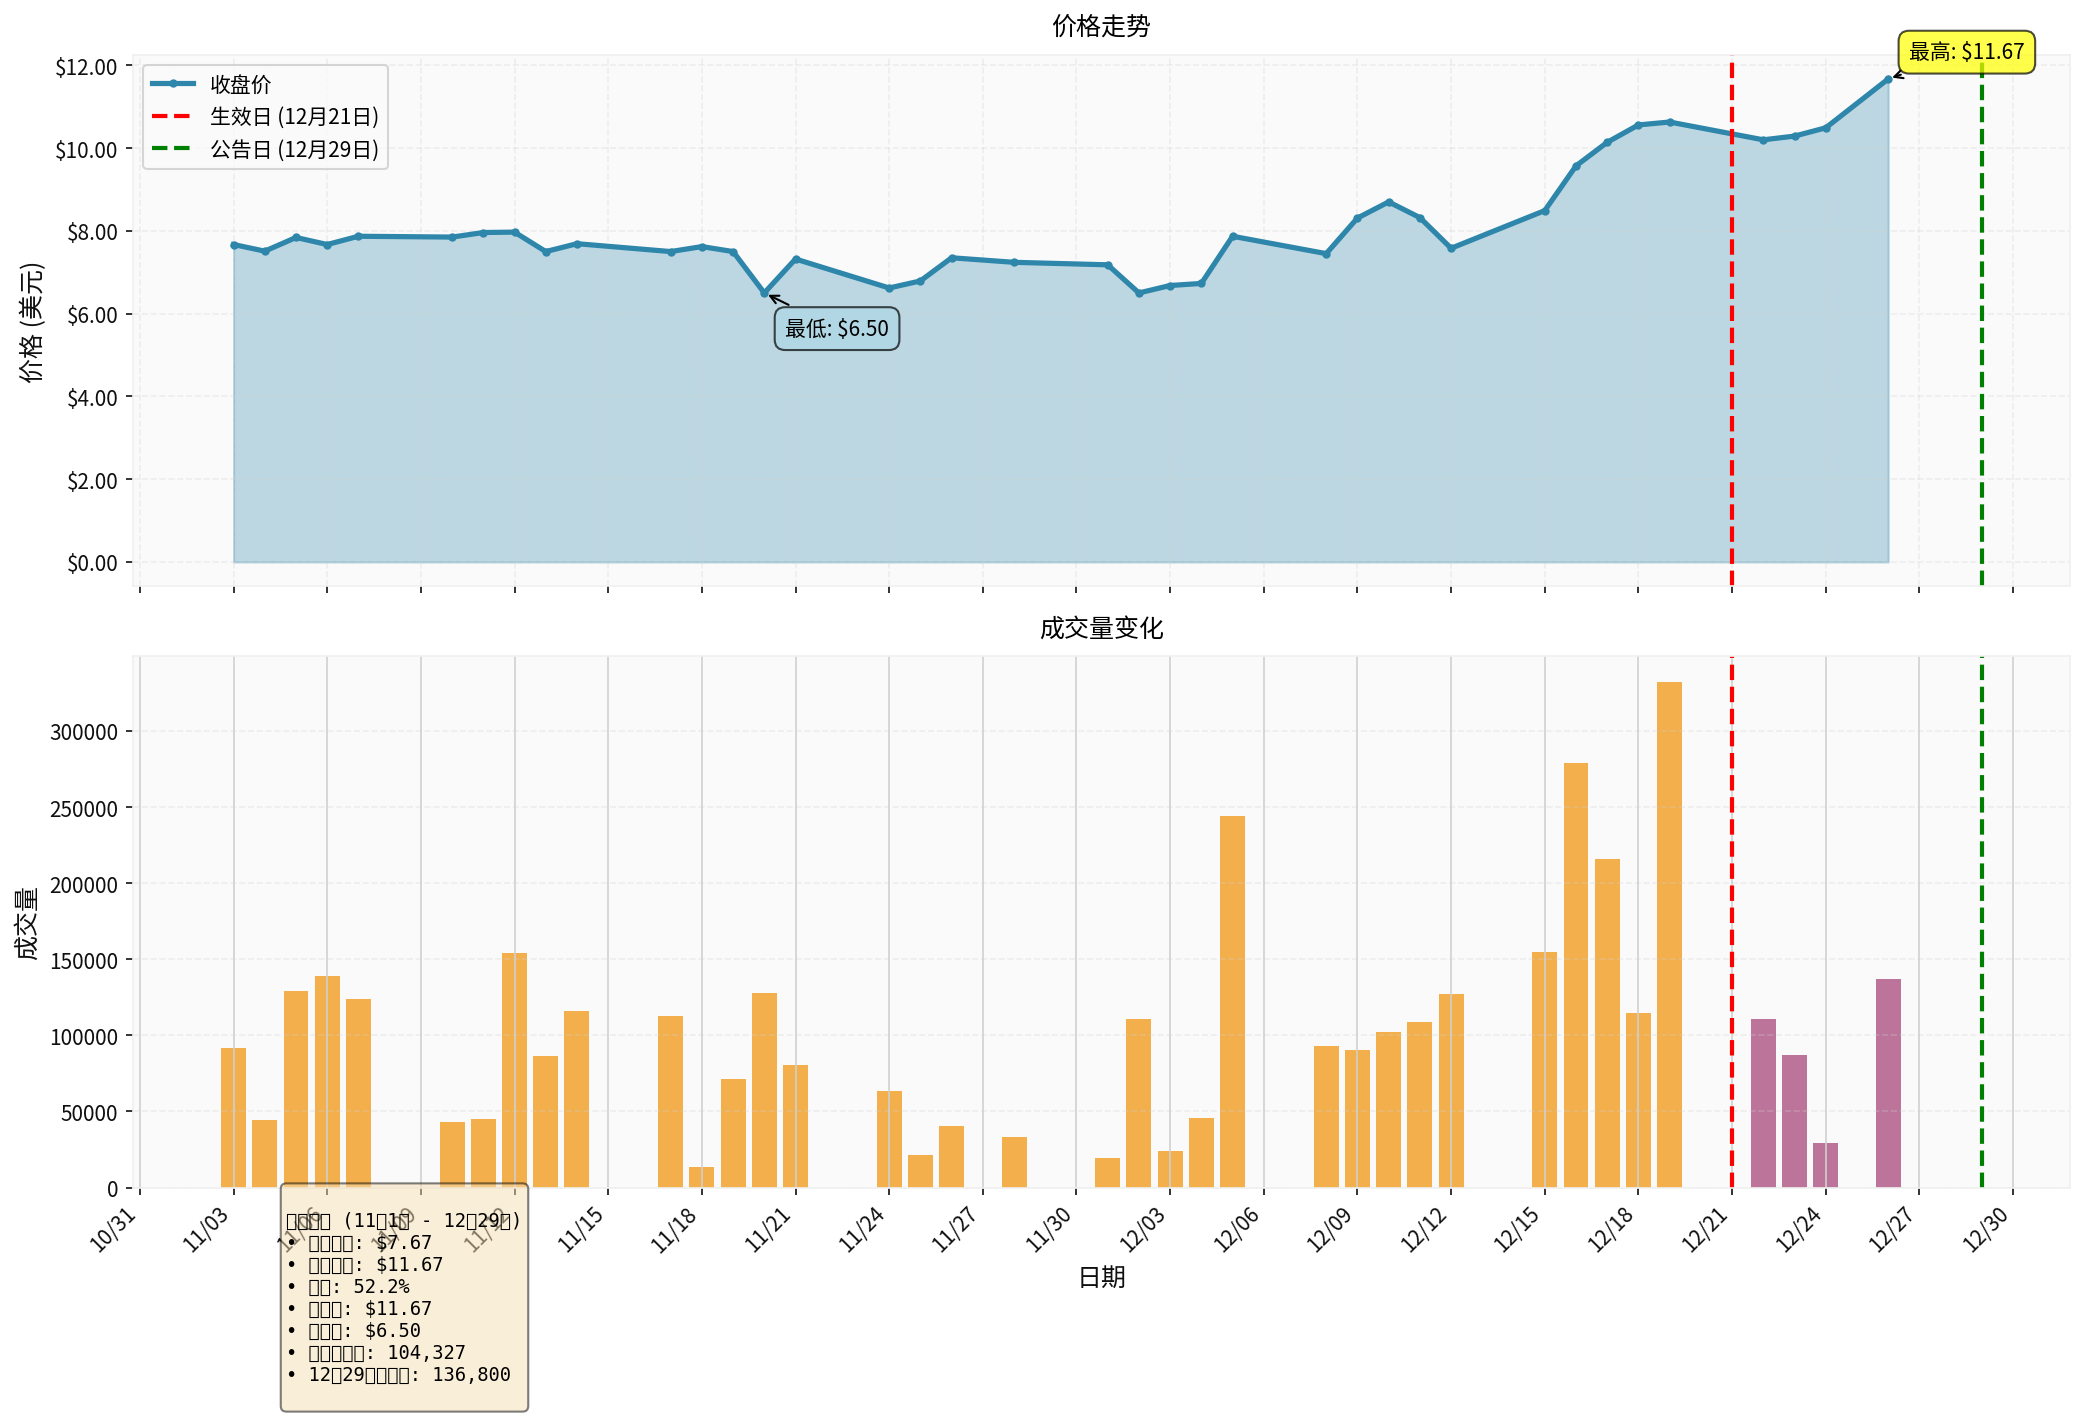
The chart shows DBGI’s price and volume changes around December 21 (index effective date) and December 29 (announcement date). On December 29, volume increased significantly, with a single-day price gain of 11.25%.
The S&P Total Market Index is one of the most comprehensive U.S. stock benchmark indices published by S&P Dow Jones Indices, covering all major U.S. companies that meet float-adjusted market capitalization requirements [1]. Inclusion in this index means:
- Passive Allocation Demand: ETFs and index funds tracking this index must buy DBGI shares according to their weight
- Liquidity Improvement: Academic research shows index inclusion effects significantly increase stock trading activity
- Volume Verification: On the announcement day, volume increased by ~26% compared to the average level, indicating increased market attention [0]
According to Schwab’s research, small-cap stocks (like DBGI) still face liquidity challenges even after index inclusion:
- Relatively Low Trading Volume: Small-cap stocks usually have light trading and large bid-ask spreads
- Tracking Error Risk: Funds holding small-cap stocks may have deviations from index returns due to liquidity issues [1]
Although short-term improvements are obvious, academic research found the intensity of the index effect has weakened significantly since 2005 [1], which may be due to:
- Increased Market Efficiency
- Weakened Value Premium
- Increased Arbitrage Activity
Morningstar research found stocks included in the S&P 500 usually have significant valuation premiums:
- Included Stock Valuation: On average, 92% more expensive than the market
- Excluded Stock Valuation: On average,55% cheaper than the market
- Announcement Effect: Included stocks rise by an average of5% at announcement, while excluded stocks fall by7% [1]
Based on December 29,2025 data [0]:
| Valuation Metric | Value | Evaluation |
|---|---|---|
| P/E Ratio | -1.51x | Loss-making Status |
| P/B Ratio | 1.23x | Slightly Above Book Value |
| P/S Ratio | 6.61x | High Valuation Multiple |
###3. Passive Investment Impact on Valuation Mechanism
According to Oxford University research [1]:
- Inelastic Demand: Passive capital flows usually have price-inelastic characteristics and do not consider valuation levels
- Supply Contraction Effect: Passive inflows reduce the idiosyncratic supply of index components, thereby lowering the discount rate
- Large-cap Stocks Benefit More: This effect is more significant for large-cap stocks but has limited impact on small-cap stocks like DBGI
###4. Long-term Valuation Regression Risk
Academic research warns:
- Reversal Effect: Included stocks usually underperform excluded stocks within1 year after inclusion (lagging by 22%) [1]
- Mean Reversion: Short-term valuation premiums may be corrected in the long term
###1. Technical Analysis
According to the latest technical analysis [0]:
- Trend Status: Uptrend (to be confirmed)
- Key Technical Indicators:
- MACD: Bullish (no crossover)
- KDJ: Bullish (K:78.9, D:76.9, J:82.8)
- RSI: Overbought Risk
- Key Price Levels:
- Support: $9.96
- Resistance: $12.32 (close to current price)
- Next Target: $13.37
###2. Volatility Characteristics
From November3 to December26,2025 [0]:
- Daily Return Volatility:6.78%
- Price Range: $6.50-$12.32, range volatility of 79.54%
- Beta: 0.39 (relative to SPY), indicating low correlation with the broader market
###3. Historical Performance Warning
Although recent performance is impressive, long-term data shows high risks:
- 3-Year Decline:99.79%
- 5-Year Decline:100%
This indicates the company may have undergone restructuring or major fundamental changes.
###1. Financial Health Status
Based on the latest financial data [0]:
| Financial Indicator | Value | Evaluation |
|---|---|---|
| Net Profit Margin | -164.55% | Severe Loss |
| Operating Profit Margin | -151.56% | Operating Loss |
| ROE | -186.22% | Severe Shareholder Equity Loss |
| Current Ratio | 0.81 | Below Healthy Level (>1.5 recommended) |
| Quick Ratio | 0.63 | Weak Short-term Solvency |
###2. Latest Results (Quarter Ended November14,2025) [0]
- EPS: -$1.18
- Revenue: $1.7M
- The company continues to be in loss, but business transformation is underway
###3. Business Development Highlights
Recent news shows the company is actively transforming [0]:
- AI-Driven Tools: Advancing AI-powered brand protection and growth tool suites (December 22,2025)
- Brand Collaboration: Partnering with Herschel Supply Co. on AI brand protection (December16,2025)
- University Partnership: Exclusive apparel manufacturing agreement with University of Mississippi’s Grove Collective (December11,2025)
- AI Marketing Capabilities: Expanding AI marketing capabilities via collaboration with Aha (formerly HeadAI) (December8,2025)
###4. Financial Analysis Conclusion
Financial analysis shows [0]:
- Accounting Attitude: Conservative
- Debt Risk: Medium
- Free Cash Flow: -$6.15M
- Conclusion: The company is in the investment phase; profitability needs improvement
- Index Inclusion Effect: Passive inflows may provide short-term liquidity support
- Transformation Potential: AI and brand protection businesses may bring new growth points
- Small-cap Rebound: Discount of small-cap stocks vs S&P500 (~10% current discount) may create opportunities [1]
- Fundamental Risk: Continuous large losses and fragile financial conditions
- Liquidity Risk: Small-cap liquidity remains limited despite index inclusion
- Valuation Risk: Current P/S ratio of6.61x may have discounted future growth
- Reversal Risk: Academic research shows potential underperformance within1 year post-inclusion
- High Volatility:6.78% daily volatility implies high investment risk
- Short-term Traders: May benefit from short-term liquidity and attention gains
- Long-term Investors: Focus on transformation progress and profit improvement; high uncertainty remains
- Risk Tolerance: Only suitable for high-risk investors; strict position control recommended
Inclusion in the S&P Total Market Index has multiple impacts on Digital Brands Group:
- Significantly improved market visibility and institutional attention
- Passive inflows improved short-term liquidity
- Strong price performance around announcement/effective dates
- Technicals indicate uptrend
- Weak fundamentals with continuous large losses
- Relatively high valuation (P/S=6.61x)
- Questionable long-term sustainability of index effect (per academic research)
- Limited liquidity improvement and high volatility for small-cap
[0] Gilin API Data - Digital Brands Group (DBGI) stock price, financial data, technical analysis and news
[1] Morningstar UK - “The Hidden Costs of Passive Investing” (https://global.morningstar.com/en-gb/personal-finance/hidden-costs-passive-investing)
[2] Schwab - “The S&P600: An Often-Overlooked Small-Cap Index” (https://www.schwab.com/learn/story/sp-600-often-overlooked-small-cap-index)
[3] Oxford Academic - “Passive Investing and the Rise of Mega-Firms” (https://academic.oup.com/rfs/article/38/12/3461/8280528)
[4] Globe Newswire - “Digital Brands Group Added to S&P Total Market Index (TMI)” (https://www.globenewswire.com/news-release/2025/12/29/3210914/0/en/Digital-Brands-Group-Added-to-S-P-Total-Market-Index-TMI.html)
[5] Bristol University - “A Survey of the Consequences of Passive Investment Funds” (https://www.bristol.ac.uk/media-library/sites/business-school/documents/passive-investment-fca-report.pdf)
机构大规模持有ETH对以太坊生态系统及投资价值的全面影响分析
Insights are generated using AI models and historical data for informational purposes only. They do not constitute investment advice or recommendations. Past performance is not indicative of future results.
About us: Ginlix AI is the AI Investment Copilot powered by real data, bridging advanced AI with professional financial databases to provide verifiable, truth-based answers. Please use the chat box below to ask any financial question.