Can Hang Seng Tech Replace Nasdaq as a Next-Decade Long-Bull Investment Option?
Unlock More Features
Login to access AI-powered analysis, deep research reports and more advanced features
About us: Ginlix AI is the AI Investment Copilot powered by real data, bridging advanced AI with professional financial databases to provide verifiable, truth-based answers. Please use the chat box below to ask any financial question.
Related Stocks
Based on professional brokerage data and in-depth market analysis, I will provide a systematic and comprehensive analysis from multiple dimensions including
| Indicator | Hang Seng Tech ETF (3033.HK) | Nasdaq ETF (QQQ) | Difference |
|---|---|---|---|
Current Price |
$5.37 | $621.30 | - |
P/E Ratio |
20.30 | 34.21 | Hang Seng Tech is 40.6% cheaper |
52-Week Range |
$4.09 - $6.59 | $402.39 - $637.01 | - |
Beta Coefficient |
0.24 | 1.19 | Low correlation between Hang Seng Tech and US stocks |
Market Cap |
$44.71B | $408.08B | - |
- Hang Seng Tech is significantly undervalued: P/E ratio is only 20.30, which is40.6% cheaperthan Nasdaq’s 34.21 [0]
- Low Beta characteristic: Hang Seng Tech’s Beta is only 0.24, with extremely low correlation to the S&P500, havingdiversification allocation value[0]
According to my calculated data from January 2023 to December 2025 [0]:
| Indicator | Hang Seng Tech | Nasdaq | Winner |
|---|---|---|---|
Total Return |
28.72% | 134.96% | Nasdaq (+106%) |
Annualized Return |
8.82% | 33.11% | Nasdaq |
Max Drawdown |
-37.90% | -22.88% | Nasdaq (lower risk) |
Sharpe Ratio |
0.34 | 1.39 | Nasdaq (better risk-adjusted return) |
- Over the past three years, Nasdaq has comprehensively outperformedHang Seng Tech in terms of absolute returns, volatility control, and risk-adjusted returns
- Hang Seng Tech’s high volatility(max drawdown of nearly 38%) is significantly higher than Nasdaq’s (23%) [0]
The Hang Seng Tech Index covers the 30 largest tech enterprises in the Hong Kong stock market, with main components including:
- Internet leaders: Tencent Holdings (0700.HK), Alibaba-SW (09988.HK), Meituan-W (03690.HK)
- Emerging tech: Xiaomi Group-W (01810.HK), Kuaishou-W (01024.HK), JD Group-SW (09618.HK)
- Hard tech: SMIC (00981.HK), Sunny Optical Tech (02382.HK)
-
Extremely low valuation: Current P/E ratio is only 20.30, compared to Nasdaq’s 34.21, there issignificant valuation repair space[0]
-
Policy bottom passed: The strict regulatory cycle of 2021-2022 has ended, and the policy environment has shifted to support platform economic development
-
Earnings recovery: Profitability of internet leaders has recovered, and companies like Tencent and Alibaba have increased share repurchase efforts
-
Geopolitical hedge: Low correlation with US stocks (Beta 0.24), can serve as a hedge allocation for US stock portfolios [0]
-
Geopolitical risks: Repeated China-US relations, long-term delisting risk of Chinese concept stocks
-
Regulatory uncertainty: Although the harshest period has passed, the regulatory framework is still evolving
-
Capital outflow pressure: Foreign allocation to Chinese assets is at a historical low
-
High volatility: Historical max drawdown of -37.90%, requiring strong risk tolerance [0]
- Current trend: Sideways consolidation, trading range [$617.44, $625.41]
- KDJ indicator: Overbought warning(K value 80.9)
- MACD: Bullish, but no clear crossover signal
- Beta as high as 1.19: Highly correlated with S&P500, high systemic risk
-
Valuation at historical high: P/E ratio of 34.21 is significantly higher than historical average
-
Doubts about AI investment returns: Market starts to question the monetization ability of AI spending
-
Concentration risk of “Mag7”: Seven giants contributed most of the S&P500’s gains
-
Cost of geopolitical hegemony: Military spending to maintain global hegemony may drag on fiscal
Your view is not without basis:
- Vietnam War fiscal burden
- Inflation pressure
- Oil crisis
- Relative decline of US global hegemony
- Geopolitical conflicts like Ukraine war, Red Sea naval battles
- US debt scale surge (exceeded 36 trillion USD in 2025)
- Fed has entered interest rate cut cycle but rates are still relatively high
- Relative decline of US global influence (e.g., Red Sea crisis handling)
- Current US technological innovation capability still leads (AI, chips, biomedicine)
- Dollar remains the main reserve currency
- US corporate profitability and capital efficiency are still strong
###4.1 Core Logic of “East Rises West Falls”
Basic assumptions of this theme:
- US relative decline: Loosening geopolitical hegemony, unsustainable fiscal deficit, increasing social division
- China relative rise: Industrial chain completeness advantage, technological innovation catch-up, domestic demand market potential
- Capital rebalancing: Global capital will reallocate from over-allocation to US to Chinese assets
###4.2 Rationality of HK Tech as “East Rises West Falls” Carrier
- Valuation depression: Hang Seng Tech P/E ratio of 20.30 is at historical low [0]
- High-quality assets: Tencent, Alibaba etc. have strong cash flow and profitability
- Friendly policy shift: Central policy emphasizes “developing new quality productive forces” and supports tech innovation
- Low foreign allocation: Passive index funds have low HK stock allocation, with incremental fund space
- Long time horizon: Historically, this is adecades-level trend, not short-term
- High volatility: Historical max drawdown of nearly38% [0], requiring extreme patience
- Institutional differences: HK market system differs from US, lower liquidity
- RMB exchange rate risk: RMB depreciation erodes dollar-denominated returns
###4.3 Investment Strategy Recommendations
Based on data analysis, if you adhere to the “East Rises West Falls” theme:
- Hang Seng Tech ETF:30-50%
- Nasdaq ETF:10-20%
- Remaining: Other assets (A-shares, gold, high-dividend stocks)
- Hang Seng Tech ETF:15-25%
- Nasdaq ETF:30-40%
- Use low correlation (Beta0.24 vs 1.19) for diversification [0]
- Hang Seng Tech ETF:5-10%
- Nasdaq ETF:20-30%
- Wait for clearer signals (e.g., dollar index drop, sustained RMB appreciation)
Based on comprehensive analysis:
###5.1 Short-Medium Term (1-3Y):
- Huge historical performance gap: Nasdaq annualized return of33.11% vs Hang Seng Tech’s 8.82% [0]
- Risk-adjusted return disadvantage: Sharpe ratio0.34 vs1.39 [0]
- Poor max drawdown control: -37.90% vs-22.88% [0]
- Market structure difference: Nasdaq leads global tech innovation; Hang Seng Tech focuses on application layer
###5.2 Long Term (5-10Y):
- Global competitiveness in AI, chips, high-end manufacturing
- Shift from business model to hard tech innovation
- Stable China-US “competitive coexistence”
- Delisting risk of Chinese concept stocks resolved
- Foreign confidence in Chinese assets restored
- More internationalized A-share/HK stock systems
- Progress in capital account convertibility
- RMB internationalization breakthroughs
###5.3 Current Investment Recommendations
For investors who switched from Nasdaq to Hang Seng Tech:
✅
- Valuation judgment: Correctly identified historical low [0]
- Diversification: Low US stock correlation (Beta0.24) [0]
- Long-term layout: Good timing if you believe the theme
⚠️
- Long time horizon: Decades-level trend with short-term volatility
- Volatility management: Max drawdown of ~38% requires psychological tolerance [0]
- Dynamic adjustment: Avoid all-in, keep portfolio flexibility
- Core Allocation (60%): Hang Seng Tech ETF
- Logic: Low valuation, friendly policy, long-term theme
- Hedge Allocation (30%): Nasdaq/global tech ETFs
- Logic: Avoid missing US tech dividends
- Protective Allocation (10%): Gold, high-dividend stocks or cash
- Logic: Handle extreme risks
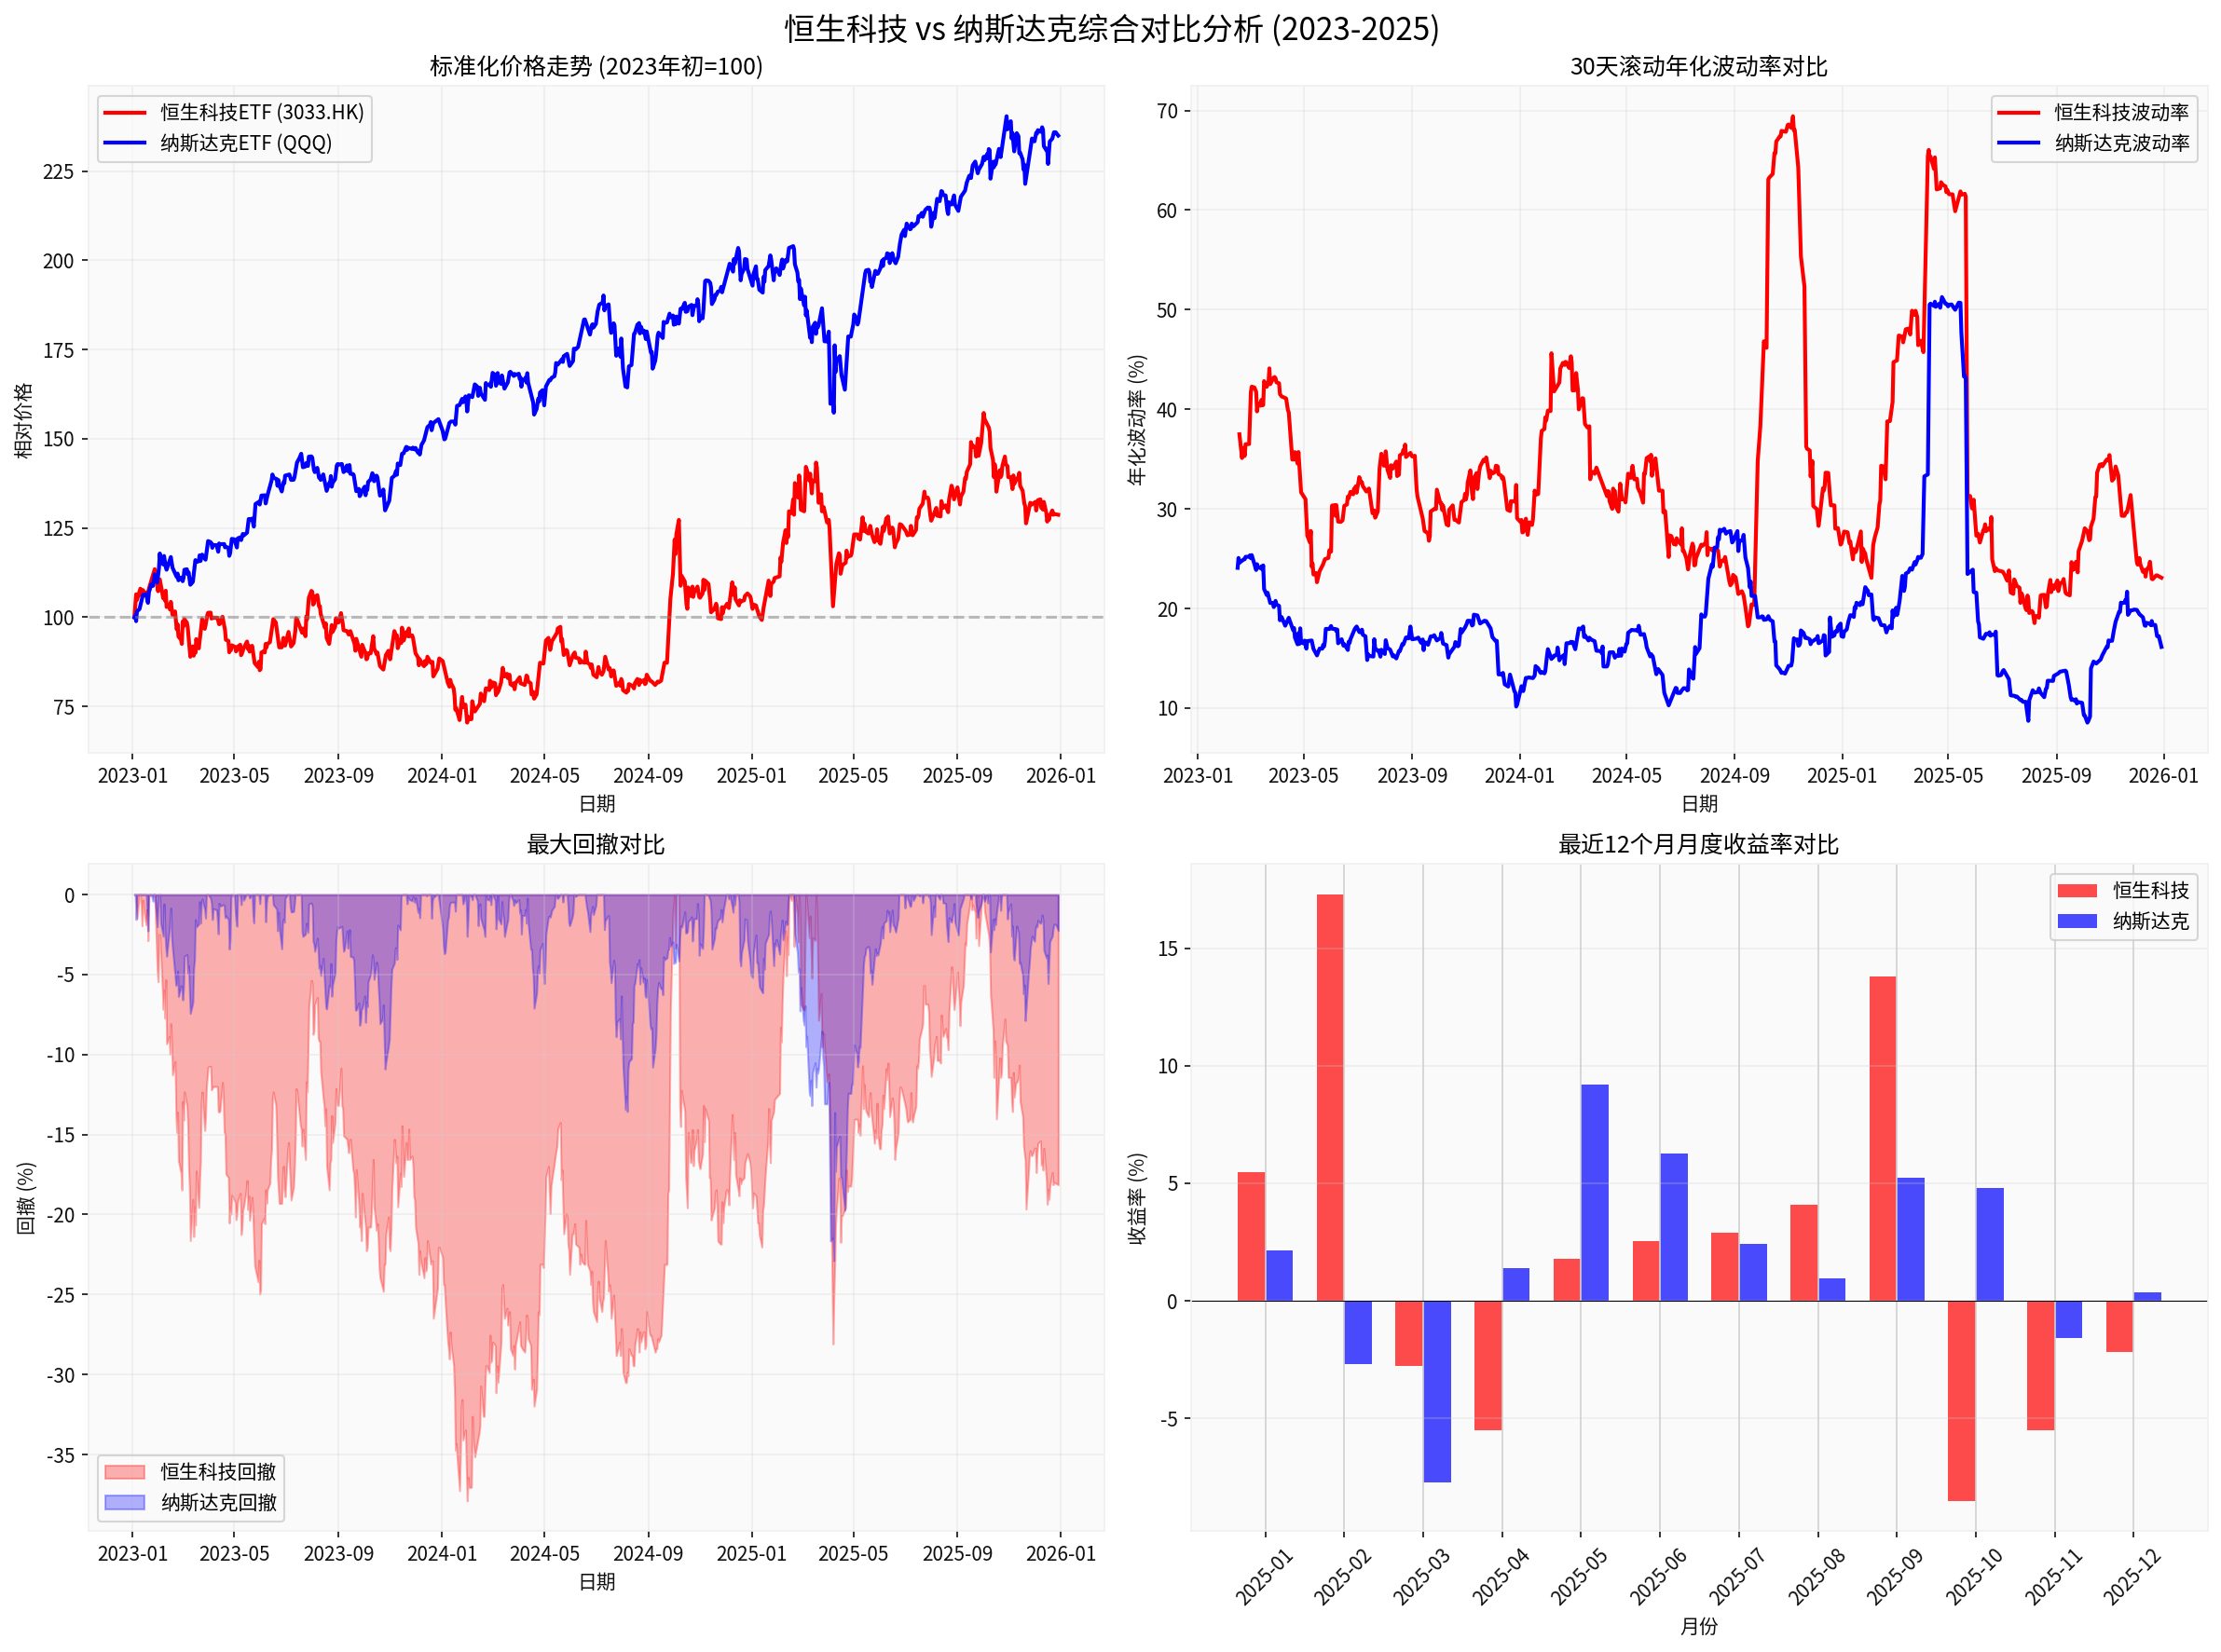
- Standardized Price Trend: Nasdaq rose from100→235 vs Hang Seng Tech→129 [0]
- 30D Rolling Volatility: Hang Seng Tech volatility is higher
- Max Drawdown: Hang Seng Tech (-37.90%) vs Nasdaq (-22.88%) [0]
- Recent 12M Monthly Returns: Nasdaq more stable
###7.1 Core Conclusion
Answer:
- Historical performance does not support replacement:33.11% vs 8.82% [0]
- Risk-adjusted return disadvantage:0.34 vs 1.39 [0]
- Allocation Value Exists:
-40% valuation discount (20.30 vs 34.21) [0]
-Low US correlation (Beta0.24) [0]
-Potential excess returns if theme holds
###7.2 Feasibility of “East Rises West Falls”
This is a worthy long-term theme but:
- Long time: >10Y trend
- Tortuous process: Repeated great power games
- Dynamic verification: Track innovation breakthroughs, RMB internationalization, foreign inflow
###7.3 Final Recommendations
For theme believers:
✅
- Use Hang Seng Tech as core allocation (30-50%)
- Hold long-term (5-10Y)
- Regular fixed investment to smooth costs
- Allocate high-dividend assets
❌
- All-in Hang Seng Tech, abandon Nasdaq
- Expect short-term gains
- Ignore volatility or over-leverage
- Neglect geopolitical risks
- Core (60%): Global tech leaders (Nasdaq + HK Tech)
- Satellite (30%): Chinese tech assets
- Protective (10%): Gold, high-dividend stocks
This shares global innovation dividends, leaves theme room, and controls risk.
[0] Jinling API Data: Real-time quotes, historical prices, technical/fi data for Hang Seng Tech ETF (3033.HK) and Nasdaq ETF (QQQ)
[1] Bloomberg: “Yardeni Moves to Underweight on Mag7 After15-Year Tech Bet” (Dec8,2025)
[2] Wall Street Journal: “Stock Market News, Dec17,2025: Tech Slide Weighs on Nasdaq”
[3] Yahoo Finance: “2025’s Biggest Market Bets Deliver Wins, Wipeouts and Sharp Turns”
Insights are generated using AI models and historical data for informational purposes only. They do not constitute investment advice or recommendations. Past performance is not indicative of future results.
About us: Ginlix AI is the AI Investment Copilot powered by real data, bridging advanced AI with professional financial databases to provide verifiable, truth-based answers. Please use the chat box below to ask any financial question.