Thermal Power Investment Landscape Under Power Market Reform: Transformation and Value Revaluation
Unlock More Features
Login to access AI-powered analysis, deep research reports and more advanced features
About us: Ginlix AI is the AI Investment Copilot powered by real data, bridging advanced AI with professional financial databases to provide verifiable, truth-based answers. Please use the chat box below to ask any financial question.
Related Stocks
Based on an in-depth analysis of Wanneng Power (000543.SZ) and Beijing Energy Power (600578.SS), I will systematically elaborate on the impact of thermal power units’ transition to monthly bidding transactions on the investment landscape of the power industry, and conduct a comprehensive revaluation of the investment value of the two companies [0][1].
According to the background information provided by users, the 2026 power market rules have undergone major changes:
- Reduction in annual contract baseline: Thermal power annual contract baseline decreased from80% to 60%
- Transaction structure transformation: Electricity sales companies reduced annual contracts and shifted tomonthly bidding transactions
- Power source role restructuring: Thermal power units transitioned frombase load power sourcesto monthly bidding transactions in thepeak-shaving market
- New energy strategy: New energy enterprises actively signedannual long-term contracts
This reform marks a key transition of the power market from planned pricing to marketization:
- Optimized price discovery mechanism: Monthly bidding better reflects real-time supply and demand relations, improving resource allocation efficiency
- Risk diversification effect: Reduced proportion of annual long-term contracts decreases price locking risks but increases short-term volatility risks
- Highlighted peak-shaving value: The flexibility value of thermal power is repriced by the market, shifting from pure power generation to auxiliary services
This transformation brings three impacts:
-
Increased revenue volatility: Monthly bidding makes electricity prices fluctuate in real time with coal prices and supply-demand, shifting thermal power enterprises’ revenue from “stable” to “cyclical”
-
Valuation of peak-shaving capacity: As peak-shaving power sources, indicators such as start-stop flexibility and ramp rate of thermal power units become core competitiveness
-
Changed investment decision logic: Investors need to evaluate enterprises’ market transaction capabilities and risk hedging strategies, rather than just installed capacity
- New energy strategy: Sign long-term contracts to lock in revenue but need thermal power to provide peak-shaving support
- Thermal power positioning transformation: From main power source toregulatory power sourceandguarantee power source
- Value revaluation dimension: The value of thermal power is no longer only about power generation but aboutsystem guarantee value
| Traditional Evaluation Dimensions | Emerging Evaluation Dimensions |
|---|---|
| Installed Capacity | Peak-shaving Capacity (Ramp Rate, Minimum Output) |
| Annual Power Generation | Monthly Bidding Strategy |
| Long-term Contract Proportion | Professional Capability of Market Transaction Team |
| Fuel Cost Control | Risk Hedging Mechanism (Futures, Options) |
| Asset-liability Ratio | Cash Flow Volatility Management |
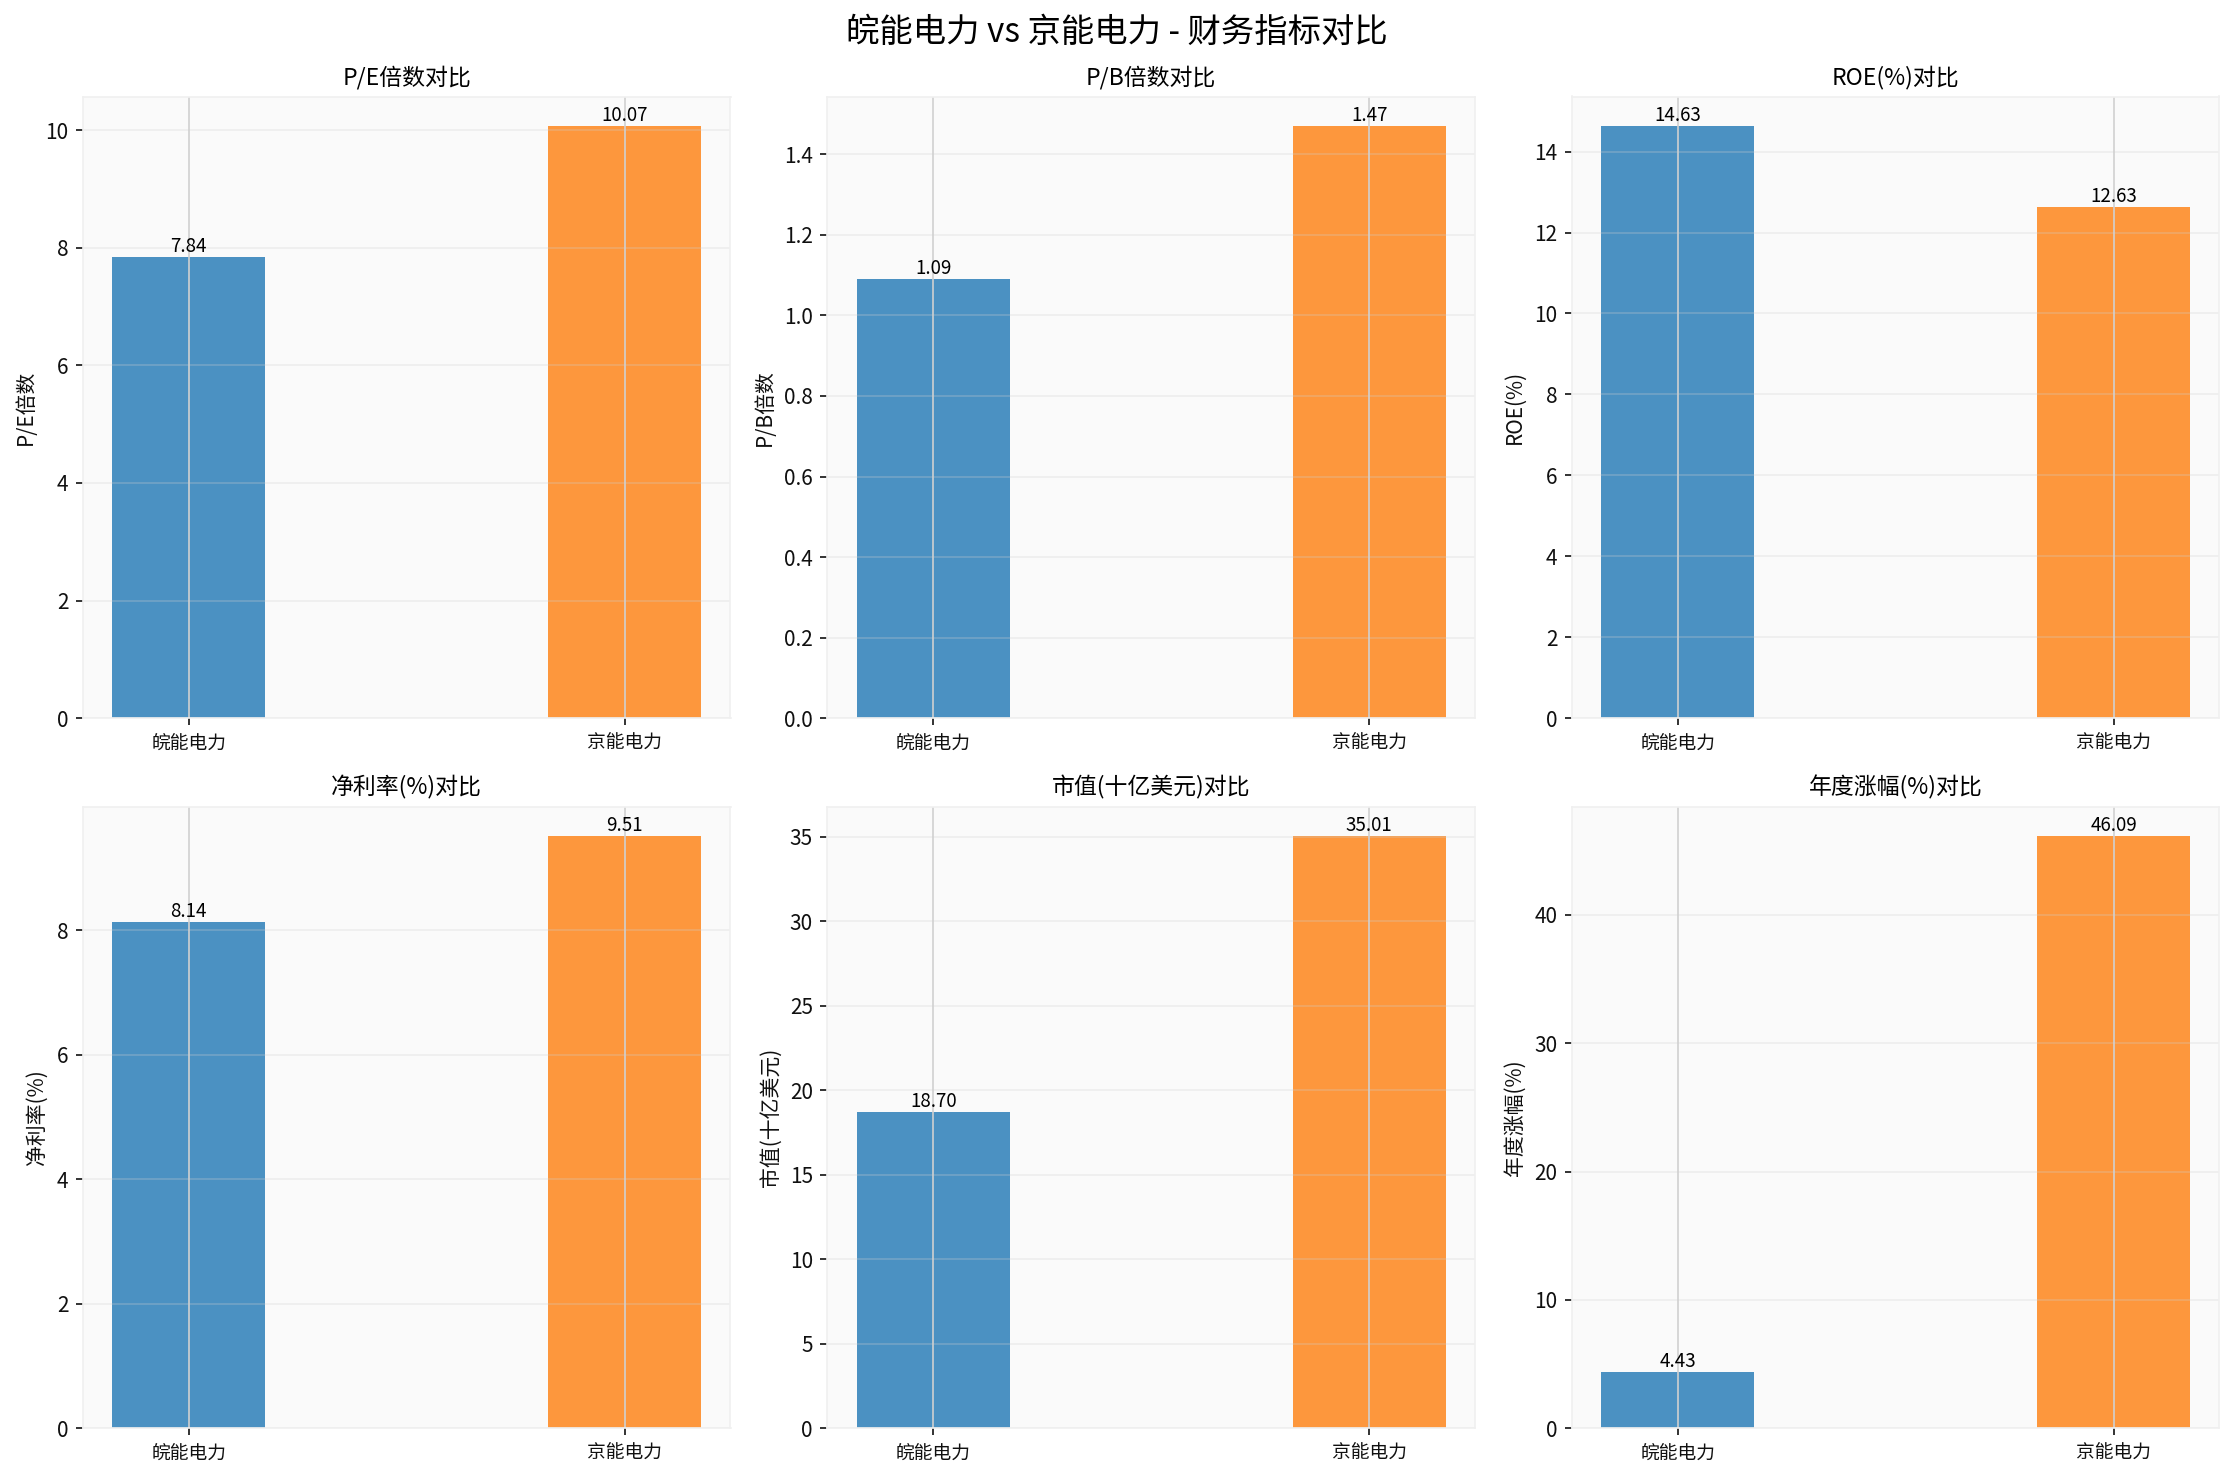
| Indicator | Wanneng Power (000543.SZ) | Beijing Energy Power (600578.SS) | Evaluation |
|---|---|---|---|
Market Value |
18.7 billion USD | 35 billion USD | Beijing Energy is larger but Wanneng is more flexible |
P/E Multiple |
7.84x | 10.07x | Wanneng has lower valuation |
P/B Multiple |
1.09x | 1.47x | Wanneng is close to book value |
ROE |
14.63% | 12.63% | Wanneng has higher capital return rate |
Net Profit Margin |
8.14% | 9.51% | Beijing Energy has slightly higher profit margin |
Financial Attitude |
Conservative | Conservative | Both adopt conservative accounting policies |
Debt Risk |
High Risk | High Risk | Industry commonality, need to pay attention to cash flow |
Free Cash Flow |
-1.84 billion USD (2024) | +1.27 billion USD (2024) | Beijing Energy has healthier cash flow |
-
Beijing Energy Powerperformed more strongly:
- Year-to-date increase: 52.92%
- 1-year increase: 46.09%
- 3-month increase: 25.12%
- Year-to-date increase:
-
Wanneng Powerwas relatively stable:
- Year-to-date increase: 7.28%
-1-year increase:4.43%
-3-month increase:15.71%
- Year-to-date increase:
###3.3 Core Competitiveness Comparison Analysis
- Obvious Valuation Advantage: P/E only 7.84x, P/B close to1.09x, withmargin of safety
- Outstanding Profitability: ROE reaches14.63%, significantly higher than industry average
- Regional Market Position: Anhui is in the power load center with strong peak-shaving demand
- Transformation Elasticity: Smaller market value, more flexible strategy adjustment
- Cash Flow Pressure: Negative free cash flow, pressure increases in high volatility environment of monthly bidding
- Debt Risk: High risk classification, need to pay attention to financing costs
- Weak Short-term Stock Price: Only 7.28% increase year-to-date, relatively low market attention
- Suitable for investors with low risk tolerance
- Pay attention to dividend yield and asset revaluation value
- Suggest waiting for clearer cash flow improvement signals
- Scale Advantage: Market value of35 billion USD, with stronger capital strength and risk resistance
- Healthy Cash Flow: Positive free cash flow of 1.27 billion USD in2024, stronger ability to cope with monthly bidding volatility
- Strong Market Performance: 52.92% year-to-date increase, reflecting market recognition of its transformation ability
- Regional Advantage: Beijing and surrounding areas have strong peak-shaving demand and high electricity price tolerance
- Valuation Pressure: P/E has reached10.07x, at a relatively high level in the industry
- Overdrawn Increase: 46.09% increase in one year, may face correction pressure in the short term
- Debt Risk: Same as high risk classification, need continuous monitoring
- Suitable for investors optimistic about thermal power peak-shaving value revaluation
- Pay attention to the execution effect of its monthly bidding strategy
- Suggest building positions in batches to avoid chasing high prices
###4.1 Core Elements of New Valuation System
Under the monthly bidding transaction model, traditional PE/PB valuation needs to be supplemented with the following dimensions:
| Valuation Dimension | Key Indicators | Weight Suggestion |
|---|---|---|
Profit Stability |
Monthly bidding win rate, annual long-term contract proportion | 30% |
Peak-shaving Capacity |
Minimum technical output, ramp rate, start-stop time | 25% |
Cash Flow Resilience |
Operating cash flow/free cash flow stability | 20% |
Risk Hedging |
Coal futures hedging proportion, electricity price futures usage | 15% |
Location Advantage |
Regional electricity price level, peak-shaving demand intensity | 10% |
###4.2 Revaluation Conclusions and Allocation Suggestions
-
Wanneng Power: Maintainneutral to positiveview
- Low valuation provides safety cushion
- Pay attention to market reaction after monthly bidding strategy announcement
-
Beijing Energy Power: Maintainneutral to negativeview
- Large increase, correction risk exists in short term
- Suggest waiting for better entry opportunity
- Industry Overall: Optimistic about enterprises withpeak-shaving advantageandcash flow resilience
- Allocation Strategy:
- Core Allocation(60%): Wanneng Power — Large valuation repair space
- Satellite Allocation(40%): Beijing Energy Power — Stronger growth but higher volatility
- Investment Theme: Power Marketization Reform → Thermal Power Peak-shaving Value Revaluation
- Key Catalysts:
- Improvement of auxiliary service market mechanism
- Implementation of capacity tariff policy
- Linkage between carbon market and power market
###5.1 Main Risk Factors
- Policy Risk: Power market reform progress is slower than expected
- Market Risk: Monthly bidding price fluctuates sharply
- Cost Risk: Coal price fluctuates violently
- Technical Risk: Breakthrough of new energy storage technology weakens thermal power peak-shaving value
- Financial Risk: High debt level increases pressure in interest rate hike cycle
###5.2 Investment Suggestions
- Priority choose Wanneng Power, pay attention to its dividend yield
- Wait for clearer cash flow improvement signals
- Build positions in batches to reduce volatility risk
- Consider allocating30-40% of Beijing Energy Power to seek peak-shaving value revaluation returns
- Set stop-loss level to control retracement risk
- Pay attention to monthly bidding data and adjust positions dynamically
- Suggest adopting “Wanneng + Beijing Energy” portfolio allocation, balancing value and growth
- Use power futures tools to hedge price volatility risk
- Continuously track power market reform policy trends
The transition of thermal power units to monthly bidding transactions is an inevitable path of power marketization reform, and this change is reshaping the industry investment landscape:
-
From Scale-oriented to Capability-oriented: Installed capacity is no longer core competitiveness; peak-shaving capacity and market transaction capability become key
-
From Stable Revenue to Elastic Revenue: Revenue model shifts from “stable” to “cyclical”, investors need to re-evaluate risk-return characteristics
-
From Power Generation Enterprise to System Service Provider: The value of thermal power enterprises shifts from power generation to system guarantee value, requiring a new valuation system
In this context, Wanneng Power and Beijing Energy Power have their own characteristics:
- Wanneng Poweris suitable asvalue-type allocation targetwith high valuation safety margin
- Beijing Energy Poweris suitable asgrowth-type allocation targetwith large peak-shaving value revaluation space
Investors should build differentiated allocation strategies based on their own risk preferences and investment horizons, while closely following power market reform policy trends and enterprise execution effects.
[0] Jinling API Data — Financial data, stock price performance and market indicator data of Wanneng Power (000543.SZ) and Beijing Energy Power (600578.SS)
[1] Jinling API Data — Financial analysis reports of the two companies, including cash flow, debt risk and financial attitude evaluation
Insights are generated using AI models and historical data for informational purposes only. They do not constitute investment advice or recommendations. Past performance is not indicative of future results.
About us: Ginlix AI is the AI Investment Copilot powered by real data, bridging advanced AI with professional financial databases to provide verifiable, truth-based answers. Please use the chat box below to ask any financial question.