Analysis of the Impact of Thermal Power Transformation Monthly Bidding Transactions on Power Industry Investment (Based on 2026 Transaction Data)
Unlock More Features
Login to access AI-powered analysis, deep research reports and more advanced features
About us: Ginlix AI is the AI Investment Copilot powered by real data, bridging advanced AI with professional financial databases to provide verifiable, truth-based answers. Please use the chat box below to ask any financial question.
Related Stocks
Based on the background information provided, the following analysis uses 2026 power transaction data as the scenario: Guangdong’s generation-side annual contract volume was 359.4 billion kWh, lower than the forecast of 420 billion kWh, and the minimum annual contract volume threshold for thermal power dropped from 80% to 60%. These changes reflect that thermal power strategies have shifted from pursuing excess returns to “guaranteed base + price spread game” and are participating more in monthly bidding and peak-shaving markets. Meanwhile, current (as of December 30, 2025) market and company data are used to evaluate asset quality and valuation levels (for cross-period comparison).
- The minimum contract volume threshold dropped from 80% to 60%, meaning thermal power enterprises actively release about 20 percentage points of electricity to monthly bidding and peak-shaving markets, shifting strategies from “pursuing excess returns” to “locking guaranteed base electricity + seeking price spread and capacity/ancillary service returns”. This shift will significantly increase seasonal and intraday fluctuations in electricity prices, enhancing dependence on “marginal pricing” and “peak-valley price spread” (the specific extent depends on regional policies and supply-demand conditions).
- New energy, with marginal costs close to zero, tends to sign annual long-term contracts at a “renewable output proportion” to lock in consumption, further compressing the share of thermal power long-term contract electricity. Against this background, the role transformation of thermal power from “base load power source” to “peak-shaving/backup power source” is accelerating.
- Power sales companies reduce annual contracts and increase monthly bidding exposure to gamble on short-term supply-demand and price fluctuations. This “mismatch strategy” will push up transaction volume and volatility in the monthly market, requiring power generation enterprises to have stronger forecasting and transaction capabilities for spot and monthly bidding price formation mechanisms, peak-valley load curves, and renewable output rhythms.
- Implications for thermal power investment: Simply pursuing scale and utilization hours will not be sufficient; “quotation strategy, risk management, and proportion of spot/ancillary service revenue” will become more important drivers of valuation.
- With the increase in new energy proportion and the reduction in annual long-term contract ratio, the value of peak-shaving and reserve services will further increase. The flexibility transformation, ramp-up capability, and fast start-stop capabilities of thermal power will directly affect its revenue structure in peak-shaving and spot markets.
- For investment, units with stronger regulation capability and marginal cost advantage(such as advanced ultra-supercritical + flexibility transformation) are expected to obtain premiums in price spreads and capacity/ancillary services.
| Indicator | Beijing Energy Int’l | Anhui Energy Group |
|---|---|---|
| Closing Price | 5.15 CNY | 8.13 CNY |
| Market Cap | ~34.61 billion CNY | ~18.43 billion CNY |
| P/E (TTM) | ~9.95x | ~7.72x |
| P/B | ~1.46x | ~1.07x |
| ROE | ~12.63% | ~14.63% |
| YTD 2024 Return | ~71.10% | ~23.37% |
| Price Range Characteristics (2024-2025) | Amplitude ~104.47% within the range, close to the lower edge | Amplitude ~117.47% within the range, also close to the lower edge |
Data and Chart Source: Brokerage API (Price/Volume/Financial Indicators) [0]
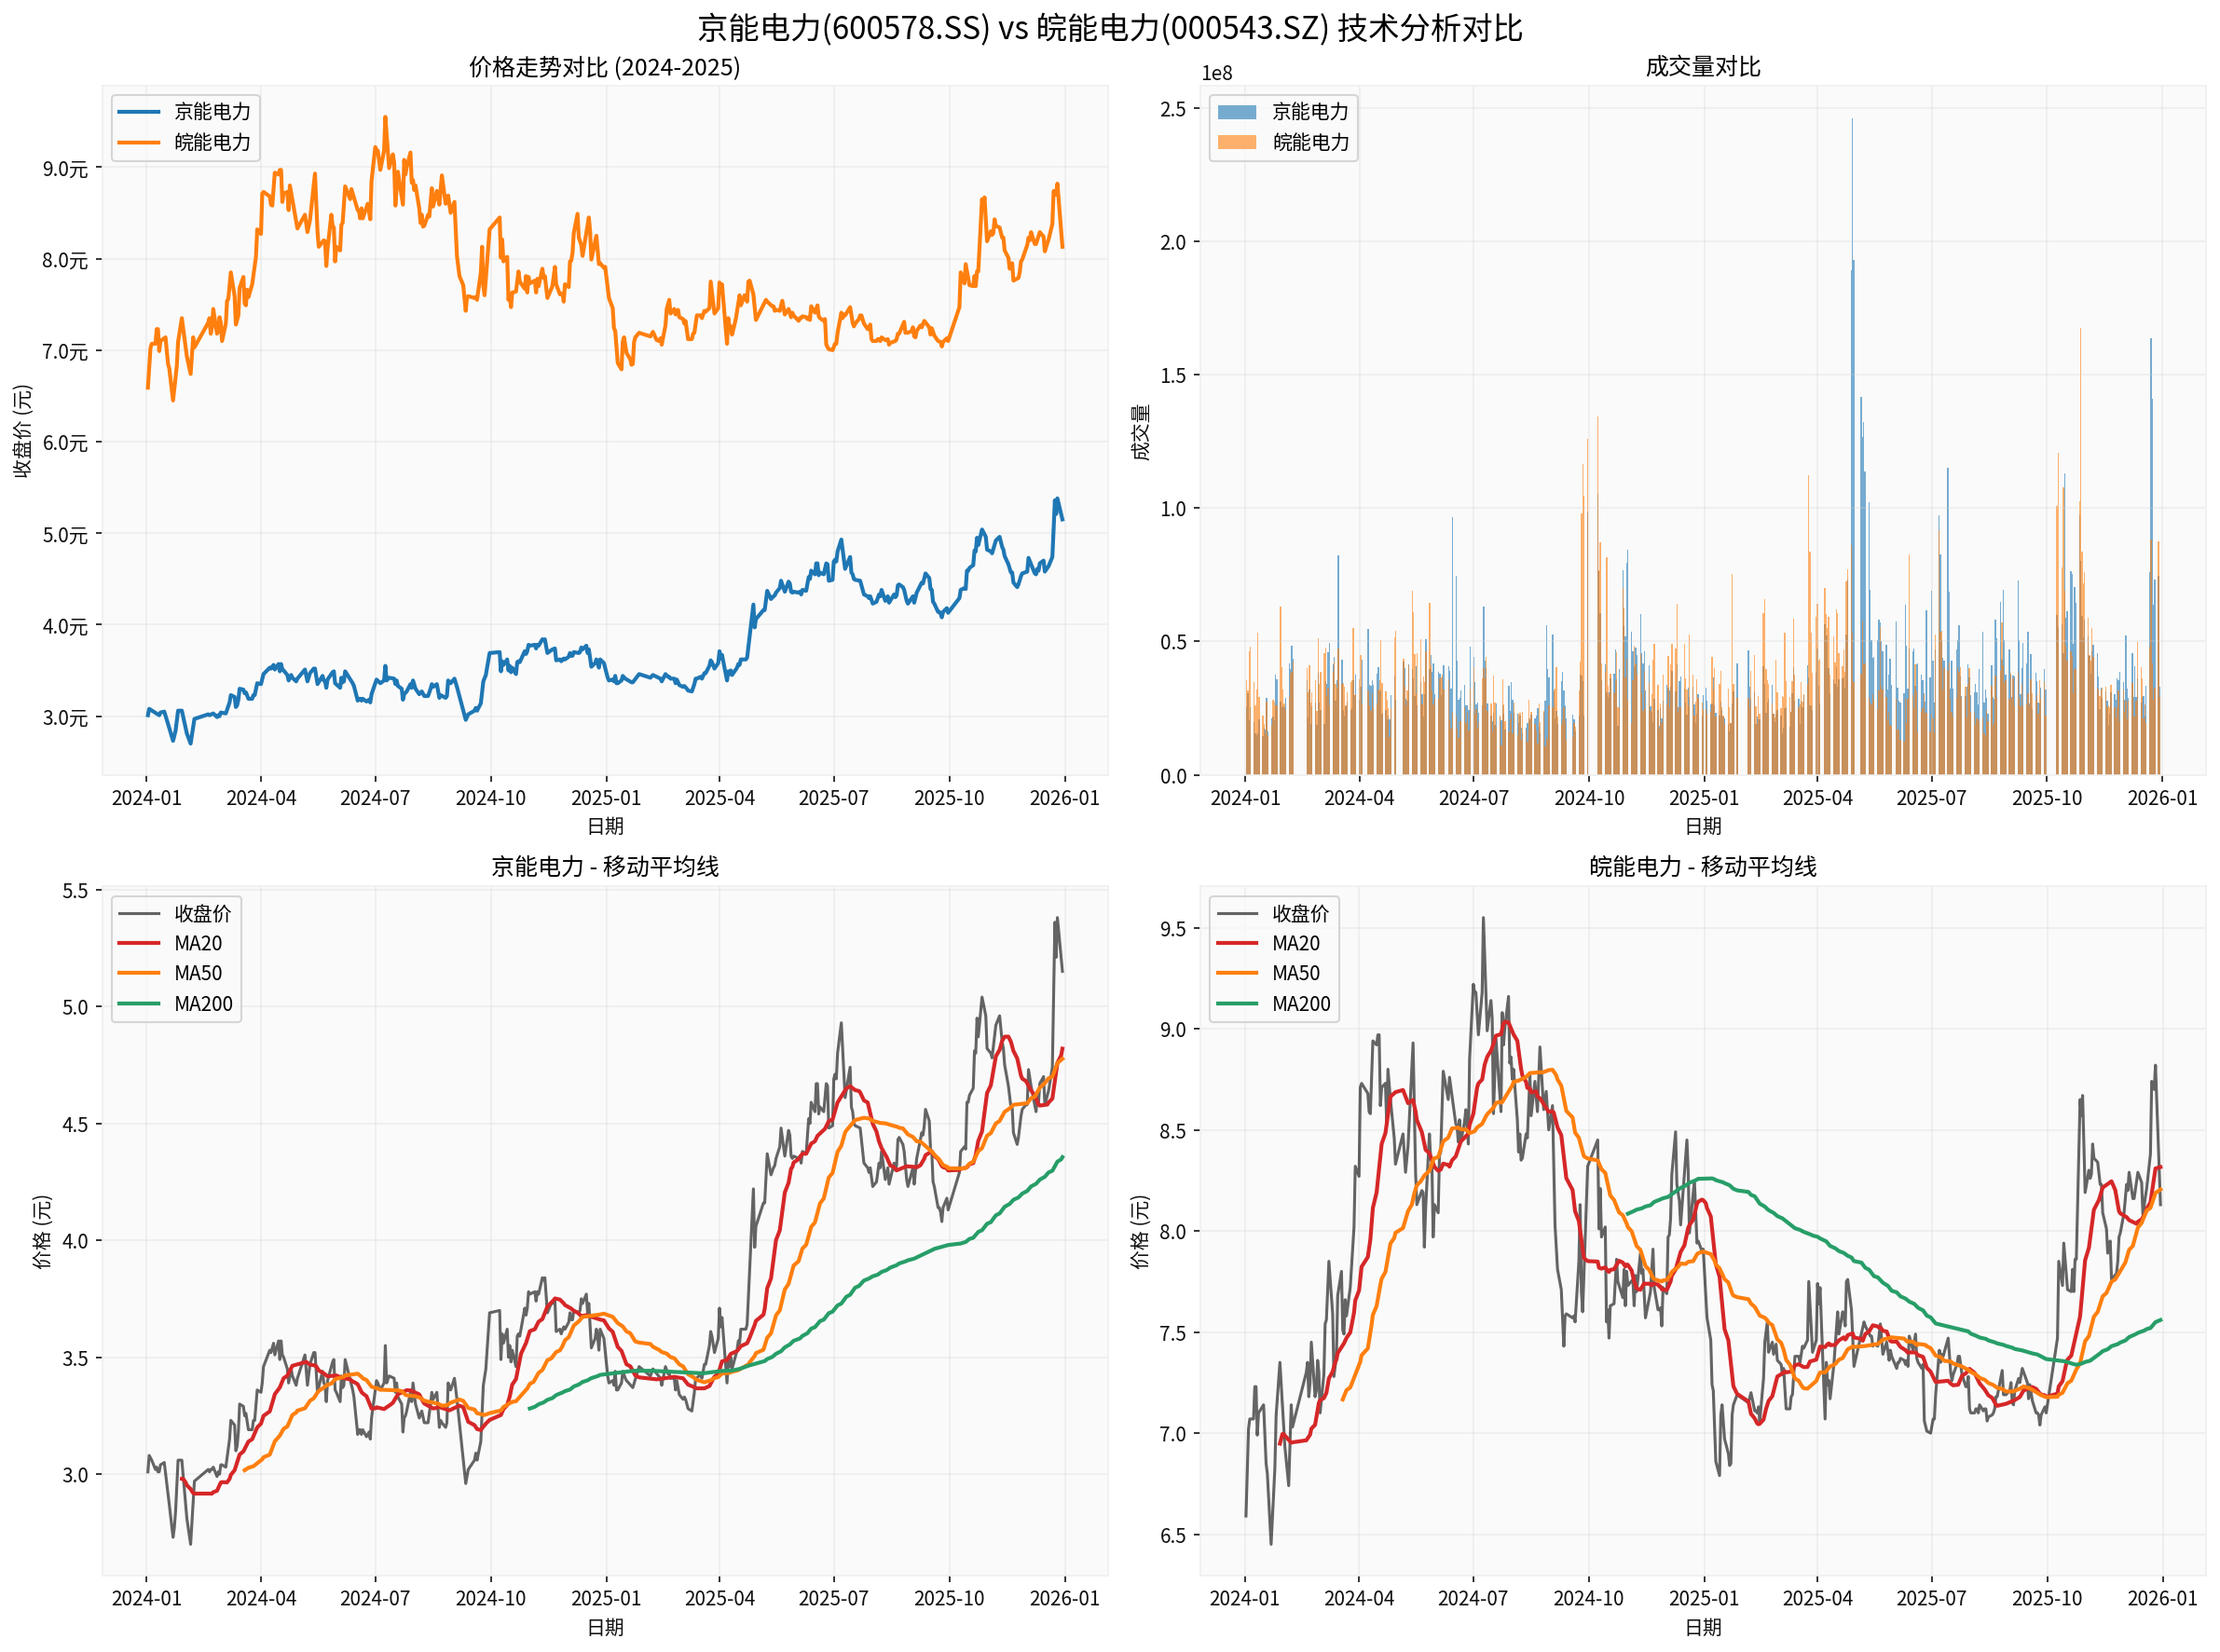
Chart Notes (Based on Data from January 1, 2024 to December 30, 2025) [0]:
- Top Left: Price Trend Comparison (Beijing Energy Int’l has higher annual growth and greater elasticity; Anhui Energy Group is more defensive).
- Top Right: Volume Comparison (shows activity differences).
- Bottom: MA20/MA50/MA200 Multi-cycle Moving Averages (both stocks’ current prices are close to or slightly below MA20, with short-term pressure and mid-term upward trend maintained).
- Financial Attitude: Both are evaluated as “conservative (high depreciation/capital expenditure ratio)”, and the investment cycle and depreciation affect the rhythm of profit release [0].
- Debt Risk: Both are evaluated as having “high debt risk”, requiring attention to debt repayment rhythm and cash flow stability [0].
- Profit Quality:
- Beijing Energy Int’l: Net profit margin ~9.51%, ROE ~12.63% [0].
- Anhui Energy Group: Net profit margin ~8.14%, ROE ~14.63% [0].
- Liquidity: Current Ratio is low for both (Beijing Energy Int’l ~0.54, Anhui Energy Group ~0.62), indicating short-term debt repayment pressure and dependence on rolling financing/operation management [0].
- Medium and Long-term Strategies (Adapted to 2026 Transaction Environment):
- Reduce long-term contract ratio and retain about 60% guaranteed base electricity; participate in the rest through monthly bidding, spot, and ancillary services.
- Promote flexibility transformation and intelligent quotation/transaction systems to cope with peak-valley price spreads and fluctuations.
- Layout new energy and energy storage to smooth the comprehensive cost curve and carbon emission intensity (specific proportion not public).
- Verification Indicators Investors Need to Track:
- Capacity/ancillary service revenue and proportion, marginal generation cost and spot settlement price, peak-valley price spread and settlement structure, split disclosure of long-term contracts and spot/monthly bidding (if disclosed).
- Regional electricity price policies and renewable penetration rates, market-oriented transaction rules (such as peak-valley time division and price limit range).
- Beijing Energy Int’l: MA20≈4.82, MA50≈4.78, MA200≈4.36; current price is near MA20, with short-term pressure but mid-term still in uptrend channel; high annual elasticity but high volatility [0].
- Anhui Energy Group: MA20≈8.32, MA50≈8.21, MA200≈7.56; current price is slightly below MA20, mid-term trend is stable, with more prominent dividend attributes and valuation cost-performance ratio [0].
- Diversified Revenue Structure: The proportion of electricity revenue decreases, while capacity/ancillary services and peak-shaving value increase; pricing shifts from “fixed per kWh” to “marginal capacity/peak-valley time period”.
- Valuation Logic Adjustment: More focus on “system value + flexibility cost” instead of单纯 “utilization hours and long-term contract electricity price”.
- Regional Differentiation: Regions with high renewable penetration and deep marketization have more obvious peak-valley price spreads and peak-shaving opportunities; policy differences will bring regional valuation premiums or discounts.
- Opportunities:
- Leading thermal power companies with flexibility transformation, regional dispatch advantages, and transaction strategy capabilities.
- Integrated energy service providers with “thermal power + energy storage + green power” are expected to enhance system value and cash flow resilience.
- Risks:
- Policy and rule adjustments (such as peak-valley time periods, price limit boundaries, capacity/ancillary service compensation mechanisms).
- Uncertainties in settlement caused by coal price and fuel cost fluctuations, extreme weather, and renewable output fluctuations.
- High debt and refinancing pressure (both companies prompt high debt risk) [0].
- Defensive/Dividend Type: Prioritize targets with safer valuations, stable cash flow, and friendly regional policies (such as Anhui Energy Group).
- Aggressive/Elastic Type: Focus on targets with “system value and transaction advantages” in peak-shaving and spot markets in the medium and long term, with greater profit recovery and performance elasticity (such as Beijing Energy Int’l), but need to bear higher volatility.
- This analysis uses “2026 transaction data” as a scenario assumption (Guangdong annual contract and threshold adjustment) and cites market prices and financial data as of December 30, 2025 as cross-period references for asset quality and valuation; the two cannot be directly equated.
- Key quantitative indicators such as specific proportions of long-term contracts/monthly bidding/spot, proportion of peak-shaving and capacity/ancillary service revenue, and peak-valley price spreads are subject to company announcements and exchange disclosures; no speculation is made on parts without data in the text.
- Changes in policies, rules, and fuel costs may significantly affect profits and valuations.
[0] Gilin API Data - Stock prices, trading volume, financial indicators, and financial analysis (Beijing Energy Int’l 600578.SS, Anhui Energy Group 000543.SZ), data time covers January 1, 2024 to December 30, 2025.
Insights are generated using AI models and historical data for informational purposes only. They do not constitute investment advice or recommendations. Past performance is not indicative of future results.
About us: Ginlix AI is the AI Investment Copilot powered by real data, bridging advanced AI with professional financial databases to provide verifiable, truth-based answers. Please use the chat box below to ask any financial question.