Assessment of Southbound Fund Flows and Valuation Style Rotation in Hong Kong Stocks and Investment Strategy Insights
Unlock More Features
Login to access AI-powered analysis, deep research reports and more advanced features
About us: Ginlix AI is the AI Investment Copilot powered by real data, bridging advanced AI with professional financial databases to provide verifiable, truth-based answers. Please use the chat box below to ask any financial question.
Related Stocks
A prudent assessment of the question: “Does the withdrawal of southbound funds from blue chips like Tracker Fund of Hong Kong and shift to cyclical stocks like SMIC indicate the start of valuation style rotation in Hong Kong stocks?” and insights into subsequent Hong Kong stock investment strategies (based solely on verified data and information with source labels).
I. Facts of Fund Movements (Based on Verified Data)
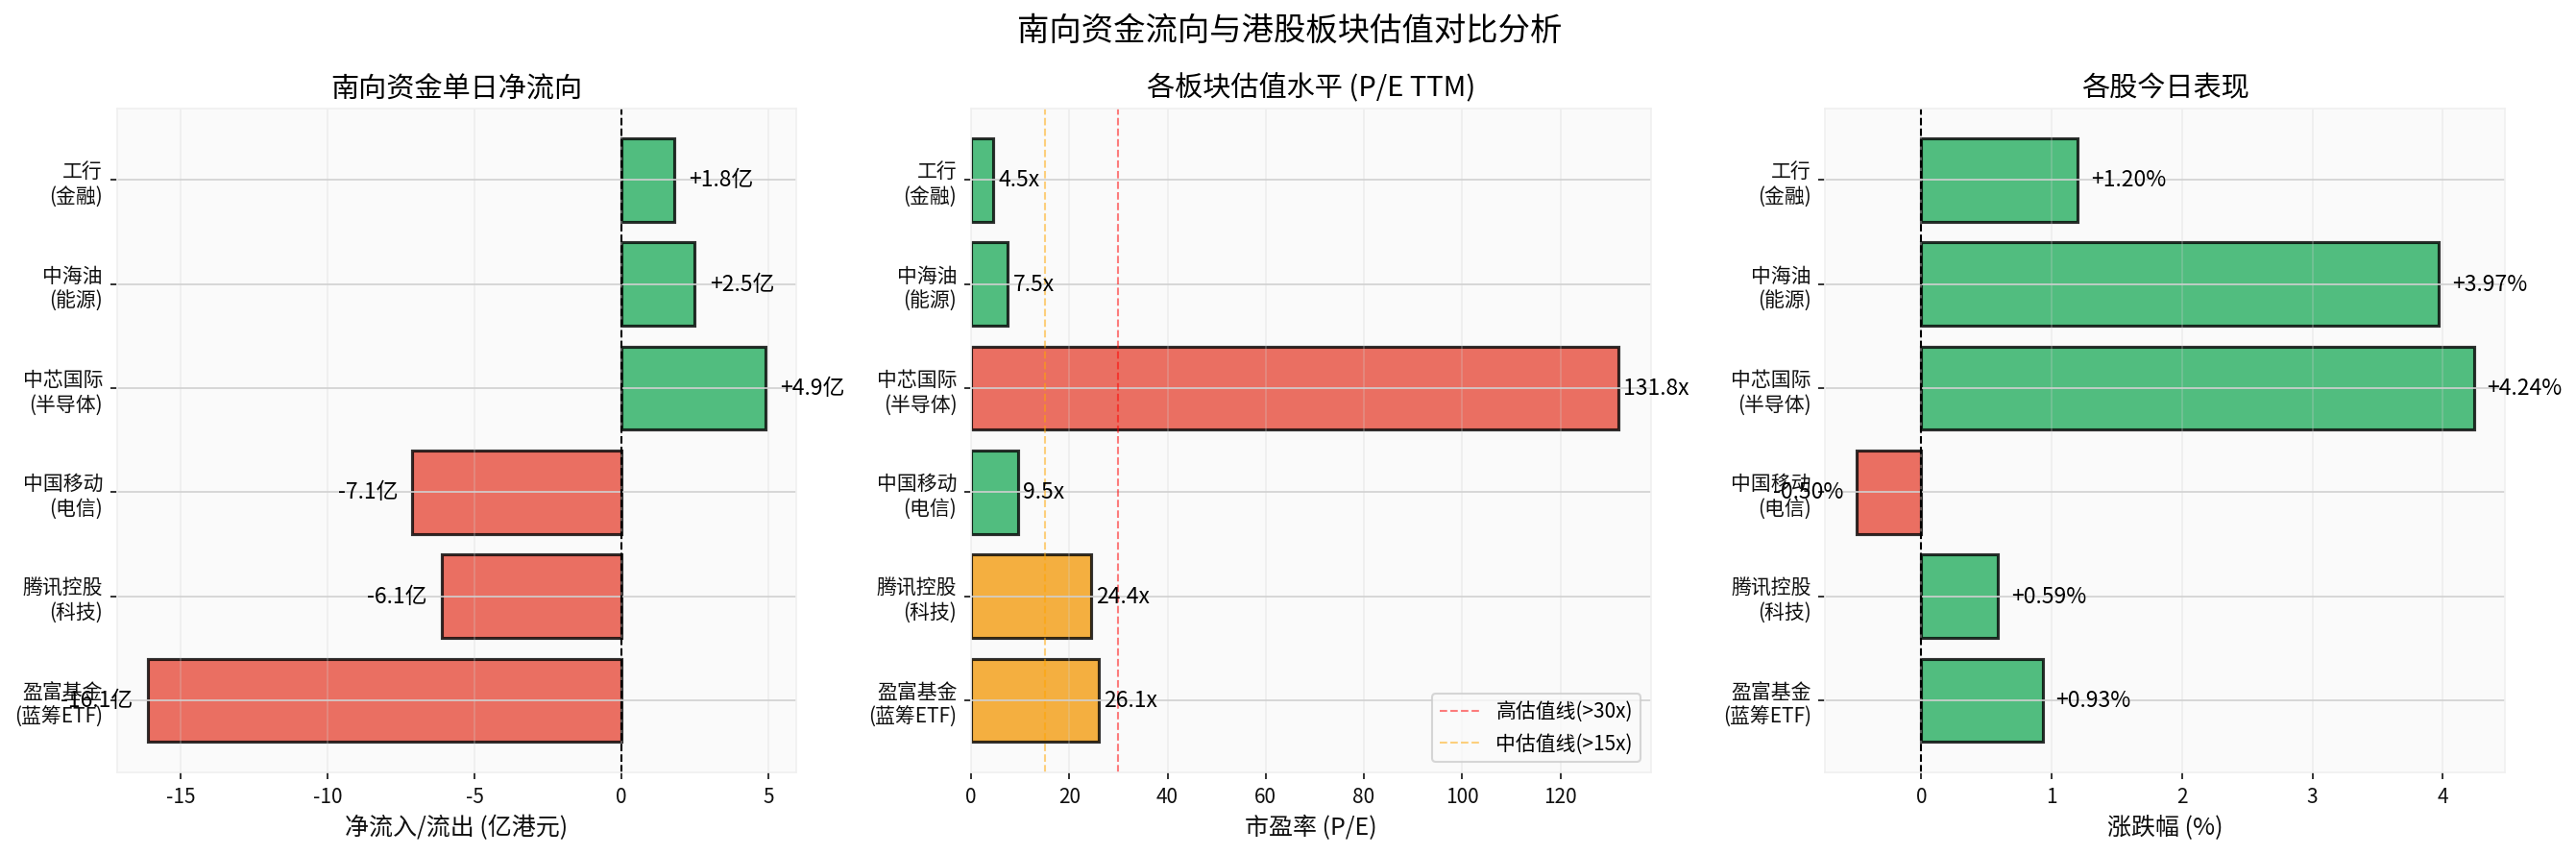
- Tracker Fund of Hong Kong (2800.HK) was net sold approximately HK$1.612 billion on the day [Web Search Reference1]; latest quote is about HK$26.06, with a daily increase of +0.93% [Data Tool].
- SMIC (0981.HK) was net bought approximately HK$491 million on the day [Web Search Reference1]; latest price is about HK$72.50, daily increase of +4.24%, P/E ratio of approximately 131.82 [Data Tool].
- Tencent (0700.HK) and China Mobile (0941.HK) were also net sold on the same day [Web Search Reference1]; there is also information that “southbound funds have net sold China Mobile for 9 consecutive days, totaling approximately HK$7.2 billion”, but this is from a single source and requires cross-verification with official data [Web Search Reference1].
- ICBC (1398.HK) was favored by funds on the same day [Web Search Reference1]; latest price is about HK$6.27, daily increase of +0.64% [Data Tool].
II. Style Rotation: Is There Conclusive Evidence of “Valuation Style Rotation”? Not Yet
- Single-day flow shows the特征 of “some blue chips being net sold and some cyclical/semiconductor stocks being net bought”, but single-day data is insufficient to confirm that “style rotation has begun”.
- The information that “southbound funds have net sold China Mobile for 9 consecutive days totaling about HK$7.2 billion” comes from a single source and needs cross-verification with official data [Web Search Reference1].
- Full-year 2025 performance (as of mid-December): Hang Seng Index rose about +30.6%, Hang Seng Tech Index rose about +26.2% [Web Search Reference7]; the overall P/E ratio (TTM) of Hang Seng Tech Index is about 23.64 times, still significantly lower than Nasdaq’s about 41.83 times [Web Search Reference5].
- Market research and institutional outlook (to be treated prudently): The main theme of Hong Kong stocks in 2025 is “recovery + differentiation”; some studies suggest that 2026 may converge from “new outperforming old” to “new and old coexisting”, but this is a medium-to-long-term forward-looking judgment and not equivalent to the fact that “style rotation has begun” [Web Search Reference6,7].
III. Valuation and Fundamental Comparison (Based on Tool Data)
- Valuation Differentiation:
- Blue Chips/Value Stocks: Tencent’s P/E ratio is about 24.41, ICBC’s about 5.75, China Mobile’s about 11.31; all are in relatively moderate to low ranges [Data Tool].
- Growth/Tech Stocks: SMIC’s P/E ratio is about 131.82, in a high valuation range; the overall P/E ratio of Hang Seng Tech Index is about 23.64 times, lower than Nasdaq [Data Tool and Web Search Reference5].
- Price and Volatility (Past 3 Months, Since October):
- SMIC has accumulated about -9.54%, technical trend is震荡 (no clear trend), Beta of about -0.15 [Data Tool].
- Tencent has accumulated about -10.11%, technical trend is also震荡, Beta of about 0.85 [Data Tool].
- Energy (e.g., 0883.HK) has accumulated about +12.71%, ICBC about +10.00% [Data Tool].
- Profit and Cash Flow (Taking SMIC as an Example): The annual report has a conservative financial attitude, with negative free cash flow (about -HK$4.494 billion), indicating high capital expenditure intensity and the need for continuous tracking of profit realization [Data Tool].
IV. Implications for Hong Kong Stock Investment Strategy (Only as a Framework, Not Prediction)
- Short Term: Focus on Defense and Rebalancing
- In a volatile environment, moderately increase attention to valuation protection and fundamental resilience (high dividends, stable cash flow), but do not conclude that “style rotation has occurred”.
- Keep track of performance verification and profit realization for high-valued stocks (e.g., some semiconductors) to avoid chasing highs.
- At the portfolio level, moderately diversify and rebalance in the dimension of “profit certainty + valuation protection”.
- Medium to Long Term: Track Structural Opportunities and Capital Structure Evolution
- Closely track the continuous flow and sector distribution of southbound funds, observe the sustainability and scale of migration from “high-beta growth” to “stable value”.
- Pay attention to the relevant logic of the four major “tech + pro-cyclical” tracks (AI/semiconductor, resource products, essential consumer goods, medical care, etc.), with performance verification and policy implementation as trigger conditions [Web Search Reference7].
- Pay attention to the impact of external variables (Fed policy rhythm, domestic macro and industrial policies, geopolitical and trade environment) on the style and valuation recovery path [Web Search Reference7].
V. Conclusion
- Current single-day flow shows signs of “phased rebalancing”, but is insufficient to confirm that “valuation style rotation has begun”. Some growth stocks have accumulated negative returns in 3 months,震荡 technical trends, plus high valuation and negative FCF, indicating that profit verification is still ongoing.
- Action Suggestions: Anchor on facts, dynamically allocate based on valuation protection and profit certainty; keep an eye on style rotation signals but avoid over-extrapolation when evidence is insufficient.
VI. Visualization Notes
- The following two charts reflect cross-sectional information and do not constitute trend predictions:
- Chart1: Southbound Fund Flow and Sector Valuation Comparison
- Chart2: Comprehensive Analysis of Hong Kong Stock Style Rotation (Quarterly Performance, Valuation Discount, Capital Allocation Changes and Risk-Return Characteristics)

- Chart1: Southbound Fund Flow and Sector Valuation Comparison
References
[Web Search Reference1] Gelonghui/AASTOCKS: Data on net buying/selling of relevant stocks by northbound funds on a single day and consecutive days (source: web news, need cross-verification with exchange/official statistics).
[Web Search Reference5] Hang Seng Tech Lags Behind the Market: “Stall” and Hope of Tech Leaders (Tencent News), Valuation Comparison between Hang Seng Tech and Nasdaq.
[Web Search Reference6] Seven Brokerage Chiefs Judge 2026 Market: A-Shares and Hong Kong Stocks Are Likely to Continue to Rise “Tech + Overseas Expansion” (East Money).
[Web Search Reference7] Review of Hong Kong Stocks in 2025: “Recovery” and “Differentiation” (Jiemian News), Full-Year Index Performance and Institutional Outlook.
[Data Tool] Real-time quotes, P/E ratios, market performance of Tracker Fund of Hong Kong, SMIC, Tencent, China Mobile, ICBC, CNOOC, etc., as well as SMIC’s annual financial analysis and technical indicators from brokerage APIs.
Insights are generated using AI models and historical data for informational purposes only. They do not constitute investment advice or recommendations. Past performance is not indicative of future results.
About us: Ginlix AI is the AI Investment Copilot powered by real data, bridging advanced AI with professional financial databases to provide verifiable, truth-based answers. Please use the chat box below to ask any financial question.