Haixin Food (002702.SZ) Operating Fundamentals and Valuation Analysis Report
Unlock More Features
Login to access AI-powered analysis, deep research reports and more advanced features
About us: Ginlix AI is the AI Investment Copilot powered by real data, bridging advanced AI with professional financial databases to provide verifiable, truth-based answers. Please use the chat box below to ask any financial question.
Related Stocks
Now let’s provide a detailed analysis of Haixin Food’s operating fundamentals and valuation level for you.
According to online search information, Haixin Food has indeed experienced two significant abnormal fluctuations recently [1][2]:
- Time: December 1 and December 2, 2025
- Situation: The cumulative deviation of closing price increases exceeded 20% over 2 consecutive trading days
- Company Response: No corrections needed for previously disclosed information; no major undisclosed information found; operating conditions are normal; controlling shareholders have no undisclosed matters that should be disclosed [1]
- Time: December 26, December 29, and December 30, 2025
- Situation: The cumulative deviation of closing price declines exceeded 20% over 3 consecutive trading days
- Company Response: Operating conditions are normal, and no major changes have occurred in internal and external operating environments [2]
The company’s board of directors specially reminds investors that
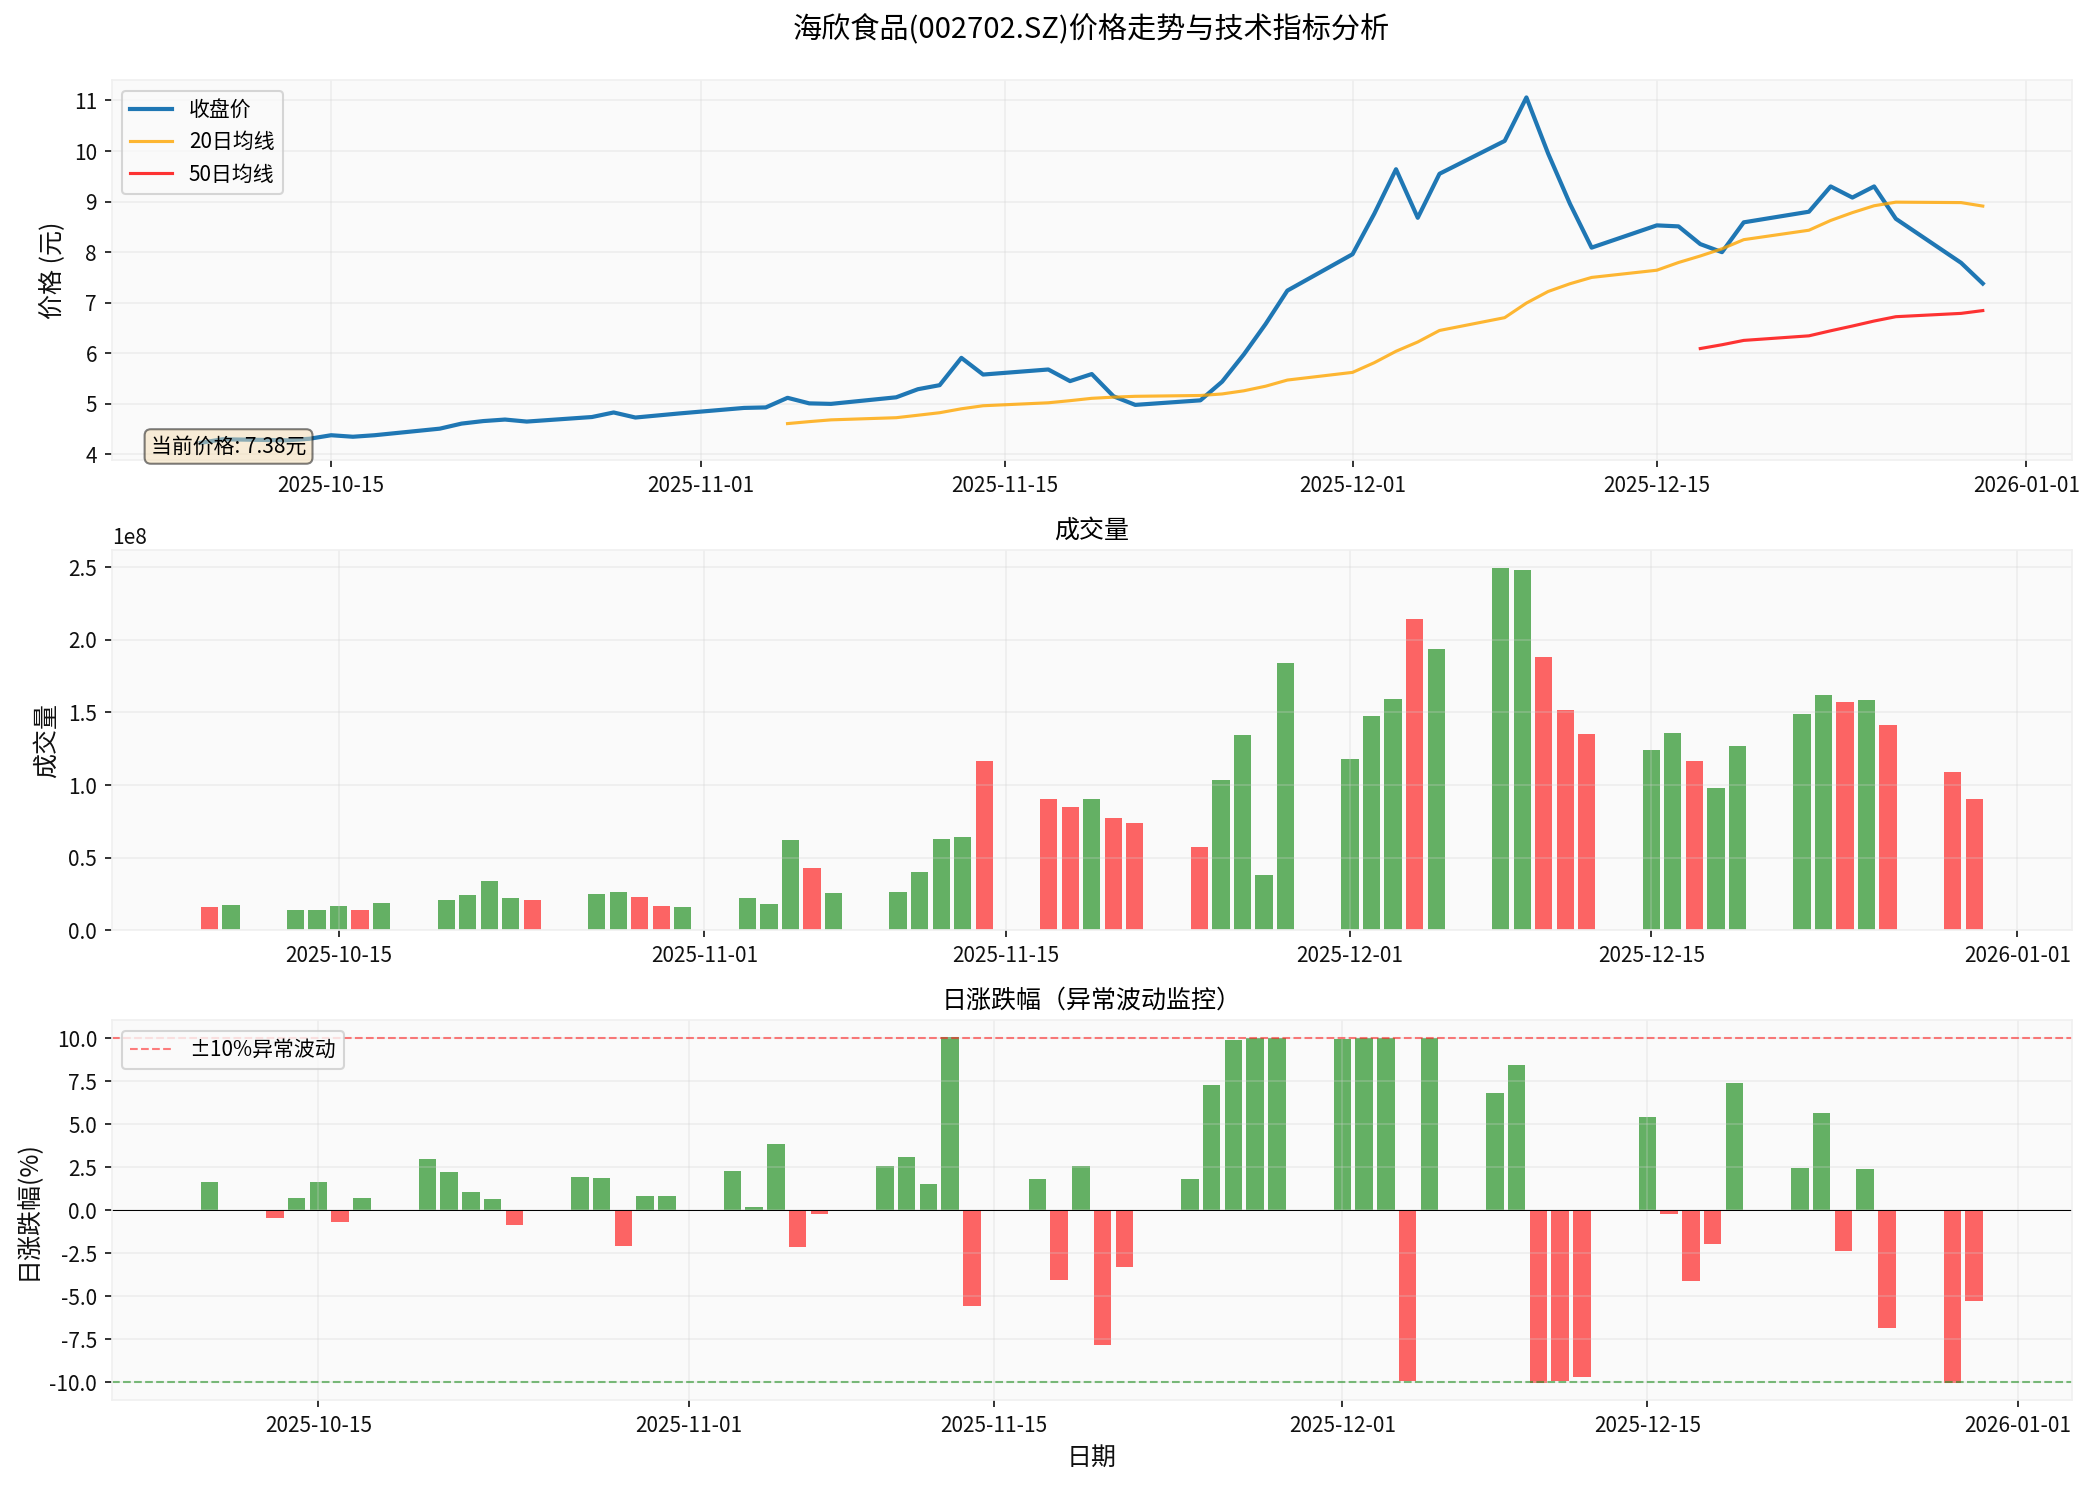
Chart shows: Haixin Food’s price trend over the past 3 months (October 9 to December 30), with a cumulative increase of 74.47%, a daily volatility of up to 5.68%, and 8 days with a single-day price change exceeding 10% [0]
Based on the latest trading data [0], Haixin Food shows typical
| Time Period | Price Change | Current Price |
|---|---|---|
| 1 Day | -5.26% | $7.38 |
| 5 Days | -16.23% | - |
| 1 Month | +1.93% | - |
| 3 Months | +72.83% | - |
| 6 Months | +76.56% | - |
| YTD | +55.70% | - |
- Period High Price: 11.22 yuan (December 9), 52% higher than current price
- Period Low Price: 4.17 yuan (October 13), a 169% drop from the high price
- Daily Average Trading Volume: 0.87 billion shares, significantly increased
- Single-day price change >10%: 8 days, indicating extreme volatility
According to financial data analysis [0], Haixin Food’s profitability is worrying:
| Profitability Indicator | Value | Evaluation |
|---|---|---|
Net Profit Margin |
-2.69% | Loss status |
Operating Profit Margin |
-2.00% | Core business loss |
ROE (Return on Equity) |
-3.88% | Negative value, eroding shareholder value |
2025 Q3 EPS |
$-0.01 | Loss per share |
2025 Q3 Operating Revenue |
$360.48M | YoY decrease |
| Valuation Indicator | Value | Analysis |
|---|---|---|
P/E (Price-to-Earnings Ratio) |
-98.13x | Negative value , company is in loss, cannot be valued normally |
P/B (Price-to-Book Ratio) |
3.87x | Significantly higher than the industry’s normal level |
P/S (Price-to-Sales Ratio) |
2.67x | Relatively reasonable |
Market Capitalization |
$4.09B (approx. 28 billion RMB) | Moderate market cap size |
EV/OCF |
130.93x | High ratio of enterprise value to operating cash flow |
- Negative P/E indicates the company has sustained losses, making the traditional P/E valuation method invalid
- P/B ratio of 3.87x is far higher than the usual 1-2x level in the food packaging industry
- With negative profits, the current market cap is mainly supported by future expectations, lacking fundamental support
| Financial Indicator | Value | Evaluation |
|---|---|---|
Current Ratio |
1.27 | Acceptable, short-term solvency is average |
Quick Ratio |
0.43 | Low, high proportion of inventory in current assets |
Debt Risk Rating |
Low Risk | Debt risk is controllable |
Financial Attitude Rating |
Neutral | Balanced accounting policies |
According to cash flow analysis [0], the company’s free cash flow is negative (approx. -39.23 million yuan), indicating that the company’s
Three-scenario valuation based on Discounted Cash Flow (DCF) model [0]:
| Scenario | Intrinsic Value | vs Current Price $7.38 | Key Assumptions |
|---|---|---|---|
Conservative Scenario |
$6.41 | -13.1% |
0% revenue growth, EBITDA margin of 4.8% |
Base Scenario |
$8.43 | +14.2% |
1.5% revenue growth, EBITDA margin of 5.0% |
Optimistic Scenario |
$14.61 | +98.0% |
4.5% revenue growth, EBITDA margin of 5.3% |
- Current price of $7.38 is 8.3% lower than the base scenario valuation
- But close to the conservative scenario valuationof $6.41, only 15% higher
- Probability-weighted value: $9.82 (+33.0% upside potential)
- Revenue CAGR: Only 1.5% (slow growth)
- EBITDA margin: 5.0% (low level)
- Net profit margin: 0.8% (slight profit)
- Capital expenditure as % of revenue: 10.6% (high)
- Cost of equity: 7.9%
- Cost of debt: 3.2%
- WACC:7.4%
- Beta:0.48 (low volatility, contrasting with high actual volatility)
##5. Technical Analysis
According to technical analysis report [0]:
| Technical Indicator | Value | Signal |
|---|---|---|
Trend Status |
Sideways | No clear trend |
MACD |
No crossover | Bearish |
KDJ |
K:25.8, D:38.6, J:0.1 | Bearish |
RSI(14) |
Oversold opportunity | - |
Support Level |
$6.98 | - |
Resistance Level |
$8.91 | - |
##6. Comprehensive Risk Assessment and Investment Recommendations
###1. Core Risk Warnings
| Risk Category | Specific Performance | Severity |
|---|---|---|
Fundamental Risk |
Sustained losses, negative net profit margin, negative ROE | ⚠️ High |
Valuation Risk |
P/B ratio of3.87x is too high, negative P/E makes valuation impossible | ⚠️ High |
Volatility Risk |
Daily volatility of5.68%,8 days with single-day change >10% | ⚠️ High |
Liquidity Risk |
Daily average trading volume of0.87 billion shares, liquidity is acceptable | ⚡ Medium |
Speculation Risk |
Company clearly warns of “overheated market sentiment and irrational speculation” | ⚠️ High |
###2. Investment Value Assessment
- Company has sustained losses, with serious lack of profitability
- P/B valuation is significantly high, lacking fundamental support
- Recent stock price rise is mainly driven by sentiment speculation, not fundamental improvement
- 76.55% increase over3 months is completely divorced from the company’s fundamentals
- DCF base scenario valuation of$8.43 is higher than current price of$7.38 (+14.2%)
- Debt risk rating is “Low Risk”
- Neutral financial attitude, prudent accounting policies
- Short-term technicals are in oversold state
###3. Investment Recommendations
| Investor Type | Recommendation | Reason |
|---|---|---|
Value Investors |
Avoid |
Company is in loss, overvalued, does not meet value investment standards |
Growth Investors |
Cautious Watch |
Slow revenue growth (1.5% CAGR), lacks growth support |
Short-term Traders |
Extremely High Risk |
Extreme volatility, speculative market with poor risk-reward ratio |
Long-term Holders |
Wait for Fundamental Improvement |
Need to see clear signs of company turning losses into profits |
Haixin Food’s current stock price rise lacks fundamental support and is mainly driven by market sentiment and speculative funds. Although the company clarifies that no major changes have occurred in its operating environment [1][2], its operating fundamentals remain weak—sustained losses, overvaluation, and lack of growth momentum.
- Short-term: Stock price may continue to fluctuate sharply, with technical support near $6.98
- Medium-term: Unless the company turns losses into profits, the stock price lacks sustained upward momentum
- Long-term: Investors should focus on fundamental indicators such as improvement in profitability and recovery of revenue growth
- Whether to turn losses into profits: Net profit margin turning positive is a key turning point
- Revenue growth: Needs to recover to over5% to have growth potential
- Valuation regression: P/B ratio dropping below2x to have a margin of safety
- Trading volume changes: Alert to capital withdrawal when volume shrinks after abnormal increase
Special Note: Given the company’s sustained losses and significantly high P/B ratio, the current stock price faces a high risk of correction. Investors should focus on whether the company can improve its profitability in the future, rather than chasing short-term speculative trends.
[0] Gilin API Data - Haixin Food (002702.SZ) Company Overview, Financial Data, Valuation Analysis, Technical Analysis
[1] Eastmoney - “Haixin Food: Abnormal Stock Trading Fluctuations” (December2,2025)
https://finance.eastmoney.com/a/202512023580443322.html
[2] Sohu Finance - “Haixin Food: Company’s Recent Operating Conditions Are Normal, No Major Changes in Internal and External Operating Environments” (December30,2025)
https://m.sohu.com/a/970943686_313745
Coforge收购Encora:维持增持评级的深度分析
Insights are generated using AI models and historical data for informational purposes only. They do not constitute investment advice or recommendations. Past performance is not indicative of future results.
About us: Ginlix AI is the AI Investment Copilot powered by real data, bridging advanced AI with professional financial databases to provide verifiable, truth-based answers. Please use the chat box below to ask any financial question.