Rebecca (600439) Investment Risk Analysis: 1,355 Days of Inventory Turnover Draws Attention
Unlock More Features
Login to access AI-powered analysis, deep research reports and more advanced features
About us: Ginlix AI is the AI Investment Copilot powered by real data, bridging advanced AI with professional financial databases to provide verifiable, truth-based answers. Please use the chat box below to ask any financial question.
Related Stocks
Based on the latest financial data and market information, despite Rebecca (600439.SS) having an export share of 75.5% and a 65% market share in the African market, the issue of its inventory turnover days reaching as high as
| Indicator | 2024 | 2023 | 2022 | 2021 | 2020 |
|---|---|---|---|---|---|
Inventory Turnover Days |
1,355 days | 1,366 days | 1,280 days | 1,070 days | 1,298 days |
Inventory Turnover Ratio |
0.27 | 0.27 | 0.29 | 0.34 | 0.28 |
Inventory Amount (100 million yuan) |
31.82 | 32.05 | 32.34 | 32.27 | 31.32 |
Inventory turnover days have exceeded
- Huge Capital Occupation: Inventory of 31.82 (100 million yuan) accounts for63.8%of total assets (49.89 billion yuan) and75.8%of current assets
- High Warehousing Costs: Long-term overstock leads to substantial warehousing, management, and insurance expenses
- Accumulated Impairment Risk: Wig products have fashion cycles, so long-term inventory faces significant impairment risk [0]
The company’s export share is as high as
- Exchange Rate Fluctuation Risk: RMB appreciation will directly erode export profits
- Trade Policy Risk: Tariff adjustments and trade barrier changes in African countries
- Geopolitical Risk: Changes in China-Africa trade relations and fluctuations in maritime transportation costs [0]
Although the market share in Africa reaches 65%, over-reliance on a single regional market has hidden dangers:
- Economic Stability Risk: Some African countries have large economic fluctuations and strict foreign exchange controls
- Increased Competition Risk: Other wig manufacturers may increase investment in the African market
- Purchasing Power Risk: African consumers’ purchasing power is affected by the global economy [0]
| Profitability Indicator | 2024 | 2023 | Trend |
|---|---|---|---|
Net Profit Margin |
-9.15% | 0.41% | Swung from profit to loss |
ROE |
-4.48% | 0.45% | Significant decline |
Gross Margin |
Continuously declining | - | Under obvious pressure |
The company swung from profit to loss in 2024, recording a net loss, and its profitability has deteriorated severely [0].
- Short-term Debt: 16.20 (100 million yuan), accounting for95%of total debt
- Current Ratio: 1.85, which is higher than 1 but has decreased significantly from 2.36 in 2021
- Quick Ratio: 0.35, with serious insufficient inventory liquidity [0]
Financial analysis shows the company adopts
- Need to make additional impairment provisions in the future
- Profit quality is questionable
- Real profitability is overestimated [0]
- Operating Cash Flow: Although positive, its quality is questionable (income quality is negative)
- Free Cash Flow: Has fluctuated greatly in recent years and was negative in 2022
- Dividend Pressure: Despite losses, maintains a certain dividend payout ratio (-92.9%) [0]
- Product Unsold: Wig styles are outdated and fail to keep up with demand changes in the African market
- Channel Issues: Sales network construction lags, and inventory cannot be effectively transmitted to the terminal
- Overcapacity: Past capacity expansion decisions have led to supply exceeding demand
- Extensive Inventory Management: Lack of refined inventory management and forecasting systems
| Risk Category | Risk Level | Explanation |
|---|---|---|
| Inventory Risk | 🔴 Extremely High | Turnover days over 3 years, serious capital occupation |
| Operational Risk | 🟠 High | Export dependency, single market concentration |
| Financial Risk | 🟠 High | Losses, short-term debt pressure |
| Valuation Risk | 🟡 Medium | Negative P/E, no reasonable valuation reference |
- Inventory Impairment Risk: May need to make large inventory write-down provisions in the future
- Liquidity Risk: Concentrated short-term debt, repayment pressure upon maturity
- Sustained Performance Deterioration Risk: Profit model is challenged
- Valuation Downward Risk: Market may further lower valuation expectations [0]
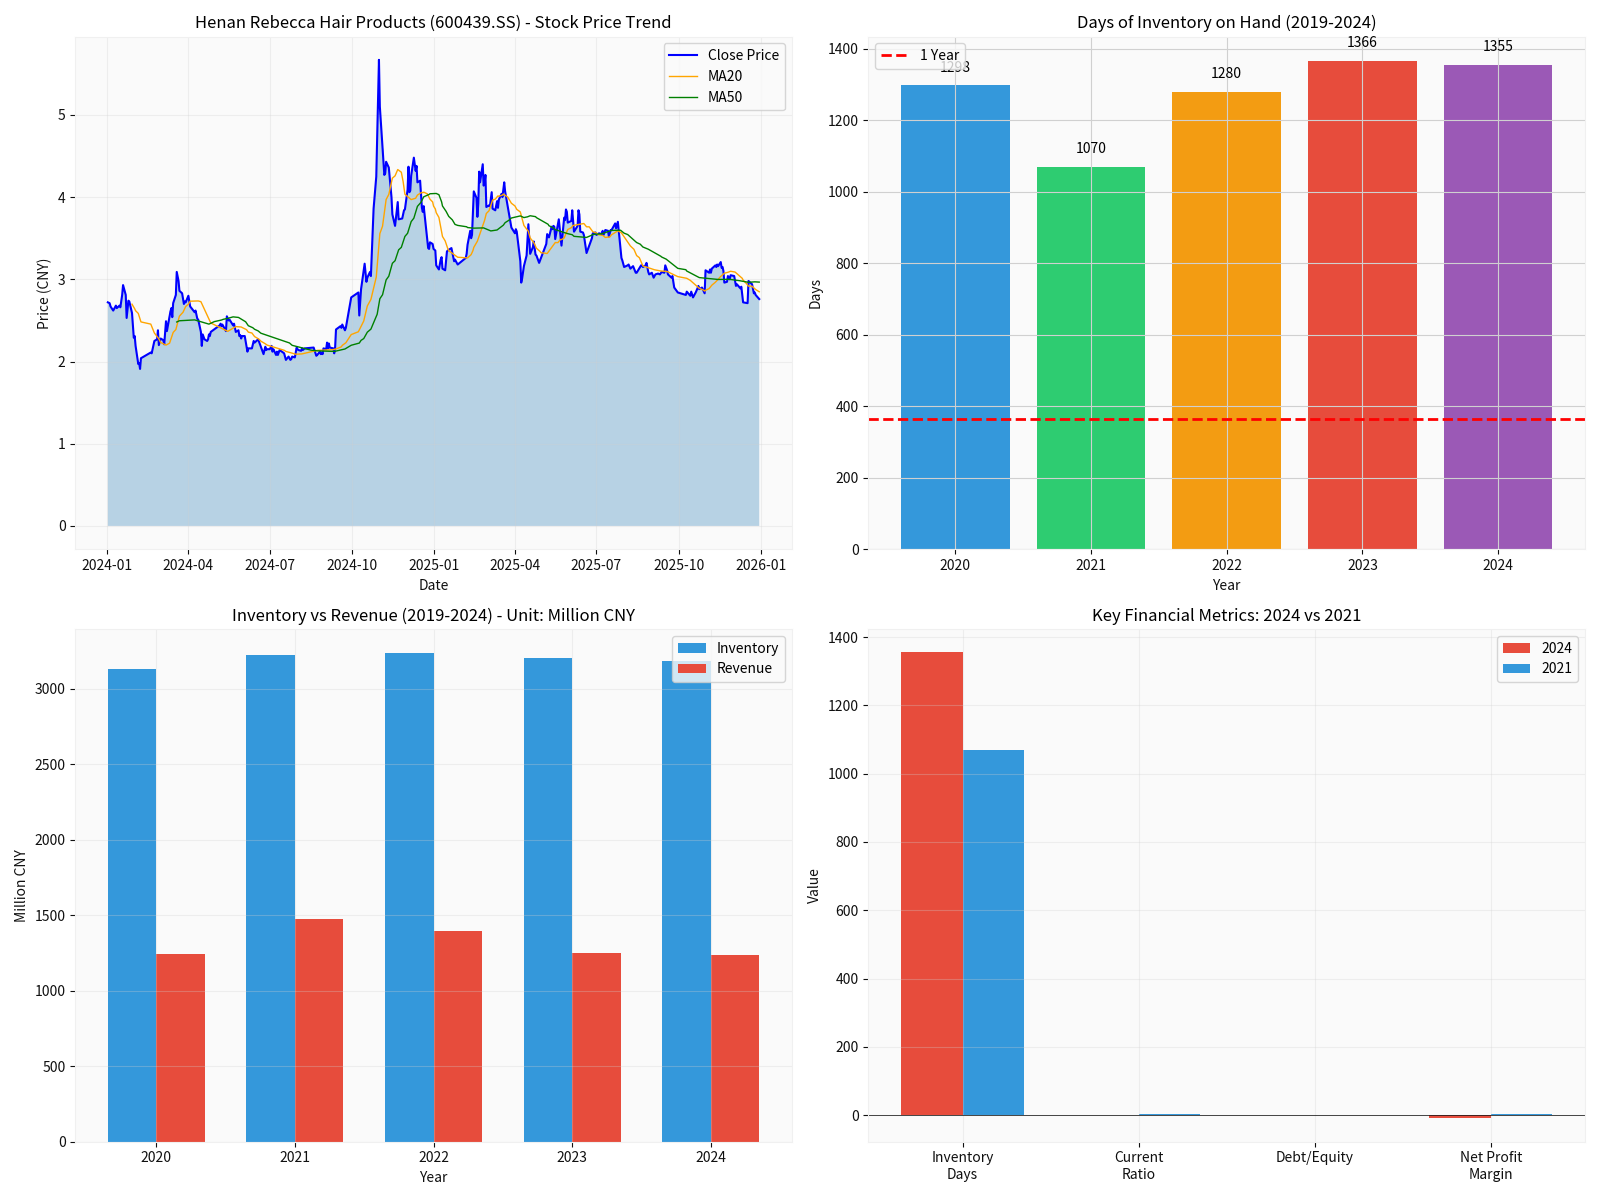
The chart above shows: 1) Sustained downward trend of stock price; 2) Long-term high inventory turnover days; 3) Inventory amount far exceeds revenue scale; 4) Deterioration of key financial indicators.
[0] Gilin AI Financial Database - Rebecca (600439.SS) Financial Statements and Key Indicator Analysis
美妆代运营企业自有品牌战略风险量化分析框架
Insights are generated using AI models and historical data for informational purposes only. They do not constitute investment advice or recommendations. Past performance is not indicative of future results.
About us: Ginlix AI is the AI Investment Copilot powered by real data, bridging advanced AI with professional financial databases to provide verifiable, truth-based answers. Please use the chat box below to ask any financial question.