Analysis of Investment Impacts of the Federal Reserve's Approximately $220 Billion Bond Purchase Plan Over the Next 12 Months
Unlock More Features
Login to access AI-powered analysis, deep research reports and more advanced features
About us: Ginlix AI is the AI Investment Copilot powered by real data, bridging advanced AI with professional financial databases to provide verifiable, truth-based answers. Please use the chat box below to ask any financial question.
Related Stocks
- Core Facts and Sources: According to Bloomberg reports, a Federal Reserve survey shows respondents expect reserve management bond purchases to exceed $200 billion over the next 12 months (stated as “more than $200 billion”) to ease money market pressures [1]. The same source also notes that the Federal Reserve decided to start purchasing approximately $40 billion of Treasury bills per month from December 12, 2025, to replenish reserves and lower short-term financing costs; the report indicates this pace may continue until at least April of the following year [2]. The WSJ also followed up with a report that the Federal Reserve will resume monthly securities purchases of approximately $40 billion and plans to slow the pace in 2026 [3].
- Policy Nature: This is an operation at the “reserve management” level, intended to replenish bank system reserves and stabilize short-term financing rate fluctuations, not a restart of traditional QE for macro easing to significantly lower long-term interest rates. Combining public information, in terms of scale, if executed at a pace of $40B/month over the next 12 months, it will roughly fall in the range of $400-480B; the actual execution pace and amount will be dynamically adjusted based on reserve and money market conditions, and search results show a possibility of slowing in 2026 [2][3].
- Mechanism: Increasing holdings of Treasury bills (T-bills, usually with remaining maturity within 1 year) will boost demand for short-term Treasury bonds, pushing short-term interest rates down and compressing Treasury bill spreads.
- Observable Signals (To Be Verified):
- Deviation and volatility of the Effective Federal Funds Rate (EFFR) and Secured Overnight Financing Rate (SOFR) at key points (month-end/quarter-end/tax period) (suggest comparing operation window with basis)
- Changes in ON RRP usage and overnight reverse repo rate (if ON RRP scale falls significantly, it is often interpreted as an auxiliary signal of ample system liquidity)
- Marginal narrowing of money market basis (e.g., SOFR vs. ONRRP spread, 1-month Treasury bill spread) (subject to market data)
- Term Spread Implication: Short-term pressure and limited long-term impact will lead to a marginal “steepening” tendency of the yield curve, but the magnitude depends on purchase pace, duration structure, and inflation expectations.
- Purchases are concentrated in the short end, with limited direct impact on 10-year and longer durations; long-term interest rates are more driven by fiscal deficits, inflation paths, and term premiums.
- Reference to Recent Market Data (Based on Broker API): TLT (20+ Year Treasury ETF) had a cumulative return of approximately -10.67% from January 2024 to December 31, 2025, with a daily volatility of approximately 0.83%; SHV (Short Duration Treasury ETF) had stable prices over the same period, with a cumulative return of approximately +0.02% and daily volatility of approximately 0.08%, and TLT’s volatility was about 10.38 times that of SHV [0]. The above phenomenon reflects higher volatility and performance differentiation of the long end relative to the short end, but it needs to be comprehensively judged in combination with macro and term premium factors.
- Search Results Prompt: The U.S. Treasury market showed strong performance overall in 2025 (benefiting from interest rate cut expectations and economic resilience), but some analyses are concerned that total bond market returns will cool down in 2026 [6]; at the same time, reports indicate that Treasury volatility has fallen annually [4], which needs to be comprehensively evaluated in combination with macro data and term structure changes [0].
- Shape Judgment: With purchases focusing on the short end, a “bear steepening” (long end under pressure from fiscal and inflation expectations, short end supported by policy) is more likely, but the magnitude and sustainability depend on purchase pace, fiscal supply rhythm, inflation path, and when the Federal Reserve slows purchases (WSJ hints at a possible slowdown in 2026) [3].
- Important Reminder: Public reports also show that historical yield curve inversions are related to subsequent economic cycles [5], but the current curve shape and future path still need to be based on real-time market data.
- Objectives and Effects: Injecting reserves into the banking system by increasing holdings of short-term Treasury bonds helps reduce volatility of short-term interest rates during seasonal pressure periods (month-end/quarter-end/tax period) (Bloomberg reports this measure is to ease upward pressure on short-term financing costs) [2]. Observable Signals (Subject to Market and Central Bank Disclosures):
- Reserve balances and seasonal volatility in the Federal Reserve’s H.4.1 statistics
- Deviation and volatility of money market rates at month-end/quarter-end (SOFR/BGCR/OIS, etc.)
- Marginal changes in commercial paper and Treasury bill spreads (e.g., CP-OIS or similar spreads)
- Collateral Expansion: Treasury bills as high-quality collateral have relatively stable supply; increasing holdings can enhance stability of the repo and re-collateralization markets, but system impact needs to be evaluated in combination with macro regulation and counterparty risk management.
- Market Transmission: Stability of the short-term financing market has potential supporting effects on credit expansion and corporate financing, but it needs to be based on changes in credit spreads and financing costs.
- Ample liquidity often reduces systemic risk premiums, which is marginally positive for risk assets; however, this plan is a “reserve management” operation, and its scale and pace are constrained by market conditions and expectations of slowing in 2026 [2][3], so the strength and sustainability of its transmission need to be observed.
- Bond Duration: The short end benefits from purchases (spread narrowing, interest rate decline), while the long end is disturbed by fiscal/inflation expectations; “barbell” allocation (short end + long end) can be considered to balance returns and volatility, but it needs to be judged in combination with macro and term premiums.
- Credit Bonds: Against the backdrop of improved liquidity, there is potential room for narrowing spreads of investment-grade and high-yield credit bonds, but fundamentals and industry supply and demand still need to be prioritized.
- Equities and Growth Stocks: If short-term interest rates decline and credit spreads narrow, valuations of high-duration growth stocks may benefit marginally, but they need to be comprehensively evaluated in combination with earnings and earnings expectations.
- Exchange Rates and Commodities: Decline in short-term interest rates may marginally suppress the U.S. dollar, benefiting hedge assets such as gold; but the actual impact depends on changes in global macro and interest rate expectations.
- Uncertainty in Policy Pace and Scale: Actual purchase pace and amount will be adjusted based on reserve and money market conditions, and reports mention the possibility of slowing in 2026 [2][3].
- Inflation and Interest Rate Path: If inflation and interest rate decline expectations fall short of expectations, the downward space for the short end is limited and the curve shape may be repriced.
- Fiscal Deficit and Supply: Changes in Treasury supply rhythm and term structure (e.g., proportion of long-term Treasury issuance) will significantly affect long-term interest rates and term premiums.
- Liquidity Illusion: This plan is a technical management operation and cannot fully replace systemic liquidity injection from macro easing; excessive extrapolation of its easing implications should be avoided.
- Track the following high-frequency indicators weekly (subject to market and central bank disclosures):
- Basis and cross-term spreads of Treasury futures (e.g., 2Y/10Y/30Y)
- Deviation between ONRRP and overnight rates (SOFR vs. EFFR/OIS spreads)
- Spread between 1-month and 3-month Treasury bills
- H.4.1 reserve and open market operation data
- On the allocation side, focus on short-duration Treasury bonds and investment-grade credit bonds, and appropriately introduce long-term Treasury bonds or ultra-long bonds (such as TLT, ZROZ, etc.) to capture potential steepening opportunities, but dynamically adjust in combination with macro and term premiums.
- Maintain sensitivity to fiscal policy, supply announcements, and Federal Reserve communications, and timely evaluate the rebalancing timing of duration and credit exposure.
- Charts: The chart below shows the price performance, cumulative returns, volatility comparison, and 52-week high/low points (including current price) of TLT (20+ Year Treasury ETF) and SHV (Short Duration Treasury ETF) since 2024.
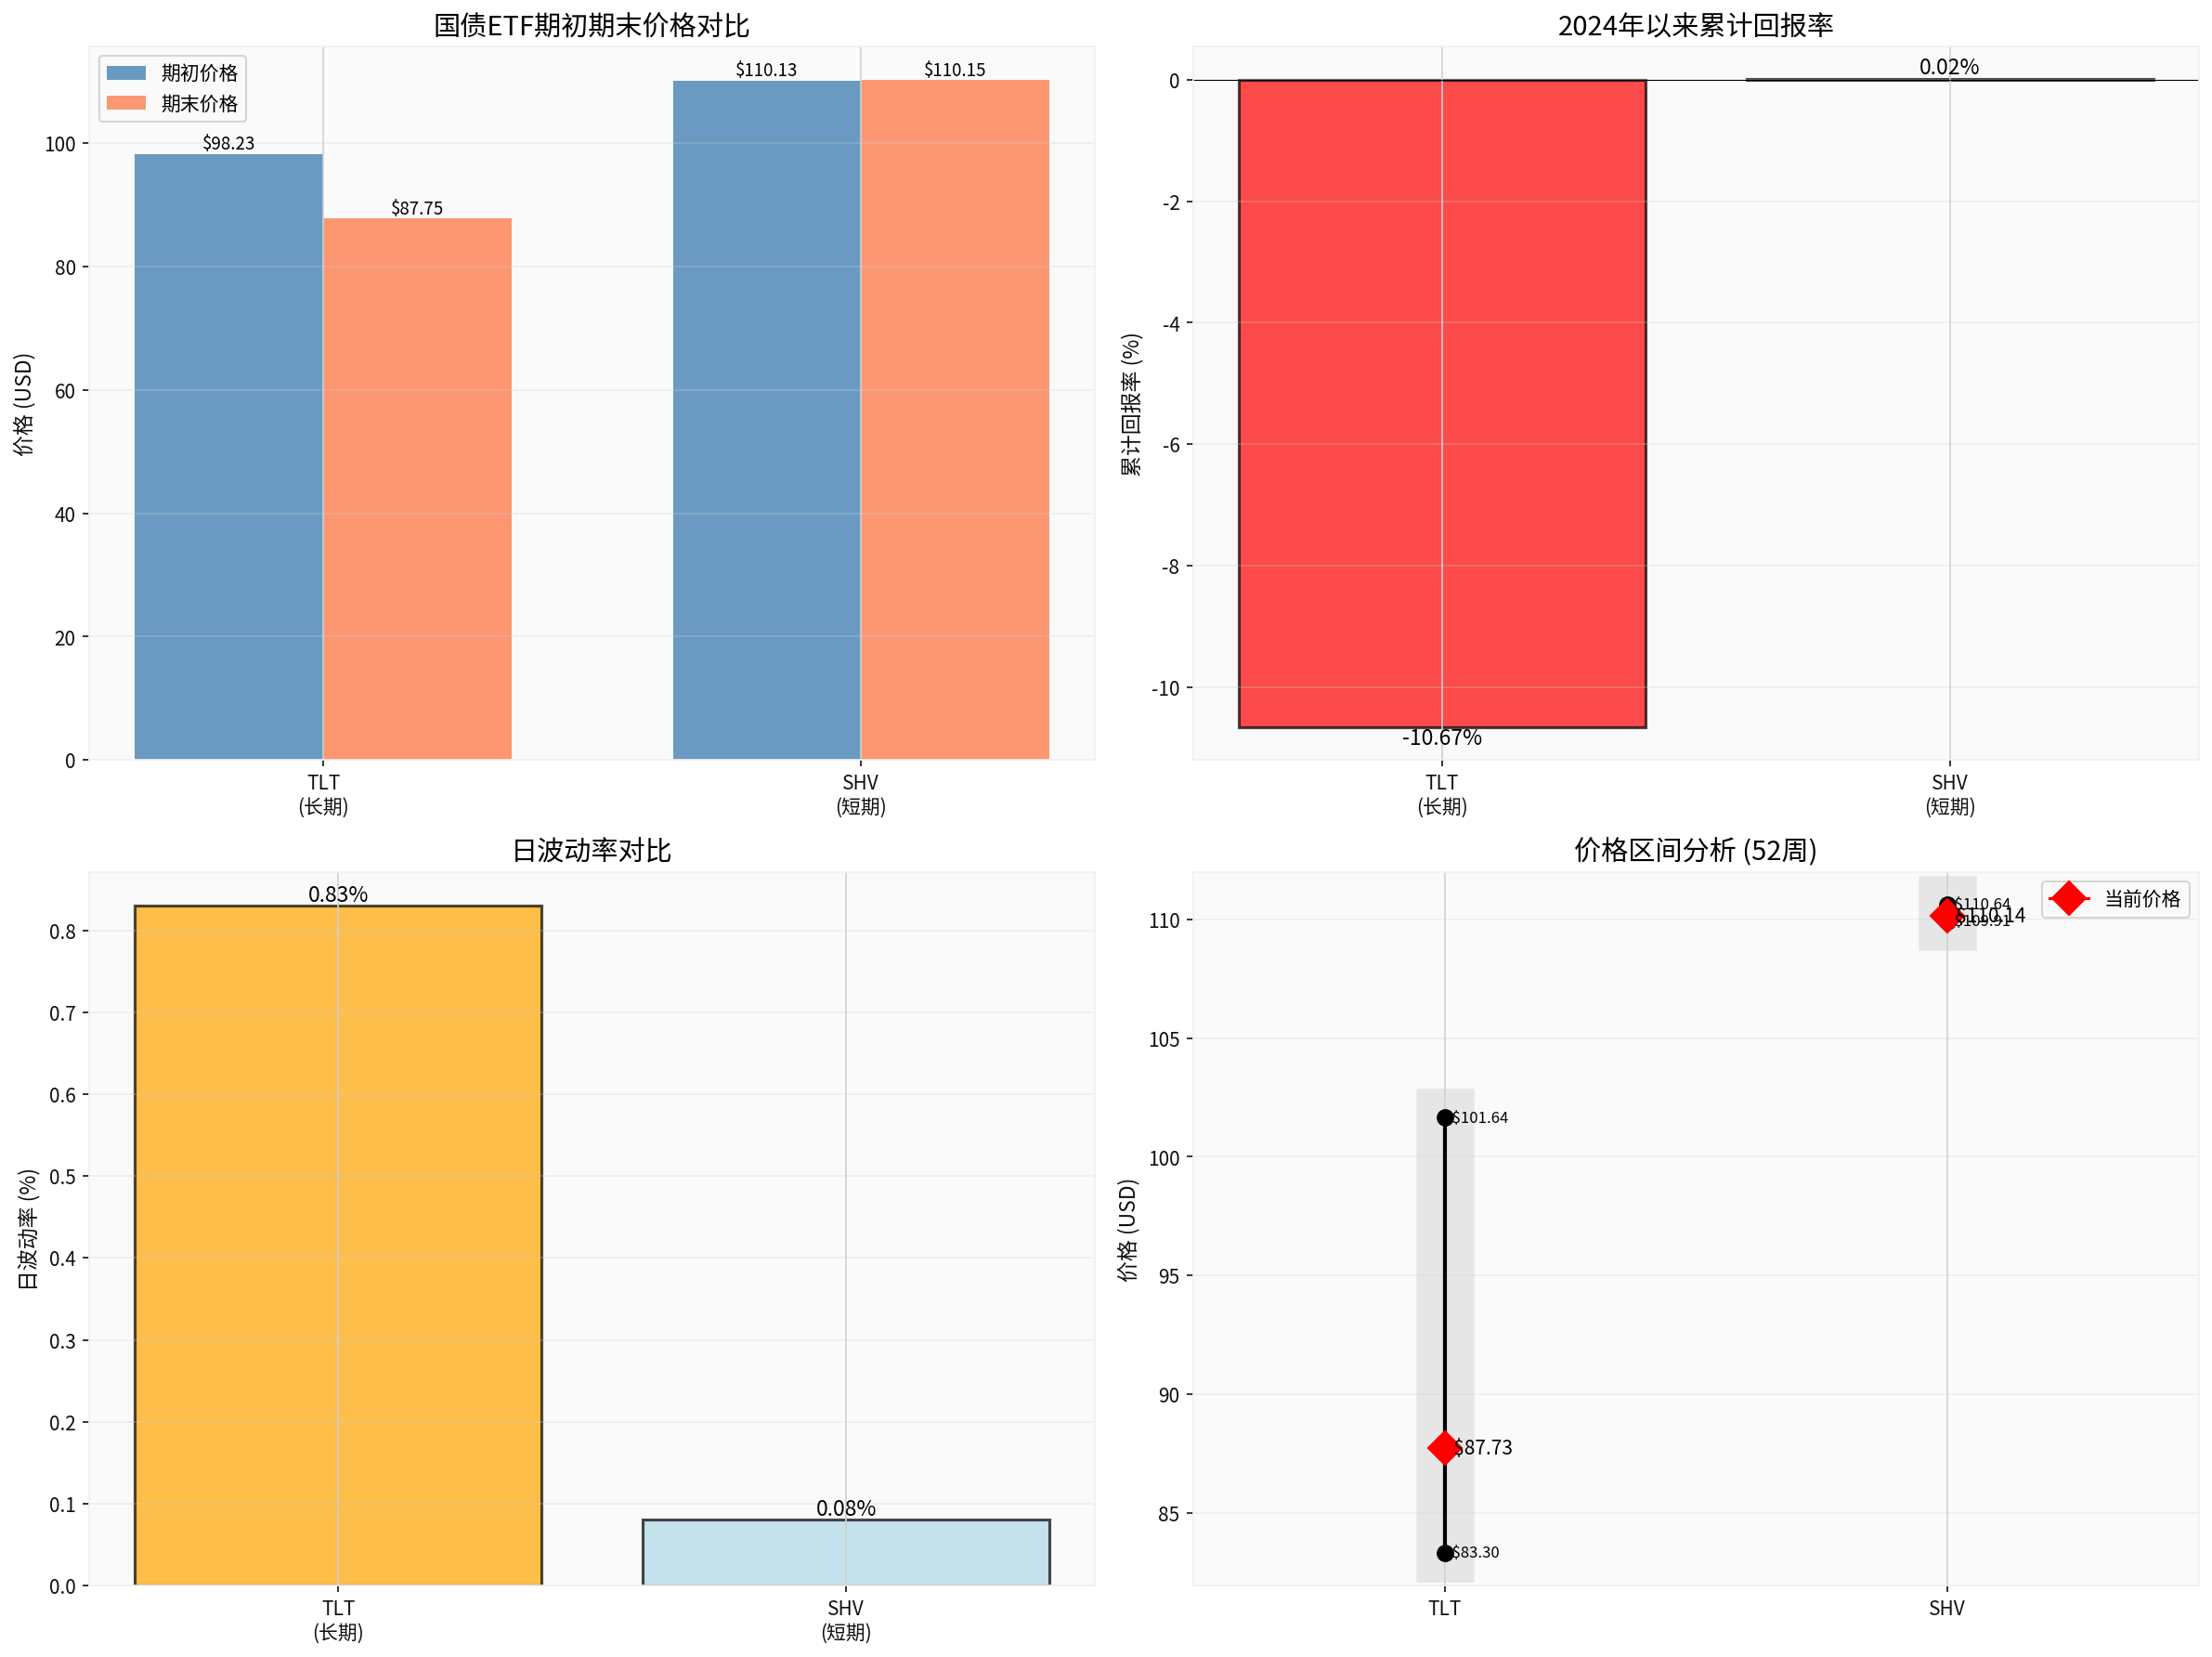
- Data Sources: TLT and SHV quotes and interval data are from broker API [0]; policy scale and pace information are from Bloomberg and WSJ related reports [1][2][3].
- Downward pressure on short-term interest rates and “steepening signs” of the curve exist, but the magnitude and sustainability need to observe actual purchase pace and macro data.
- Financial market liquidity is expected to improve in the short term and quarterly windows, but transmission to risk assets is gradual; marginal changes in policy pace and fiscal supply need to be警惕.
- Investors should anchor on high-frequency data (Treasury bill spreads, ONRRP vs. SOFR spreads, term spreads) to dynamically evaluate rebalancing of duration, credit, and liquidity, and avoid linear extrapolation of policy impacts.
[1] Bloomberg, “Fed Survey Sees About $220 Billion in Bill Buying Over 12 Months”, https://www.bloomberg.com/news/articles/2025-12-30/fed-survey-sees-about-220-billion-in-bill-buying-over-12-months
[2] Bloomberg, “Fed Quells Market Angst With $40 Billion Monthly Bill Purchases”, https://www.bloomberg.com/news/articles/2025-12-10/fed-says-it-will-begin-treasury-bill-purchases-on-dec-12
[3] WSJ, “Fed to Resume Net Asset Purchases With $40 Billion in Securities This Month”, https://www.wsj.com/economy/central-banking/fed-to-resume-net-asset-purchases-with-40-billion-in-securities-this-month-bdf55af0
[4] Bloomberg, “Treasuries Volatility Heads for Biggest Annual Slump Since 2009”, https://www.bloomberg.com/news/articles/2025-12-29/treasuries-volatility-heads-for-biggest-annual-slump-since-2009
[5] Yahoo Finance/Taiwan Region, Charts Related to U.S. Treasury Yield Curve (Inversion and Steepening of 2-Year and 10-Year Treasury Yields), https://s.yimg.com/ny/api/res/1.2/ArHDEaNq24MTKF1953EP3g--/YXBwaWQ9aGlnaGxhbmRlcjt3PTY0MDtoPTM2MA--/https://media.zenfs.com/zh-cn/bloomberg_chinese_simplified_41/30b285e11f30243f8b1179c61b69a437
[6] Yahoo Finance/Taiwan Region, “U.S. Treasuries Earned a Lot This Year? Experts Warn: Next Year May Not Be So Good” (Paraphrasing Reuters’ Views), https://hk.finance.yahoo.com/news/美債今年賺很兇-專家提醒-明年恐怕沒那麼好過-112512986.html
[0] Gilin API Data (TLT, SHV quotes and statistics, including cumulative returns, volatility, and interval data)
Insights are generated using AI models and historical data for informational purposes only. They do not constitute investment advice or recommendations. Past performance is not indicative of future results.
About us: Ginlix AI is the AI Investment Copilot powered by real data, bridging advanced AI with professional financial databases to provide verifiable, truth-based answers. Please use the chat box below to ask any financial question.