Analysis of ZIM Integrated Shipping's Form 13D/A Filings on Container Shipping Investment Value
Unlock More Features
Login to access AI-powered analysis, deep research reports and more advanced features
About us: Ginlix AI is the AI Investment Copilot powered by real data, bridging advanced AI with professional financial databases to provide verifiable, truth-based answers. Please use the chat box below to ask any financial question.
Related Stocks
Note: The following analysis is strictly based on obtained tool results and public information; no conclusive evidence of explicit “recent Form13D/A filing changes” has been retrieved so far. Therefore, the following assessment uses a hypothetical framework of “potential impacts if changes occur”.
- Current Price & Range (Real-time Quote): $21.23, daily increase +1.05%; 52-week range $11.04–$23.61; market cap $2.56B; PE (TTM)2.55[0]
- Recent Range Price (Daily Line Summary, 2024-10-01 to 2025-01-01): Open $24.08, close $21.47, range $18.02–$30.15, volatility during period (daily return standard deviation)4.67%, 20/50-day moving averages $20.09 and $22.33 respectively[0]
- Company Overview & Finance: ROE ~50.68%, net profit margin23.37%, current ratio1.20, quick ratio1.11, P/B ~0.66; 2024 latest available revenue share (by region): Pacific ~55.4%, Cross Suez ~12.2%, Latin America ~11.9%[0]; financial health rating is “moderate_risk”, sentiment category is “mixed” (mixed signals)[0]
- DCF Scenario Valuation (Reference): Conservative $354.60, Base $823.57, Optimistic $1,231.70 (all significantly higher than current market price, but such valuations are highly sensitive to assumptions and need to be assessed in conjunction with industry cycles; not suitable as a standalone basis for investment decisions)[0]
- Definition: A “beneficial ownership” report for holdings ≥5%; if filing Form13D instead of Form13G, it usually implies “intent to influence or change control”, involving major matters such as control rights, restructuring/acquisition/asset disposal, board changes, etc.[1]
- If Form13D/A “change direction is increase in holdings”, it may convey: confidence in freight rate/demand or cost improvement, or promotion of capital/dividend/buyback initiatives to enhance shareholder returns
- If “reduction/exit”, it may stem from: hedging against industry cycle inflection points, profit-taking, or tactical adjustment to reallocate to other assets
- If “governance and strategy initiatives”, including more aggressive cost control, capacity management, dividend policy, potential mergers/acquisitions/sales or strategic cooperation, etc.
- Scenario A (Increase in Holdings + Control/Strategy Initiatives): May boost short-term sentiment and valuation multiples, with strong peer follow-up effects
- Scenario B (Reduction/Exit): Triggers “reverse signal” concerns, putting pressure on sector valuations
- Scenario C (Structural Transaction/Spin-off/Cooperation): If it brings synergy or improves cash flow, it will enhance sector fundamentals and risk premium expectations
Note: The above scenarios are theoretical frameworks; specific impacts depend on the nature of the disclosed transaction, timeline, capital structure, and business logic.
####1) Geopolitical and Route Recovery Uncertainties
- Industry leaders Hapag-Lloyd and Maersk are cautious about the resumption of Red Sea/Suez routes, emphasizing “gradual and phased recovery” and requiring a 60-90 day transition to avoid port congestion[2]. The pace of such route recovery will directly affect voyage efficiency, cost structure, and capacity supply, thereby impacting freight rates and profits.
####2) Supply-Demand and Freight Rate Clues
- In 2024, trans-Pacific to US West Coast capacity supply is tight, while there are still large “blank sailings” (suspensions) on the US East Coast, leading to obvious freight rate and regional differentiation[3];
- Long-term demand is still affected by global trade routes, inventory cycles, and tariff policies; freight rate volatility is significant, and industry profits and valuations are highly sensitive to freight rates.
####3) Technology and Operational Upgrades
- The container and transportation IoT tracking market is expected to grow from approximately €2.7 billion in 2024 to €4.5 billion in 2029, reflecting the industry’s capital investment direction in visualization, cost, and efficiency[4]. Such long-term capital expenditures and management upgrades help improve unit costs and operational resilience, but in the short term, they also need to match the pace of capital expenditure.
####1) Key Peer Comparison Points (ZIM vs MATX)
- MATX (Matson): Current price $123.55,52-week range $86.97–$154.23, PE (TTM)9.45,EPS (TTM)$13.08[0]. Its relatively stable regional business structure and higher PE level differ from ZIM’s “high ROE + low PE + high volatility” characteristics:
- Profit Volatility: ZIM’s profits are more sensitive to freight rates and route costs; MATX’s regional and business structure provides relatively smooth cash flow
- Valuation Difference: ZIM’s low PE and high volatility reflect the market’s demand for cyclical discount and uncertainty compensation
####2) Overall Industry Performance
- The industrial sector has recently shown negative changes[0], overall in a震荡/adjustment phase, compounded by geopolitical and route uncertainties.
- Valuation Sensitivity: DCF shows huge differences between scenario ranges (conservative/base/optimistic), indicating that results are highly sensitive to growth, profit margin, and discount rate assumptions[0]. At the top/bottom of the cycle, static valuations are prone to distortion and need to be comprehensively judged in conjunction with industry position (freight rate and capacity cycle)
- Cycle and Volatility: ZIM’s annual return is +91.87% (from early to late 2024), but annualized volatility is high (daily return standard deviation4.67%), indicating coexistence of high elasticity and high drawdown risk[0]
- Information Asymmetry and Eventuality: Form13D/A is a high-information event; if it involves control/strategy changes, it will trigger valuation revaluation in the short term, and medium-term impact depends on the matching degree of implementation and industry trends
- No “clearly confirmed” recent Form13D/A filing changes have been seen so far; if the following changes occur in the future, they may have different impacts on the sector:
- If “increase in holdings + governance/strategy initiatives”: Conducive to short-term sentiment; sector valuation repair may be enhanced, but needs to match freight rate cycle and capital expenditure pace
- If “reduction/exit”: May trigger “reverse signal” and加剧 sector valuation and volatility pressure
- Valuation Aspect: ZIM’s current valuation (low PE, low PB) is attractive, but high volatility and cyclical attributes are significant; DCF reference range shows upside potential exists, but uncertainty is extremely high[0]. Need to dynamically track freight rates, route recovery pace, and capital expenditure plans
- We have generated ZIM’s 2024 technical analysis chart (including closing price,20/50-day moving averages, and trading volume); the chart link is as follows:
- ZIM Technical Analysis Chart (2024):
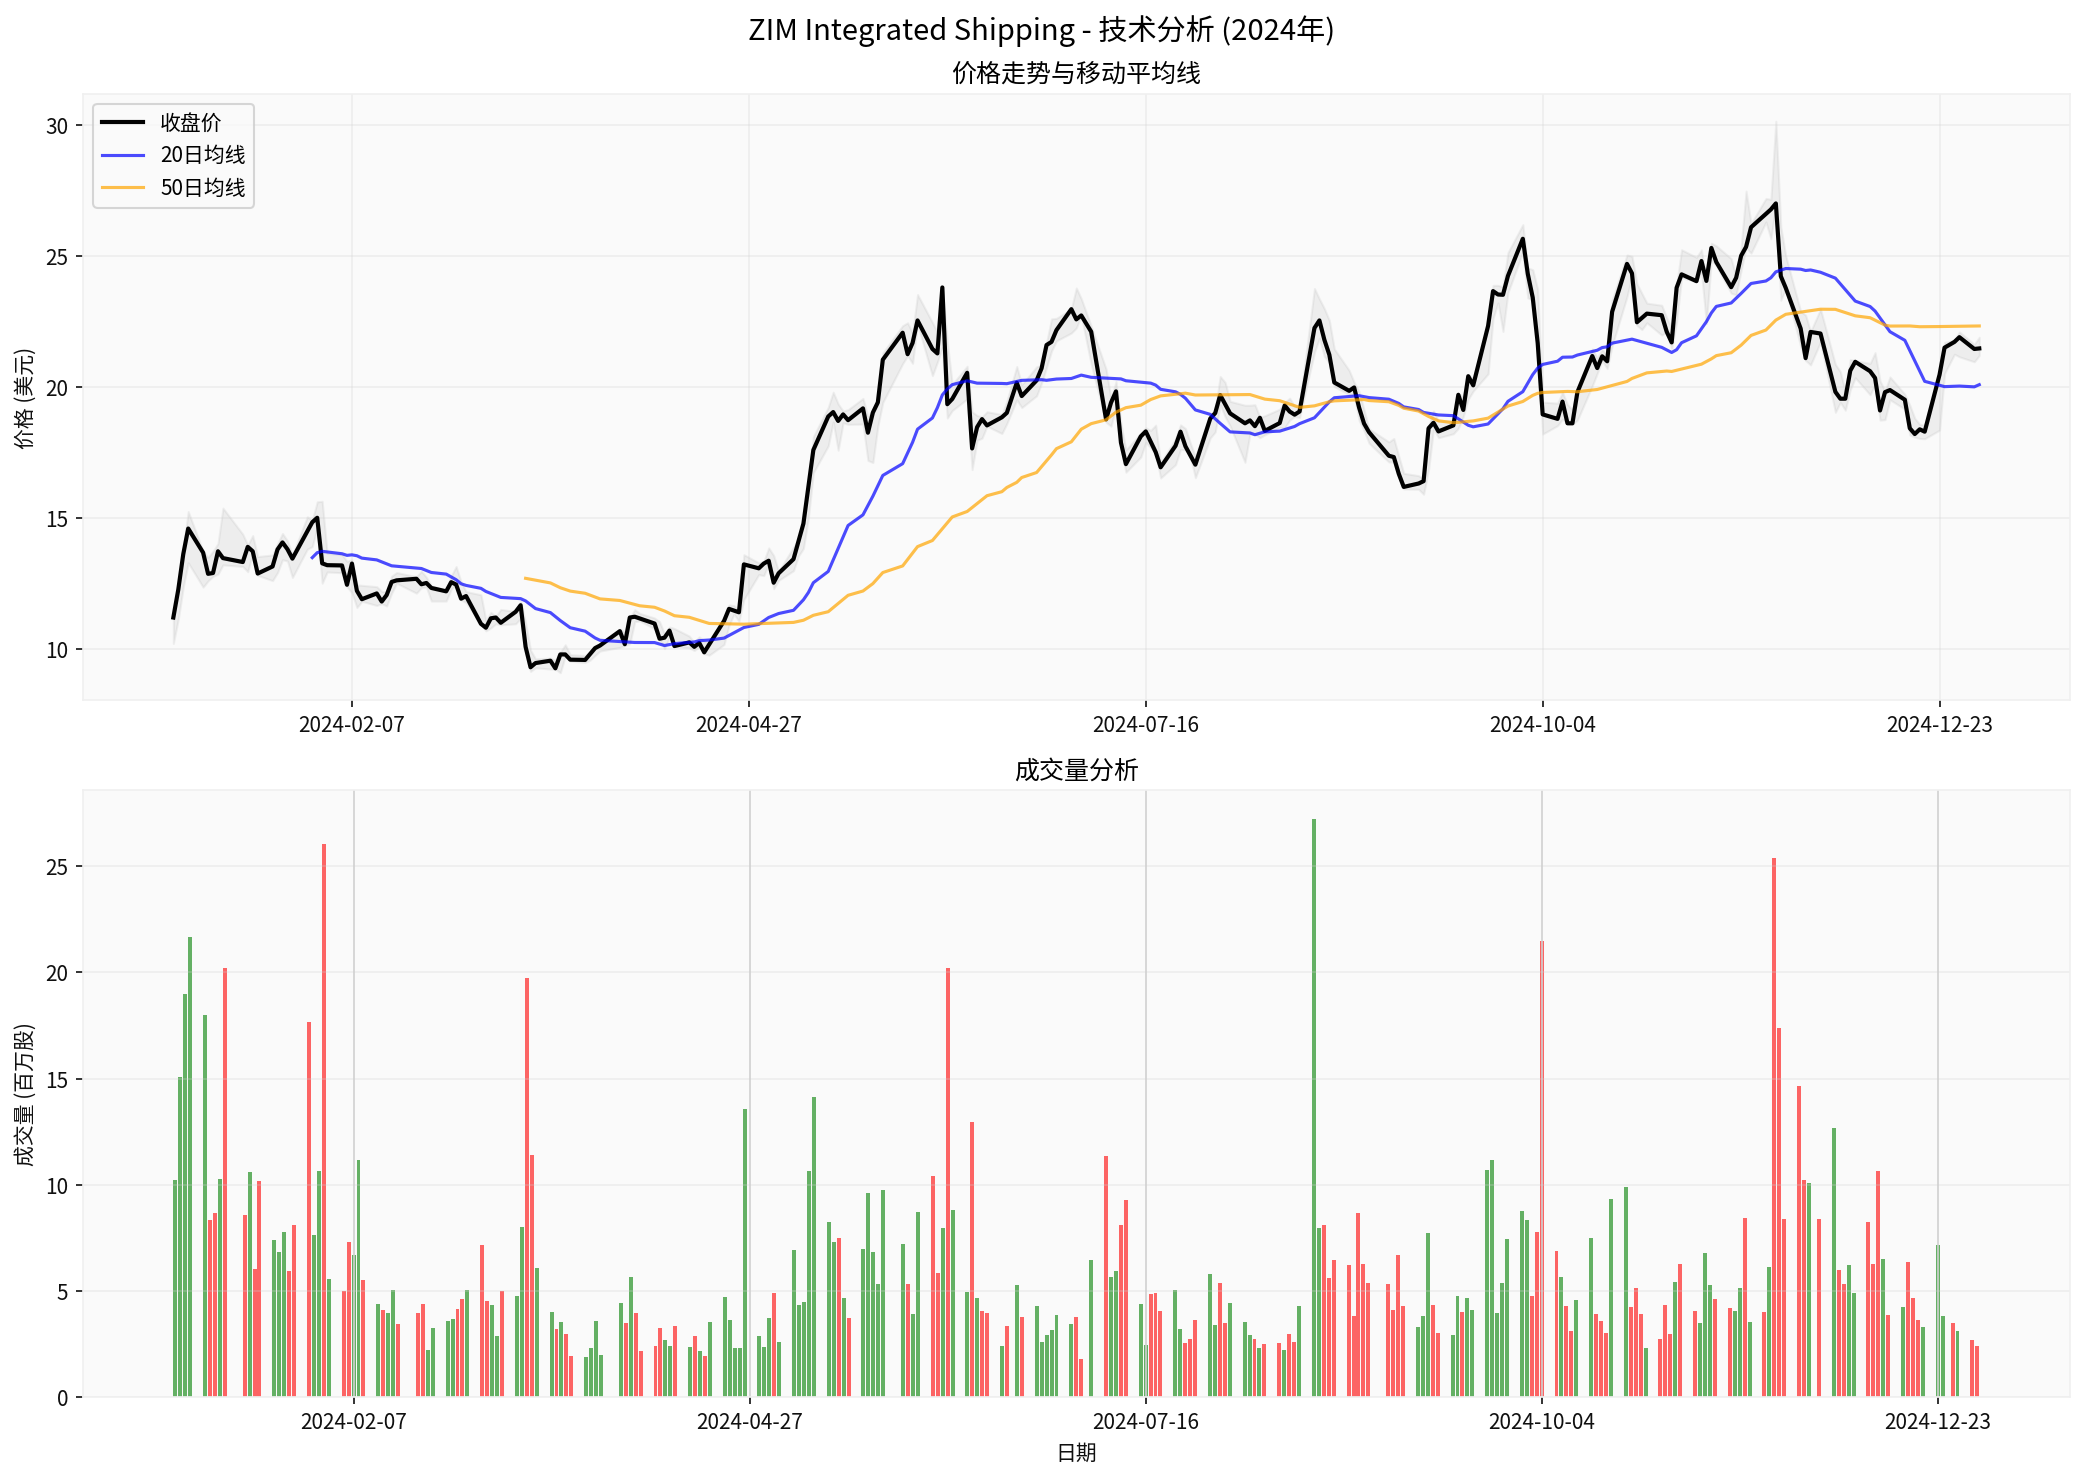 (The chart shows price trend,20/50-day moving averages, and trading volume distribution; data covers2024-01-01 to 2025-01-01; source: Broker API)[0]
- ZIM Technical Analysis Chart (2024):
[0] Gilin API Data (including real-time quotes, daily line summary, company overview, financial analysis, DCF valuation, sector performance, and Python calculations/charts)
[1] SuperMoney - Schedule 13D: What It Is, How to File, Requirements, Example(关于13D/13G的解释与要求)
https://www.supermoney.com/encyclopedia/schedule-13d
[2] Reuters(经由Yahoo Finance)- Shipping industry’s return to Suez will be gradual, Hapag-Lloyd CEO says
https://uk.finance.yahoo.com/news/shipping-industrys-return-suez-gradual-102557784.html
[3] Yahoo Finance - Ocean rates: New Year promises a good ‘blanking’ for US East Coast
https://finance.yahoo.com/news/ocean-rates-promises-good-blanking-172800876.html
[4] Yahoo Finance - Global €4.5 Billion Trailer and Cargo Container Tracking Market Forecast, 2029
https://finance.yahoo.com/news/global-4-5-billion-trailer-144100148.html
(If needed, I can continue to monitor SEC disclosures and announcements; once new Form13D/A changes occur, I will update the impact assessment for you immediately.)
Insights are generated using AI models and historical data for informational purposes only. They do not constitute investment advice or recommendations. Past performance is not indicative of future results.
About us: Ginlix AI is the AI Investment Copilot powered by real data, bridging advanced AI with professional financial databases to provide verifiable, truth-based answers. Please use the chat box below to ask any financial question.