Analysis of CNOOC's Oil and Gas Production Growth and Oil Price Volatility
Unlock More Features
Login to access AI-powered analysis, deep research reports and more advanced features
About us: Ginlix AI is the AI Investment Copilot powered by real data, bridging advanced AI with professional financial databases to provide verifiable, truth-based answers. Please use the chat box below to ask any financial question.
Related Stocks
CNOOC Limited (stock code: 0883.HK), as China’s largest offshore oil and gas producer, currently has a market capitalization of HK$1.01 trillion and a share price of HK$21.30 [0]. From a valuation perspective, the company’s current P/E ratio is only 7.13x, significantly lower than the industry average, indicating a high margin of safety [0]. The company’s P/B ratio is 1.16x, suggesting that the share price is close to its book value, which has strong defensive characteristics for resource companies [0].
From the perspective of profitability indicators, CNOOC has shown excellent financial performance: return on equity (ROE) reaches 16.65%, net profit margin is as high as 31.83%, and operating profit margin is even 44.59% [0]. These indicators are leading in the energy industry, reflecting the company’s efficient operation management and low-cost competitive advantage. The current ratio and quick ratio are 2.36 and 2.32 respectively, showing that the company has sufficient short-term liquidity to effectively respond to market fluctuations [0].
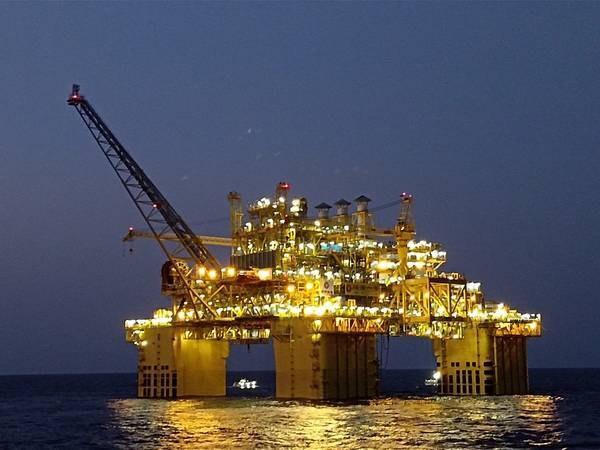
According to industry data analysis, CNOOC’s oil and gas production has shown a continuous growth trend. It increased from 690,000 barrels per day in 2020 to approximately 900,000 barrels per day in 2025, with a production growth of about 30% over five years [1]. This growth trajectory is mainly due to the company’s continuous development of offshore blocks covering approximately 650,000 square kilometers in the Bohai Bay and South China Sea [1].
In terms of strategic layout, CNOOC has adopted a diversified strategy of “offshore as the main focus, onshore expansion”. Although the company has traditionally focused on offshore oil and gas production, it has started to layout onshore unconventional resource development in recent years to reduce resource concentration risks [1]. The company recently launched new production capacity in the Xijiang Oilfield Block 24 development project, which uses China’s first unmanned offshore platform with high-temperature fluid cooling and export capabilities, reflecting the company’s continuous investment in technological innovation and efficiency improvement [2].
From a financial sensitivity analysis perspective, CNOOC’s production growth strategy can partially offset the impact of oil price volatility to a certain extent. The following scenario analysis is used to evaluate this hedging effect:
Key data shows that CNOOC’s beta coefficient is only 0.33, far below the market average, indicating that its stock price volatility is significantly lower than the market [0]. This low volatility feature mainly comes from three factors: first, as a state-controlled enterprise, the company enjoys policy support and stable resource acquisition channels; second, the company focuses on the development of mature offshore blocks, and production costs are relatively controllable; third, the company has a high dividend yield (about 6.86%), providing stable cash returns for investors [0].
- Low-cost production structure:The company focuses on incremental development of mature offshore blocks, with good production cost control, and can still maintain profitability in a low oil price environment.
- Stable cash flow generation:The 2024 annual free cash flow reached HK$97.5 billion, providing a solid foundation for the company’s continuous investment and dividends [0].
- Prudent accounting policies:Financial analysis shows that the company adopts conservative accounting policies, and the high depreciation and capital expenditure ratio means there is room for future profit improvement [0].
- Strong shareholder returns:The company has maintained a high dividend policy for a long time, and its dividend yield is at a high level among peers.
- High sensitivity to oil prices:As an upstream oil and gas producer, the company’s revenue is highly correlated with oil prices, and oil price volatility is still the main factor affecting performance.
- Production growth bottlenecks:With the increase in the proportion of mature blocks, future production growth may slow down.
- Geopolitical risks:The company’s operations in disputed waters such as the South China Sea may face geopolitical uncertainties.
- Energy transition pressure:In the long run, the impact of global energy transition on fossil energy demand cannot be ignored.
The current analyst consensus rating is ‘Hold’. Among 16 analysts, 5 gave ‘Buy’ ratings, 10 maintained ‘Hold’ ratings, and 1 recommended selling [0]. From the recent stock price performance, the cumulative increase in the past three months is 12.52%, the increase in the past six months is 19.13%, and the one-year return rate is 12.82% [0]. It is worth noting that the company’s five-year cumulative return rate is as high as 202.13%, showing long-term investment value [0].
Comprehensive analysis shows that CNOOC’s oil and gas production growth strategy can hedge the impact of oil price volatility to a certain extent, but cannot completely eliminate the impact of oil price volatility on the company’s performance. The company has enhanced its risk resistance through the following advantages: low valuation provides a high margin of safety; low beta coefficient reduces stock price volatility; high dividend yield provides stable cash returns; prudent accounting policies retain room for future profit improvement. However, investors still need to pay attention to the direct impact of oil price trends on the company’s performance, and continuously track the company’s production growth plan and cost control capabilities.
For investors seeking steady returns, CNOOC, as a low-valuation, high-dividend resource stock, has certain allocation value in the current energy market. It is recommended that investors make investment decisions based on their own risk preferences and investment goals, combined with the latest market data and company announcements.
[0] Yahoo Finance - CNOOC Limited (0883.HK) Stock Price, News, Quotes and Records (https://hk.finance.yahoo.com/quote/0883.HK/)
[1] Yahoo Finance - China’s Oil Pumping Power Breaks All Records (https://finance.yahoo.com/news/china-oil-pumping-power-010000006.html)
[2] Yahoo Finance - CNOOC Brings New Xijiang Offshore Project Online in South China Sea (https://finance.yahoo.com/news/cnooc-brings-xijiang-offshore-project-011249548.html)
Insights are generated using AI models and historical data for informational purposes only. They do not constitute investment advice or recommendations. Past performance is not indicative of future results.
About us: Ginlix AI is the AI Investment Copilot powered by real data, bridging advanced AI with professional financial databases to provide verifiable, truth-based answers. Please use the chat box below to ask any financial question.