Analysis of the Impact of Bitcoin ETF Outflows on the Market and the Reversal of Capital Flows
Unlock More Features
Login to access AI-powered analysis, deep research reports and more advanced features

About us: Ginlix AI is the AI Investment Copilot powered by real data, bridging advanced AI with professional financial databases to provide verifiable, truth-based answers. Please use the chat box below to ask any financial question.
Related Stocks
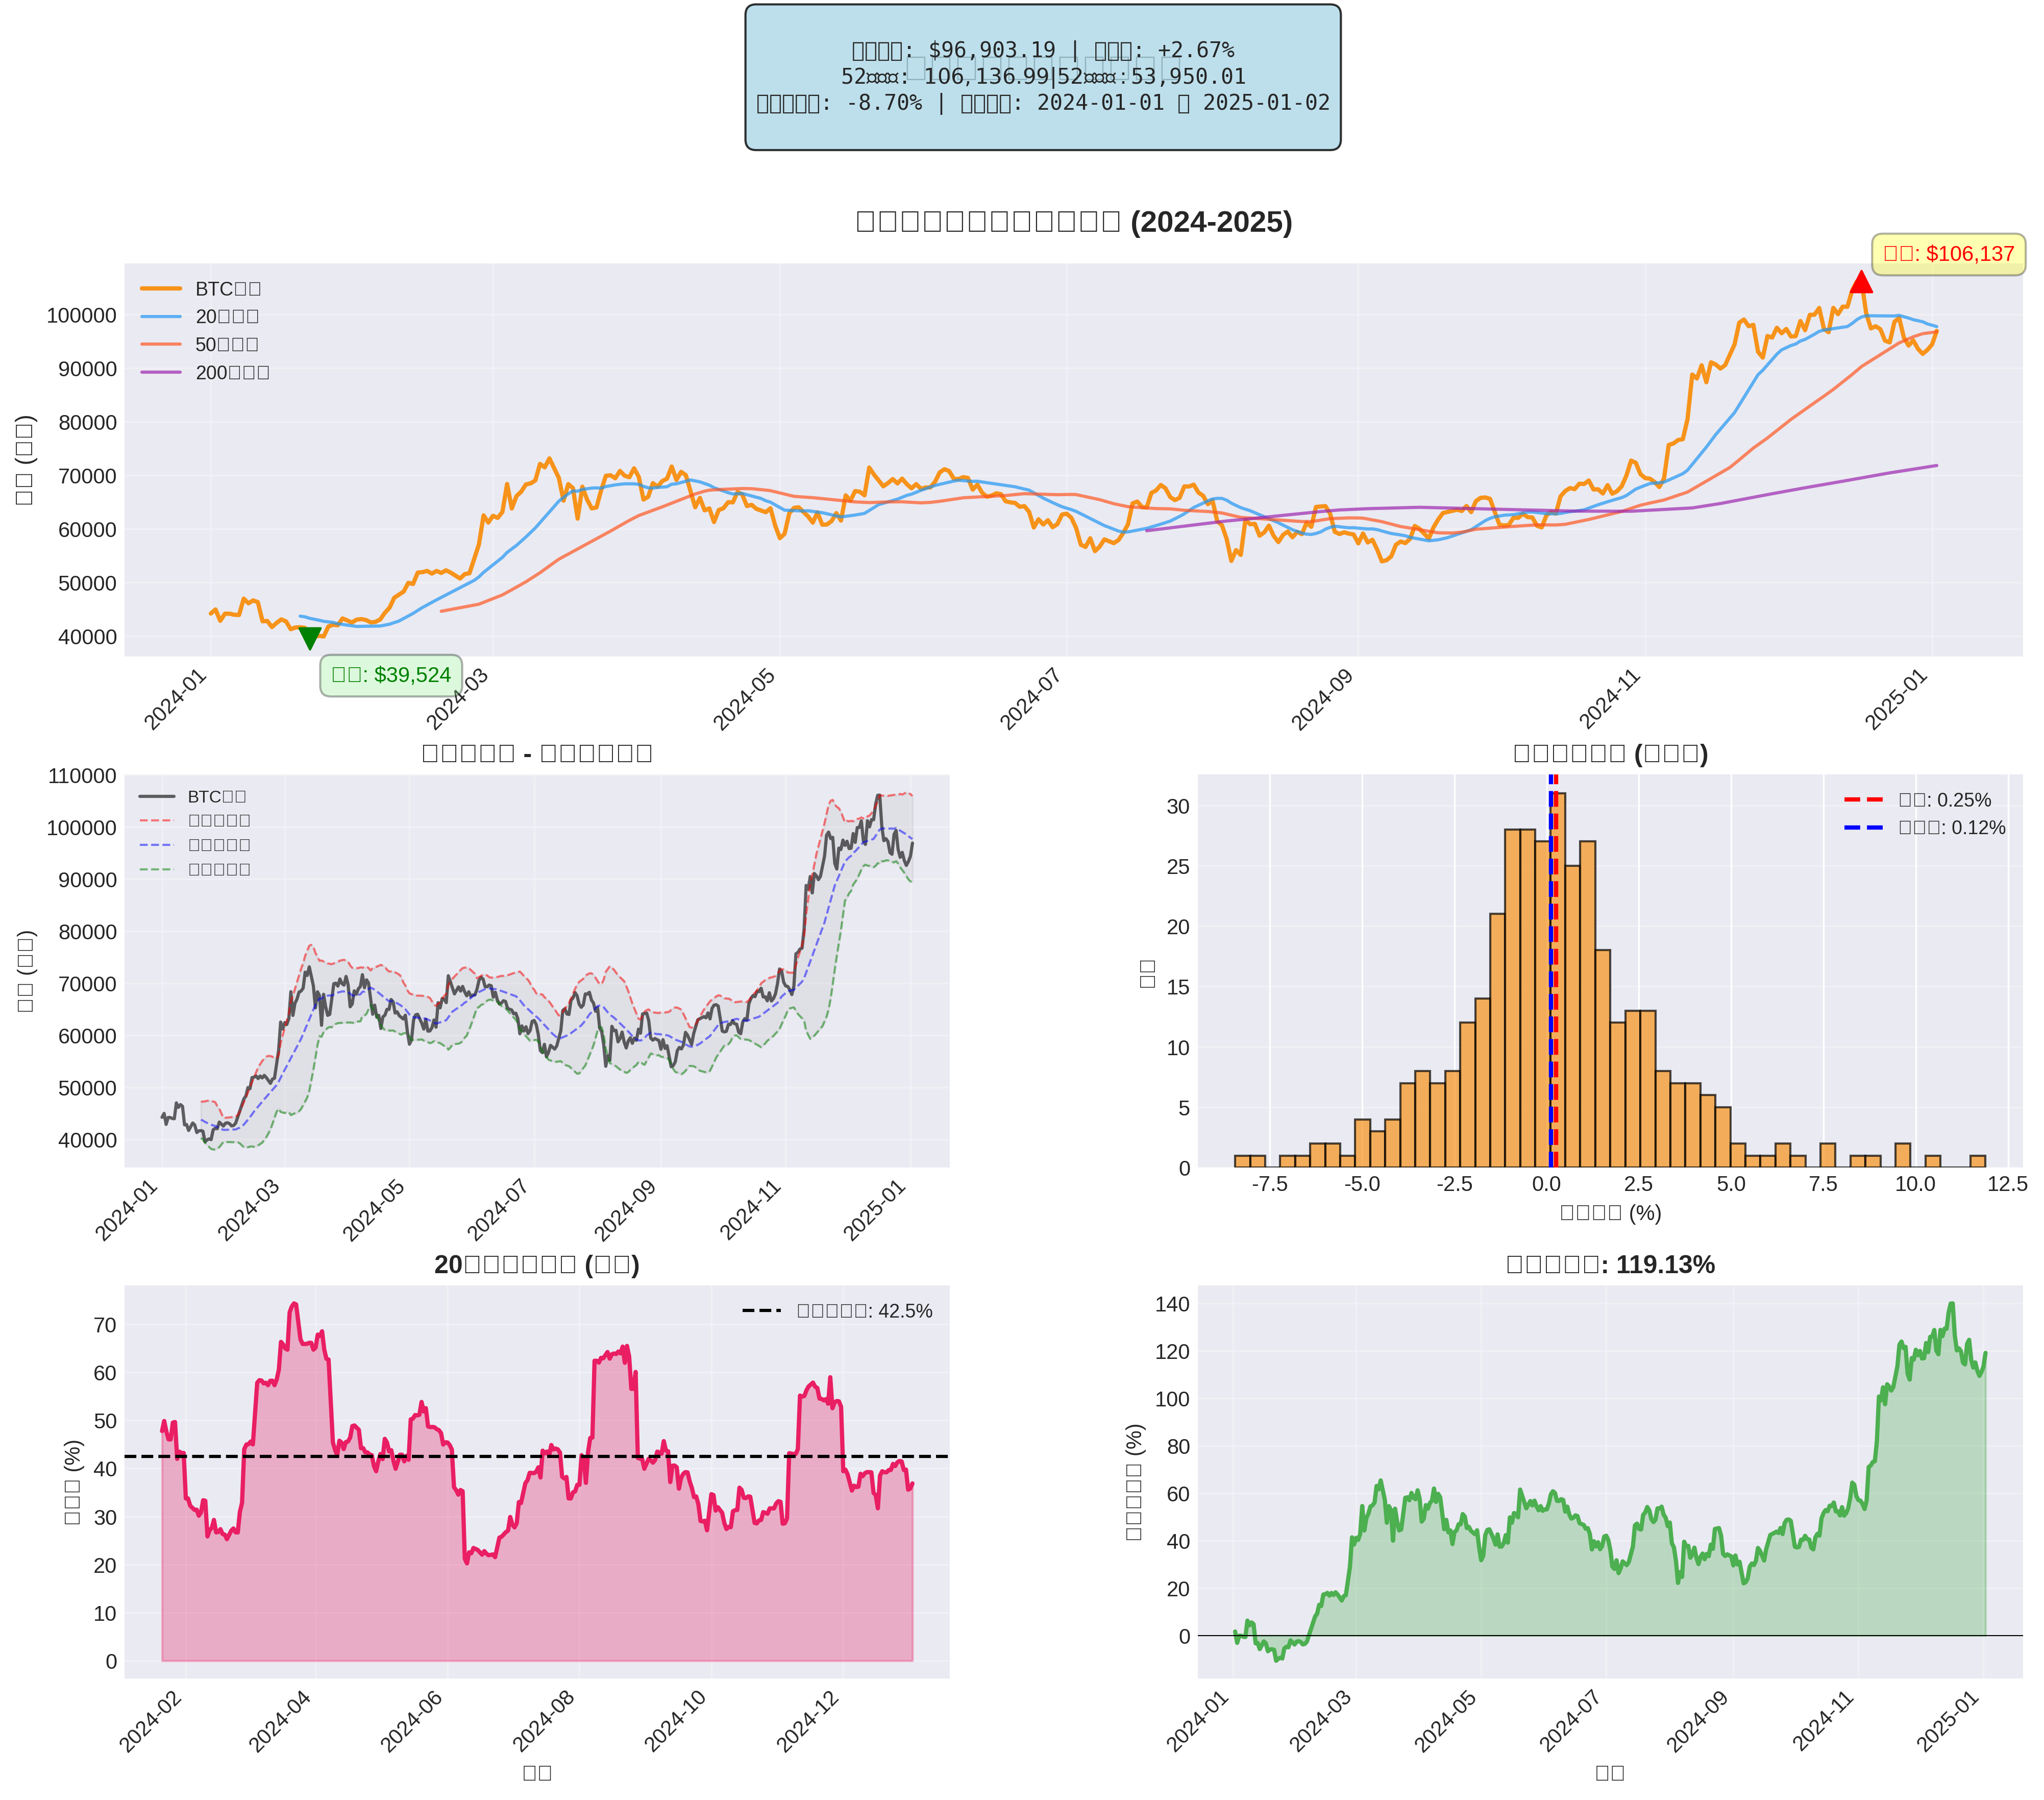
According to the latest market data [0], Bitcoin currently trades at
Bitcoin ETF outflows have directly pressured prices. Data shows that on the last trading day of 2025, all 12 Bitcoin spot ETFs recorded a net outflow of
The mechanism of ETF outflows affecting market valuation is as follows:
- Selling Pressure Transmission: ETF redemptions force issuers to sell Bitcoin in the secondary market to meet redemption demands
- Reduced Liquidity: Institutional capital withdrawal reduces market depth and amplifies price volatility
- Chain Reaction: Retail investors follow institutional operations, forming a “herd effect”
Historical data shows that ETF capital flows have a
According to Glassnode data, the 30-day simple moving average of Bitcoin and Ethereum ETFs remained negative at the end of 2025 [1], which reflects:
- Weak retail demand: Retail investors’ willingness to allocate to crypto assets has decreased
- Strong wait-and-see sentiment: Investors are waiting for clearer entry signals
- Increased risk aversion: Capital flows to more stable safe-haven assets
- Fear & Greed Index Tends to Panic: During outflows, the Fear & Greed Index usually drops to the panic zone
- Trading Volume Contraction: Await-and-see attitude leads to decreased trading activity
- Derivatives Market Volatility: Futures and options markets show increased investor uncertainty about short-term prospects
Based on current market structure and historical patterns, the
-
Historical Cycle Law: Since 2010, Bitcoin has been followed by an up year after every down year [6]. Bitcoin performed weakly in 2025 (down about 5% from the start to December), which historically laid the foundation for a rebound in 2026.
-
Mature Institutional Entry Channels: Bitwise Chief Investment Officer Matt Hougan called the ETF trajectory “phenomenally bullish” and predicted that 2026 will be a “record inflow year” [6]. The “trillions of dollars” from large investment bank channels can enter the market.
-
Technical Support: Bitcoin shows strong support in the 87,000-89,000 USD range [2], and has quickly recovered after breaking below multiple times, indicating buying support in this area.
-
Macroeconomic Suppression: The Federal Reserve continues to withdraw liquidity from the system, which directly affects risk assets including Bitcoin [7].
-
**“Liquidity Dependence Dilemma”: Although Bitcoin is framed as a hedge against the Fed, it actually still relies on Fed-driven liquidity [7].
According to CryptoQuant’s annual forward-looking analysis [1], three scenarios may emerge in 2026:
| Scenario | Probability | Price Range | Driving Factors |
|---|---|---|---|
Distorted Range |
Highest | $80,000-$140,000 | Intermittent ETF flows and macro uncertainty from U.S. midterm elections |
Sustained Bull Market |
~20% | New highs followed by final correction | Optimistic scenario, but likelihood decreases over time |
Bear Market Continuation |
Unspecified | Below $80,000 | Pessimistic scenario with sustained macro pressure |
CryptoQuant recommends that
- Rate Cut Expectations Realized: If the Fed starts cutting interest rates in 2026, it will release liquidity and boost risk assets
- Improved Inflation Data: CPI and PCE data continuing to fall to target ranges may trigger a dovish policy shift
- Confirmation of Economic Soft Landing: Avoiding recession risk will enhance investor confidence
- Central Bank Policy Coordination: Policy synchronization among major central banks (Fed, ECB, BOJ)
- Dollar Index Trend: A weaker dollar usually benefits alternative assets like Bitcoin
- Geopolitical Détente: Reduced geopolitical risk lowers safe-haven demand, and capital flows to risk assets
- Supply Shock: Although the April 2024 halving has reduced block rewards from 6.25 BTC to 3.125 BTC [8], its price effect may be fully reflected 12-18 months later
- Scarcity Narrative: Daily new issuance drops from 450 BTC to 225 BTC (about 24 million USD) [9], strengthening the scarcity narrative
- Historical Pattern: In the 6-18 months after the previous three halvings, Bitcoin hit all-time highs
- Corporate Treasury Allocation: More companies follow MicroStrategy to include Bitcoin in their treasury reserves
- ETF Product Expansion: New products like Solana and XRP ETFs launched in November 2025 [1] expand crypto investment channels
- Traditional Finance Integration: Wall Street’s acceptance of cryptocurrencies continues to increase
- Layer 2 Solutions: Solutions like Lightning Network improve Bitcoin’s utility
- Regulatory Clarity: Clear regulatory frameworks established in the U.S. and major markets
- ETF Flow Reversal Signal: Sustained multi-day net inflows break the outflow trend (e.g., 354.8 million USD net inflow on December 30, 2025 [3])
Key monitoring indicators:
- 7-day/30-day cumulative flow: Turning from negative to positive
- Large Fund Performance: BlackRock IBIT, Fidelity FBTC and other leading funds have sustained net inflows
- New Capital Sources: Retail and family office capital re-enters
- Price Breakthrough: Effectively breaking through the key technical level of 102,000 USD [6]
- Moving Average Golden Cross: 50-day moving average crosses above the 200-day moving average
- Volume Expansion: Price increases accompanied by significant volume growth
- Fear & Greed Index Rebound: Entering the “greed” zone (above 60 points)
- Social Media Sentiment: Increased proportion of positive sentiment
- Search Interest: Google Trends search volume for “Bitcoin” rises
| Institution/Analyst | Price Target | Reason |
|---|---|---|
Standard Chartered |
$150,000 | ETF inflows will keep BTC above $100,000 [6] |
Bernstein |
$150,000 | Macroeconomic conditions and institutional adoption [2] |
Fundstrat |
$200,000-$250,000 | ETF inflows may take market share from gold [6] |
Conservative Forecast |
$150,000-$200,000 | Assuming the 102,000 USD technical support level holds [6] |
Analysts’ forecast differences are mainly based on different assumptions about the following variables:
- Macroeconomic Environment: Timing and magnitude of Fed rate cuts
- ETF Flows: Scale and speed of institutional capital entry
- Technical Support: Ability to hold key technical levels
- Halving Effect: Extent of delayed impact from the 2024 halving
- Wait-and-See: Stay cautious until sustained reversal of ETF capital flows is confirmed
- Key Level Monitoring: Monitor the 87,000-89,000 USD support range and the 102,000 USD resistance level
- ETF Flow Tracking: Daily monitoring of net inflow/outflow data of major Bitcoin ETFs
- Risk Management: Set stop-losses and control position size
- Batch Accumulation: If prices stabilize in the 80,000-90,000 USD range, consider accumulating in batches
- Event-Driven Strategy: Focus on key events like Fed meetings and macroeconomic data releases
- Fundamental Analysis: Focus on ETF capital flows, institutional position changes, and network activity indicators
- Hedging Tools: Use derivatives like options to manage volatility risk
- Fed maintains tighter policy than expected
- Adverse changes in regulatory policies
- Systemic financial risk events
- Sustained ETF capital outflows
- Faster-than-expected institutional adoption
- Earlier-than-expected Fed policy shift
- Geopolitical events trigger safe-haven demand
- Large-scale ETF capital inflows
Bitcoin ETF outflows have had a
The
- Fed monetary policy shifts to accommodative
- Delayed impact of the 2024 halving effect becomes apparent
- ETF capital flows show sustained net inflows
- Prices effectively break through key technical resistance levels
Investors should closely monitor the three key indicators:
[0] Gilin API Data - Bitcoin Price and Market Data (2024-2025)
[1] Yahoo Finance - “2025 Ended in Red: Bitcoin ETFs Bled $348M on Final Trading Day”
https://finance.yahoo.com/news/2025-ended-red-bitcoin-etfs-174713094.html
[2] Yahoo Finance - “The Year in Crypto ETFs 2025: Bitcoin, Ethereum Thrive as…”
https://finance.yahoo.com/news/crypto-etfs-2025-bitcoin-ethereum-140103429.html
[3] Yahoo Finance - “Bitcoin and Ethereum ETFs Reverse 7-Day Outflow Trend, Can Spot Prices Follow?”
https://finance.yahoo.com/news/bitcoin-ethereum-etfs-reverse-7-084941025.html
[4] Forbes - “What Is Bitcoin’s Price Prediction For 2026?”
https://www.forbes.com/sites/digital-assets/2026/01/01/what-is-bitcoins-price-prediction-for-2026/
[5] Forbes - “Bitcoin At $87K: Bear Market Or Buying Opportunity?”
https://www.forbes.com/sites/digital-assets/2025/12/27/bitcoin-at-87k-bear-market-or-buying-opportunity/
[6] Yahoo Finance - “Bitcoin $150K or $250K by 2026? Why Analysts Are Split…”
https://finance.yahoo.com/news/bitcoin-150k-250k-2026-why-152611261.html
[7] Yahoo Finance - “Bitcoin got stuck after slumping 30% from its peak. Here’s…”
https://finance.yahoo.com/news/bitcoin-got-stuck-slumping-30-120000174.html
[8] Investopedia - “Understanding Bitcoin Halving: Impact on Price and Investment Strategies”
https://www.investopedia.com/bitcoin-halving-4843769
[9] Forbes - “How BTC Price Rises To $1 Million”
https://www.forbes.com/sites/greatspeculations/2025/11/12/how-btc-price-rises-to-1-million/
日本央行延迟加息至2026年底的投资影响分析
Insights are generated using AI models and historical data for informational purposes only. They do not constitute investment advice or recommendations. Past performance is not indicative of future results.
About us: Ginlix AI is the AI Investment Copilot powered by real data, bridging advanced AI with professional financial databases to provide verifiable, truth-based answers. Please use the chat box below to ask any financial question.