Mobileye (MBLY) Investment Value Analysis Report: Risk/Reward Assessment Amid Intensifying Autonomous Driving Competition
Unlock More Features
Login to access AI-powered analysis, deep research reports and more advanced features

About us: Ginlix AI is the AI Investment Copilot powered by real data, bridging advanced AI with professional financial databases to provide verifiable, truth-based answers. Please use the chat box below to ask any financial question.
Related Stocks
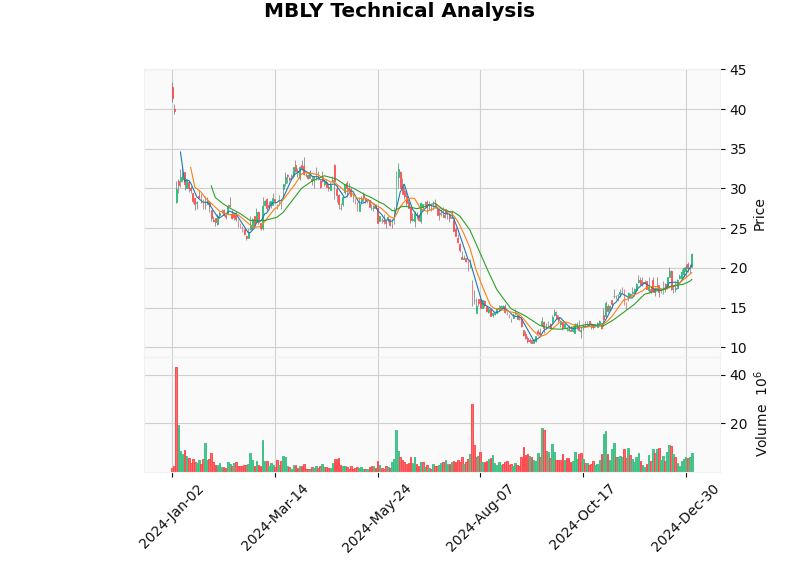
Mobileye’s current stock price is at a historic low. Despite facing fierce market competition and technical route challenges, it still shows significant upside potential based on multiple valuation models. Based on DCF model, analyst consensus, and competitive landscape analysis, Barclays upgraded Mobileye’s rating to “Overweight” to reflect its judgment that the risk/reward ratio is attractive [1]. However, there is a time inconsistency in the charts shown by technical analysis (the technical analysis chart shows the closing price of the latest trading day as $21.70 on 2025-01-03, while the real-time quote shows the closing price as $11.23 on 2026-01-05). Investors need to pay attention to short-term fluctuations and verify data consistency.
According to the analysis results of the DCF model, Mobileye’s intrinsic value under the three scenarios is significantly higher than the current stock price [0]:
- Intrinsic Value: $58.54
- Upside Potential: +421.3%
- Key Assumptions: Revenue growth 0%, EBITDA margin -15.9%
- Intrinsic Value: $72.59
- Upside Potential: +546.4%
- Key Assumptions: Revenue growth 14.4%, EBITDA margin -16.7%
- Intrinsic Value: $128.62
- Upside Potential: +1,045.3%
- Key Assumptions: Revenue growth 17.4%, EBITDA margin -17.6%
Key Valuation Indicators [0]:
| Indicator | Value | Description |
|---|---|---|
| P/E Ratio (TTM) | -27.21x | Currently in loss |
| P/B Ratio | 0.77x | Below Book Value (less than 1.0) |
| P/S Ratio | 4.72x | Higher than industry median |
| EV/OCF | 10.66x | Enterprise Value/Operating Cash Flow |
- Consensus Target Price: $18.00 (+60.3% upside potential)
- Target Price Range: $12.00 - $25.00
- Analyst Consensus Rating: 17.5 (BUY)
- Rating Distribution:
- Buy: 15 (62.5%)
- Hold: 8 (33.3%)
- Sell: 1 (4.2%)
| Date | Investment Bank | Action |
|---|---|---|
| Morgan Stanley (2025-12-08) | Maintain | Equal Weight |
| Goldman Sachs (2025-11-26) | Maintain | Neutral |
| Evercore ISI (2025-11-24) | Maintain | Outperform |
| Tigress Financial (2025-10-30) | Maintain | Buy |
| Indicator | Actual Value | Expected Value | Beat Rate |
|---|---|---|---|
| Revenue | $504M | $480.92M | +4.80% |
| Diluted EPS | $0.09 | $0.09 | +4.94% |
| Adjusted EBITDA | $92M | $90.28M | +1.9% |
- Gross Margin: 66.1% (Q3 2025)
- Adjusted EBITDA Margin: 18.3% (Q3 2025)
- Free Cash Flow Margin: 28.4% (YoY increase)
- Free Cash Flow (TTM): $319 million
- Current Ratio: 6.46
- Quick Ratio: 5.61
- Net Profit Margin: -17.34% (negative)
- ROE: -2.79%
| Competitor | Technical Path | Market Position | TOPS Performance (Partial) |
|---|---|---|---|
Tesla |
Pure Vision | High-End Market | ~144 TOPS (HW4) |
NVIDIA |
LiDAR + Camera + Radar | High-End + Mid-End | Drive Thor ~1,000 TOPS |
Qualcomm |
Snapdragon Ride Platform | Mid-End Market | Not Detailed |
Rivian |
RAP1 Chip (5nm) | Mid-End | ~800 TOPS/Chip (Single/Dual Chip:1600 TOPS) |
-
LiDAR Route: NVIDIA, Mercedes-Benz and other partners promote the “multi-sensor fusion” route, emphasizing the redundancy and safety of LiDAR. Mobileye adopts the “camera + radar + imaging radar” route, not relying on traditional mechanical LiDAR, which has certain cost advantages.
-
Pure Vision Route: Tesla adheres to the pure vision solution and optimizes models through massive real driving data; Mobileye advocates “True Redundancy™”, emphasizing parallel redundancy between the visual subsystem and radar/imaging radar subsystem.
-
TOPS Competition: Pure computing power is not the decisive factor. Mobileye has the advantage of “production-ready system” in actual mass production through software-hardware collaboration and algorithm optimization.
| Indicator | Value/Status | Interpretation |
|---|---|---|
| Latest Closing Price | $21.70 (2025-01-03) | This date is earlier than the real-time quote time |
| Beta | 0.53 | Relative volatility is lower than the market |
| MACD | no_cross (Bullish) | No clear crossover signal yet |
| KDJ | K:85.0, D:77.4, J:100.2 | Overbought Warning |
| RSI (14) | Overbought Risk | Note: Value not provided, only signal marked |
| Time Period | Performance |
|---|---|
| 1 Day | +7.57% |
| 1 Month | -4.02% |
| 3 Months | -23.45% |
| 6 Months | -39.00% |
| 1 Year | -48.60% |
-
2026 Robotaxi Commercialization: The autonomous driving version of ID.Buzz in cooperation with Volkswagen is planned to be launched in 2026 to verify its Drive platform [3].
-
Robotaxi and Fleet Cooperation: Cooperation with Lyft on projects such as 15-seat autonomous shuttles is expected to open up the B-end market [3].
-
New SoC Platforms like EyeQ6: Stronger integration and energy efficiency are expected to improve gross margin and OEM penetration.
-
AI Mobility Market Size: Expected CAGR of ~21.8%, Mobileye’s ADAS share and cost advantages give it long-term space in the mass market [3].
-
China Market Demand: China’s autonomous driving and intelligent connected policies continue to advance, which is expected to drive demand for ADAS and high-level intelligent driving.
-
Technical Route Competition:
- LiDAR cost continues to decline, which may weaken Mobileye’s “vision-first” cost advantage.
- Multi-sensor fusion is gradually becoming a consensus in the high-end market, so it is necessary to accelerate fusion capabilities.
-
Tesla FSD and NVIDIA Drive Ecosystem: The experience of versions like FSD V13 has improved, and NVIDIA and Uber and other ecosystem partners are accelerating Robotaxi layout, which may squeeze Mobileye’s space in the high-end and operational markets.
-
Automotive Cycle Slowdown: The slowdown in global auto demand will affect the installation rhythm of ADAS chips.
-
Geopolitics: China’s localization substitution is accelerating, which may compress Mobileye’s share in China.
-
Valuation and Fundamental Disconnect: Although DCF shows significant upside potential, if profit improvement is less than expected, valuation expansion may be limited.
-
Valuation Safety Margin: P/B=0.77 provides protection for value investors; the median intrinsic value of DCF three scenarios is $72.59, and the probability-weighted value is $86.58, with significant upside potential [0].
-
Industry Leading Position: ADAS market share exceeds 50%, with mature mass production system and large-scale delivery experience [2].
-
Strong Cash Flow: Free cash flow margin reaches 28.4% (Q3 2025), which is rare among tech growth stocks [0].
-
Long-Term Growth Visibility: Sales agreements from 2024 to 2027 are about $7.4 billion, and the AI mobility market CAGR of ~21.8% provides industry-level growth momentum [2,3].
-
Technical Route Flexibility: Through imaging radar and “True Redundancy” system, it balances cost and safety, adapting to different price points and regional markets.
-
Batch Position Building:
- First Batch: Current price (~$11)
- Second Batch: Add positions in the $10-11 range
- Third Batch: Below $9 (if further correction occurs)
-
Target Price:
- Conservative Target: $18 (analyst consensus median)
- Base Target: $22-25 (near 52-week high, also close to technical analysis resistance of $21.89)
- Aggressive Target: $30+ (if Robotaxi is successfully launched and delivered)
-
Stop-Loss Level: $9 (close to the 52-week low of $10.04, with additional buffer considered)
-
Long-Term Value Investors:Strong Buy. Anchor on valuation and cash flow, ignore short-term fluctuations, hold until Robotaxi/high-level intelligent driving is large-scale deployed.
-
Growth Investors:Buy. Focus on revenue growth rate and new platform progress rhythm; short-term fluctuations provide opportunities to add positions.
-
Short-Term/Trend Traders:Wait and See/Small Position Participation. Currently, there is data inconsistency in the technical aspect (technical analysis closing price is higher than real-time quote), so it is necessary to wait for a clearer trend (breakthrough and confirmation of $21.89, or stabilization after correction to the $19-20 range).
- EyeQ chip shipment volume and average selling price (ASP)
- Free cash flow and adjusted EBITDA margin
- Milestone progress of Robotaxi projects such as Volkswagen/Lyft
- New OEM orders and changes in regional revenue structure
- Commercialization progress of the autonomous driving version of ID.Buzz in 2026
- China market share and localization substitution progress
- LiDAR cost curve and iteration speed of competitors’ multi-sensor solutions
- Real-time quote shows the latest closing price as $11.23 on 2026-01-05 [0].
- Technical analysis charts and indicators are based on the interval from 2024-01-01 to 2025-01-05, with the latest closing price marked as $21.70 on 2025-01-03 [0].
- The DCF model shows “Current Price: $11.23” in the company overview, which has time and price inconsistencies with the latest closing price in the technical analysis, suggesting different calibers/time points of different datasets.
- This report does not constitute any trading advice; investors should make independent decisions based on the latest public information and their own risk tolerance.
[0] Jinling API Data
[1] AInvest - “Mobileye’s Q3 2025 Outperformance and Autonomous Driving Catalysts: Why Now Is the Time to Rebalance Exposure to AI-Driven Mobility Innovators” (2026-01-01), https://www.ainvest.com/news/mobileye-q3-2025-outperformance-autonomous-driving-catalysts-time-rebalance-exposure-ai-driven-mobility-innovators-2601/
[2] Substack - “Bolt’s 100,000 Robotaxi Ambition, Waymo 450k Weekly Rides, Tesla …” (Industry and Competitive Analysis), https://avmarketstrategist.substack.com/p/bolts-100000-robotaxi-ambition-waymo
[3] Motley Fool - “Best Electric Car Stocks of 2026” (Industry Sector and Company List), https://www.fool.com/investing/stock-market/market-sectors/consumer-discretionary/automotive-stocks/electric-car-stocks/
Insights are generated using AI models and historical data for informational purposes only. They do not constitute investment advice or recommendations. Past performance is not indicative of future results.
About us: Ginlix AI is the AI Investment Copilot powered by real data, bridging advanced AI with professional financial databases to provide verifiable, truth-based answers. Please use the chat box below to ask any financial question.