In-Depth Interpretation of Market Signals: Shanghai and Shenzhen Stock Markets' Trading Volume Surpassing 1.5 Trillion Yuan
Unlock More Features
Login to access AI-powered analysis, deep research reports and more advanced features
About us: Ginlix AI is the AI Investment Copilot powered by real data, bridging advanced AI with professional financial databases to provide verifiable, truth-based answers. Please use the chat box below to ask any financial question.
Based on the obtained market data and news information, I have prepared a comprehensive market analysis report for you:
According to the latest market data,
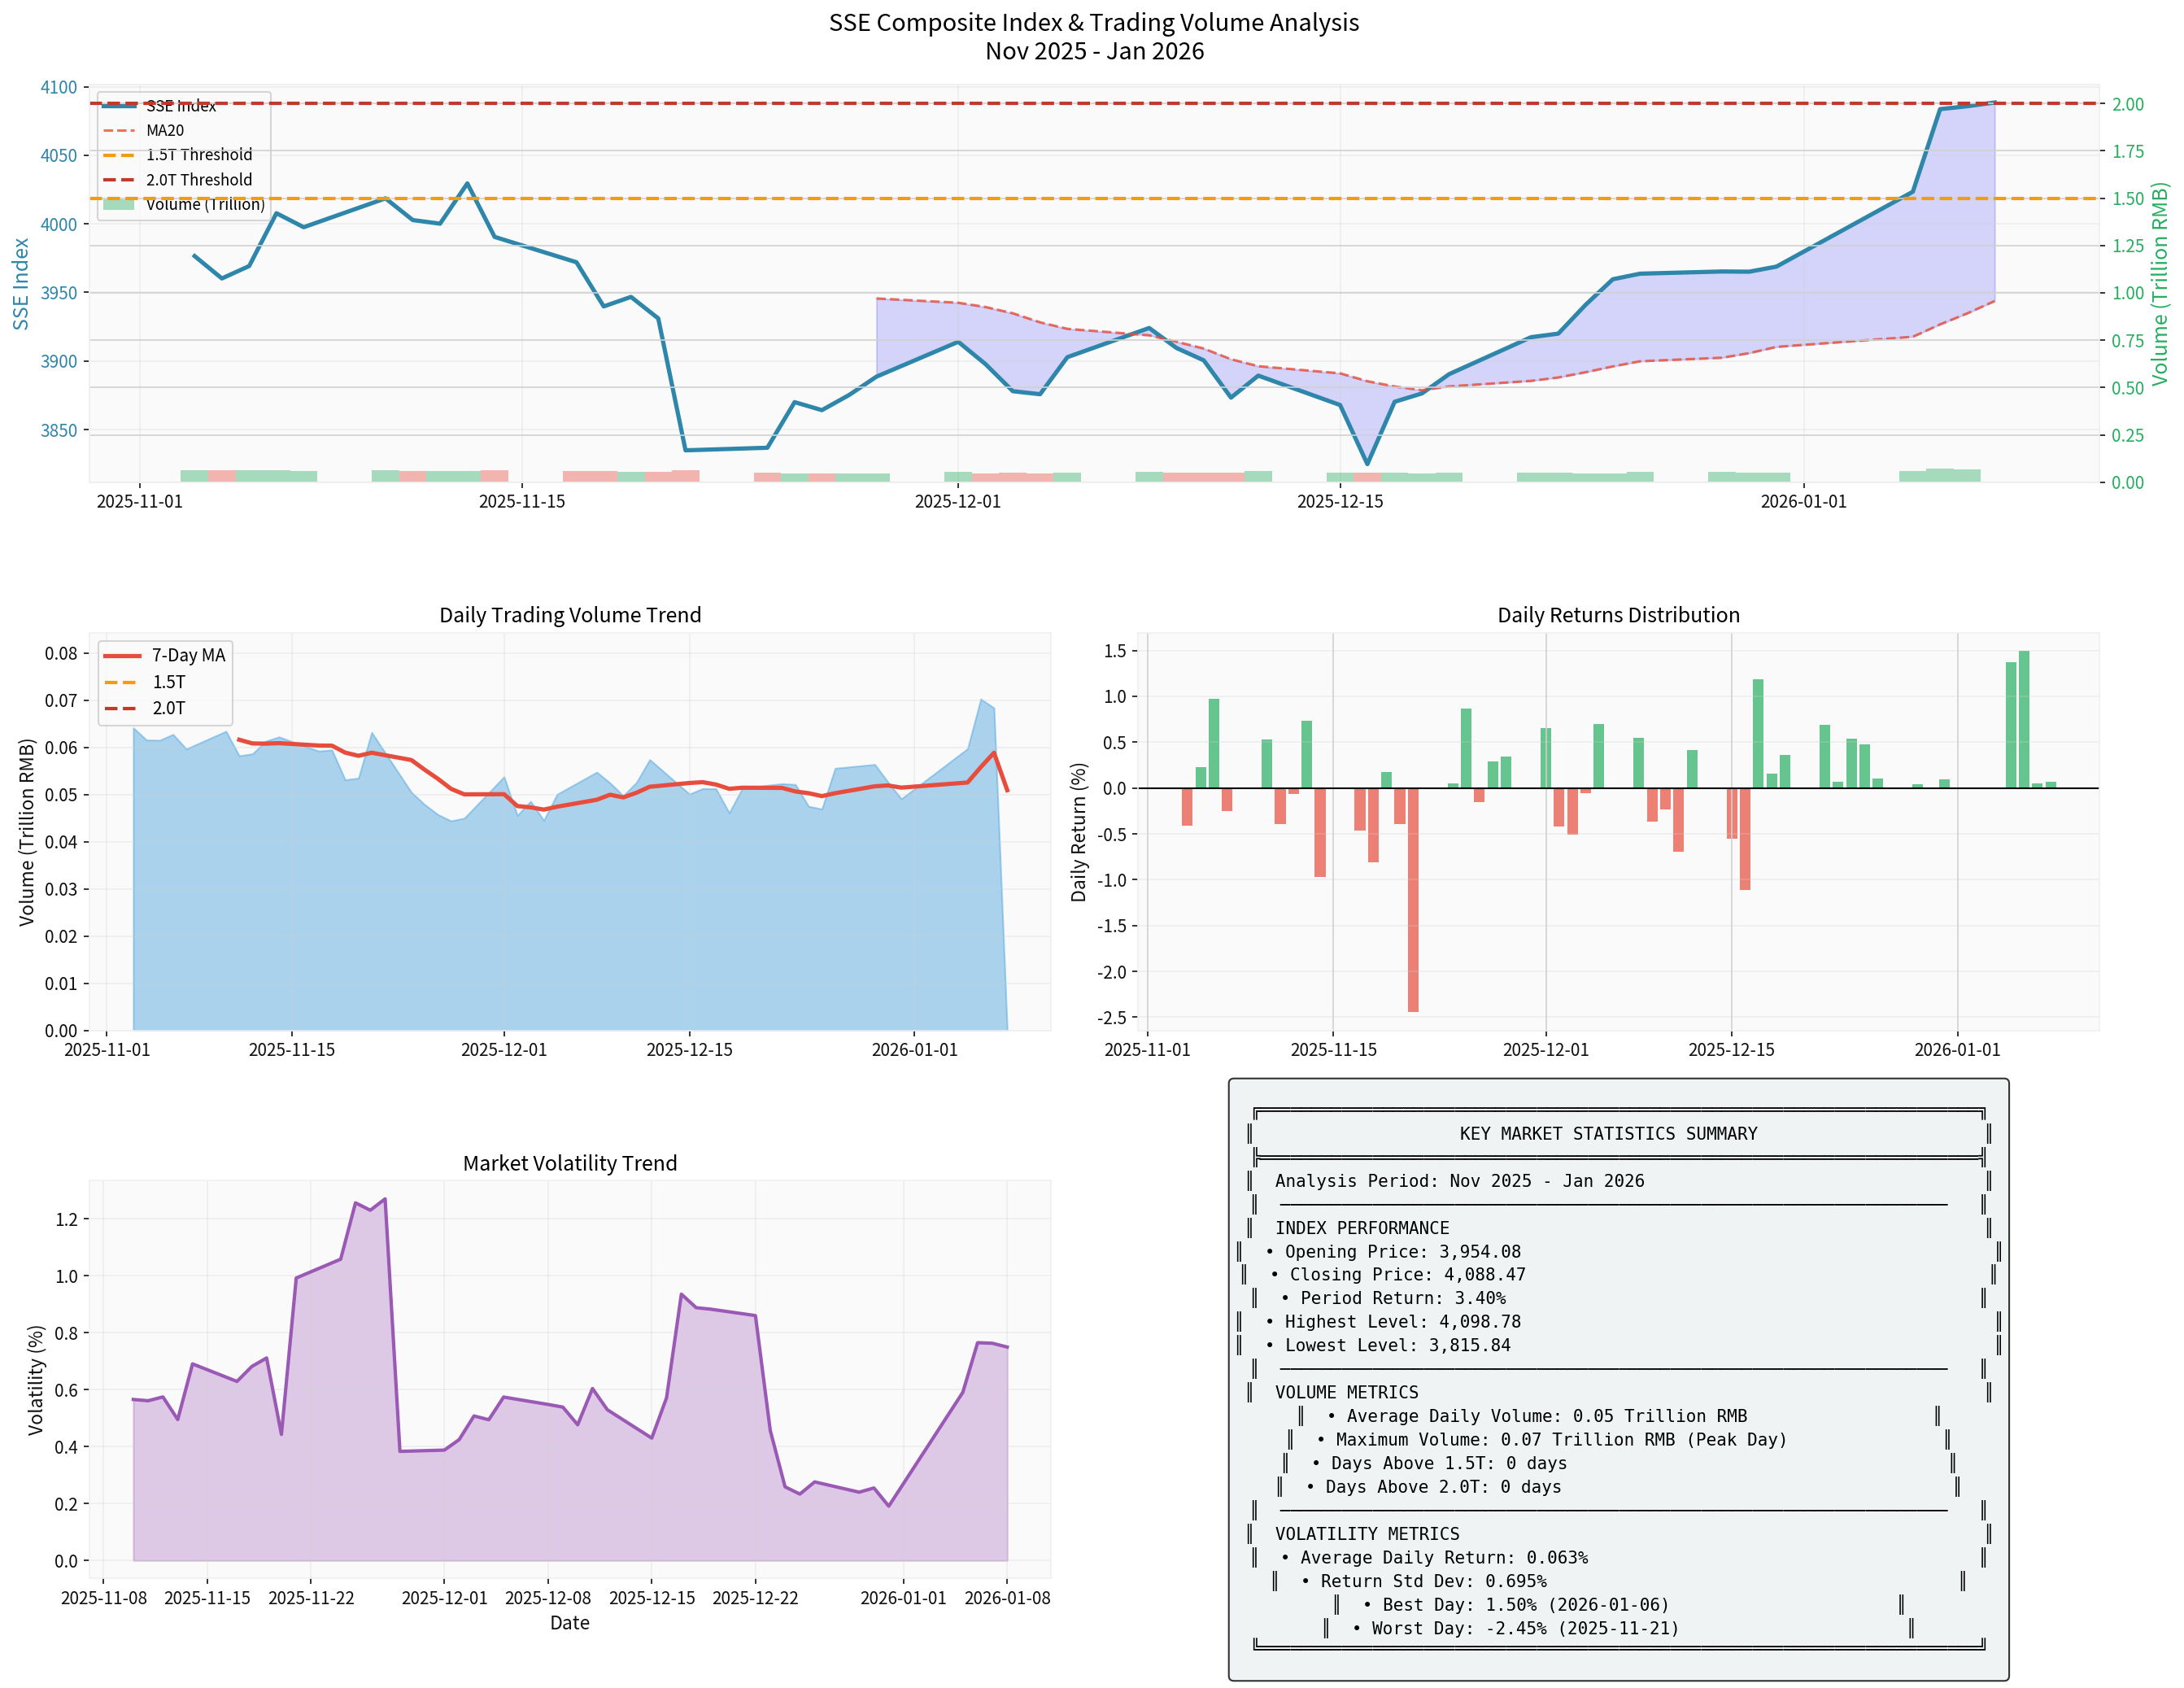
The Shanghai Composite Index performed strongly from November 2025 to January 2026, with a cumulative increase of
Current market capital activity is at a historical high, with
| Capital Indicator | Value | Significance |
|---|---|---|
| Margin Trading Balance | 2.56 Trillion Yuan | Historical High |
| Financing Balance | 2.52 Trillion Yuan | Historical High |
| Single-Day Financing Increase | Over 19 Billion Yuan (Jan 5) | Strong Willingness of Leveraged Funds to Enter the Market |
The continuous growth of leveraged funds reflects a significant recovery in market confidence, with strong willingness among investors to enter the market with leverage. Sectors such as power equipment and basic chemicals have become key areas for leveraged fund allocation[1].
Against the backdrop of the Federal Reserve’s rate cut cycle and the weakening U.S. dollar,
- Northbound Capital’s single-day trading volume once exceeded 318.5 billion yuan
- Net bought over 8 billion yuan in the AI industry chain during the first trading week of 2026
- International institutions such as Goldman Sachs and JPMorgan have raised their ratings on the Chinese market
The
- Bank wealth management redemption funds and savings funds continue to flow into the stock market
- Retail investor account openings rose 37%day-on-day
- The total scale of technology-themed ETFs exceeded 1.05 trillion yuan, accounting for17.41%of the total ETF market size
- The scale of “Fixed Income +” funds grew explosively, reaching 2.28 trillion yuanin total management scale as of the end of Q3
Multiple policy benefits are important supports for this round of market rally:
- Deepening Capital Market Reforms: The regulatory authorities’ policy “combination punches” focus not only on short-term market stabilization but also on long-term momentum enhancement
- Stepped-Up Stable Growth Policies: Increased support for sectors such as technology and new energy
- “National Team” Increased Holdings: Medium- to long-term funds such as social security funds continue to enter the market
Quantitative trading’s contribution to market trading volume continues to increase. According to data,
Data as of December 25, 2025, shows that the A-Share market’s 2025 annual total trading volume reached
In the first half of 2025, China’s GDP grew
Although overall trading is hot, the market is not universally strong, with obvious
- On December 26, 2025, over 3900 stocks fell intraday, showing a typical divergence pattern of “stable index, falling stocks”
- Capital is concentrated on a few hot themes for rapid rotation, rather than broad-based buying
- Consecutive limit-up stocks frequently break their limits, exposing risks of local sentiment restlessness and increasing divergence
| Sector/Index Type | 2025 Growth | Performance Characteristics |
|---|---|---|
| ChiNext Index | 49.57% |
Strongest |
| BEIXIN 50 Index | 38.80% |
Strong |
| STAR 50 Index | 35.92% |
Strong |
| Shanghai Composite Index | 18.41% |
Steady |
| Non-ferrous Metals | 94.73% |
Top Industry Gainer |
| Communications | 84.75% |
Second-Highest Industry Gainer |
| Electronics | 47.88% |
Third-Highest Industry Gainer |
Trading volume is highly concentrated in stocks of the technology and new energy tracks. A total of
- Continued Loose Liquidity Environment: The trend of resident savings continuing to shift to financial assets remains unchanged
- Increased Foreign Capital Allocation Willingness: RMB assets have obvious valuation advantages, and international institutions remain optimistic
- Unabated Policy Support: The dividends of capital market reform continue to be released
- Driven by Industrial Upgrading: Profit realization in the technology industry provides endogenous driving force
- Increased Volatility Risk: Historical data shows that after 43 consecutive trading days of over 1 trillion yuan in trading volume from May to July 2015, the market corrected sharply due to fundamental deterioration[2]
- Technical Correction Pressure: If the index fails to break through effectively in the future, heavy trading volume may trigger a technical correction
- Impact of Quantitative Trading: High-frequency strategies have obvious operational characteristics, which may exacerbate market volatility
- Concentrated Structural Risks: Excessive capital concentration in a few hot sectors increases the risk of adjustments
Based on current market characteristics, it is recommended to focus on the following investment directions:
- AI Industry Chain: AI chips, large model applications, computing infrastructure
- Commercial Aerospace: Satellite internet, rocket launches, aerospace materials
- Memory Chips: Benefiting from the explosive growth in computing power demand
- New Energy: Photovoltaics, energy storage, electric vehicle industry chain (key layout area for leveraged funds in the power equipment sector)
- Electronics: Semiconductors, consumer electronics innovation
- Financial Sector: Securities, insurance (key target area for Northbound Capital’s aggressive buying)
- Non-Ferrous Metals: Benefiting from global economic recovery expectations (top gainer in 2025)
- Optional Consumption: Automobiles, home appliances
- Pharmaceutical and Medical: Innovative drugs, medical devices
| Strategy Type | Recommended Actions | Risk Notes |
|---|---|---|
| Trend Following | Follow the trend, focus on strong sectors with sustained trading volume growth | Set stop-loss, avoid chasing highs |
| Value Investing | Allocate undervalued blue chips, wait for valuation repair | Requires patient holding |
| Growth Allocation | Focus on core targets in technology growth tracks | High volatility, control position size |
| Balanced Allocation | Balance allocation of growth + value + consumption | Reduce portfolio volatility |
- Control Position: As market volatility increases, it is recommended to maintain a moderate position
- Diversify Investments: Avoid excessive concentration in a single sector or individual stock
- Monitor Liquidity: Trading volume is an important leading indicator, which requires continuous attention
- Set Stop-Loss: For stocks bought on rallies, set a reasonable stop-loss level
- Rational Participation: Avoid being swayed by market sentiment, maintain independent judgment
The Shanghai and Shenzhen Stock Markets’ trading volume exceeding 1.5 trillion yuan is the result of multiple factors working together, reflecting a significant increase in market capital activity. From historical experience, heavy trading volume is often accompanied by increased market volatility, but this round of heavy trading volume has lasted for a long time, and resonates with factors such as improved fundamentals, policy support, and industrial upgrading. In the medium term, the market still has the basis to continue strengthening.
For subsequent investments, it is recommended to
[1] 1.5 Trillion Yuan Trading Volume Becomes Normal! A-Share Volume Surges, Who Is Aggressively Buying? - Caifuhao
[2] A-Shares Exceed 1 Trillion Yuan in Trading Volume for 153 Consecutive Days! Single-Day Trading Volume Hits 2.9 Trillion Yuan - Caifuhao
[3] A-Shares’ 14 Consecutive Positive Closes Create History: Deep Logic and Historical Inevitability Under Multiple Resonances - Caifuhao
[4] Huaxi Securities 2026 Investment Strategy - Huaxi Securities
[5] A-Share Slow Bull Enters 2026 - NetEase Finance
[6] 2025 Financial Market Year-End Review Part III: A-Shares Broke Multiple Records in 2025, Slow Bull Expected in 2026 - Securities Times Network
Insights are generated using AI models and historical data for informational purposes only. They do not constitute investment advice or recommendations. Past performance is not indicative of future results.
About us: Ginlix AI is the AI Investment Copilot powered by real data, bridging advanced AI with professional financial databases to provide verifiable, truth-based answers. Please use the chat box below to ask any financial question.