ICON plc Investment Analysis Report: Strategic Transformation and Valuation Restructuring Amidst Slowing Growth
Unlock More Features
Login to access AI-powered analysis, deep research reports and more advanced features
About us: Ginlix AI is the AI Investment Copilot powered by real data, bridging advanced AI with professional financial databases to provide verifiable, truth-based answers. Please use the chat box below to ask any financial question.
Related Stocks
Now let me prepare a comprehensive investment analysis report for you.
ICON plc (NASDAQ: ICLR) is an Ireland-based leading global medical intelligence and clinical research organization (CRO) that provides outsourced R&D services to pharmaceutical, biotechnology, medical device companies, and government public health institutions [0]. The company currently has a market capitalization of approximately $15.5 billion and ranks among the top players in the global CRO industry.
| Business Segment | Revenue Contribution | Strategic Positioning |
|---|---|---|
| Clinical Research Services | 92.3% | Core business covering Phase I-IV clinical trials |
| Central Laboratory Services | 7.7% | Supporting business to enhance integrated service capabilities |
| Region | Revenue Contribution | Market Characteristics |
|---|---|---|
| United States | 43.6% | Largest single market with strong demand for innovative drug R&D |
| Ireland | 34.8% | European headquarters, leveraging tax advantages and operating hub |
| Rest of Europe | 21.6% | Mature market with steady growth |
As of January 7, 2026, ICON’s stock closed at
| Metric | Value | Industry Comparison | Assessment |
|---|---|---|---|
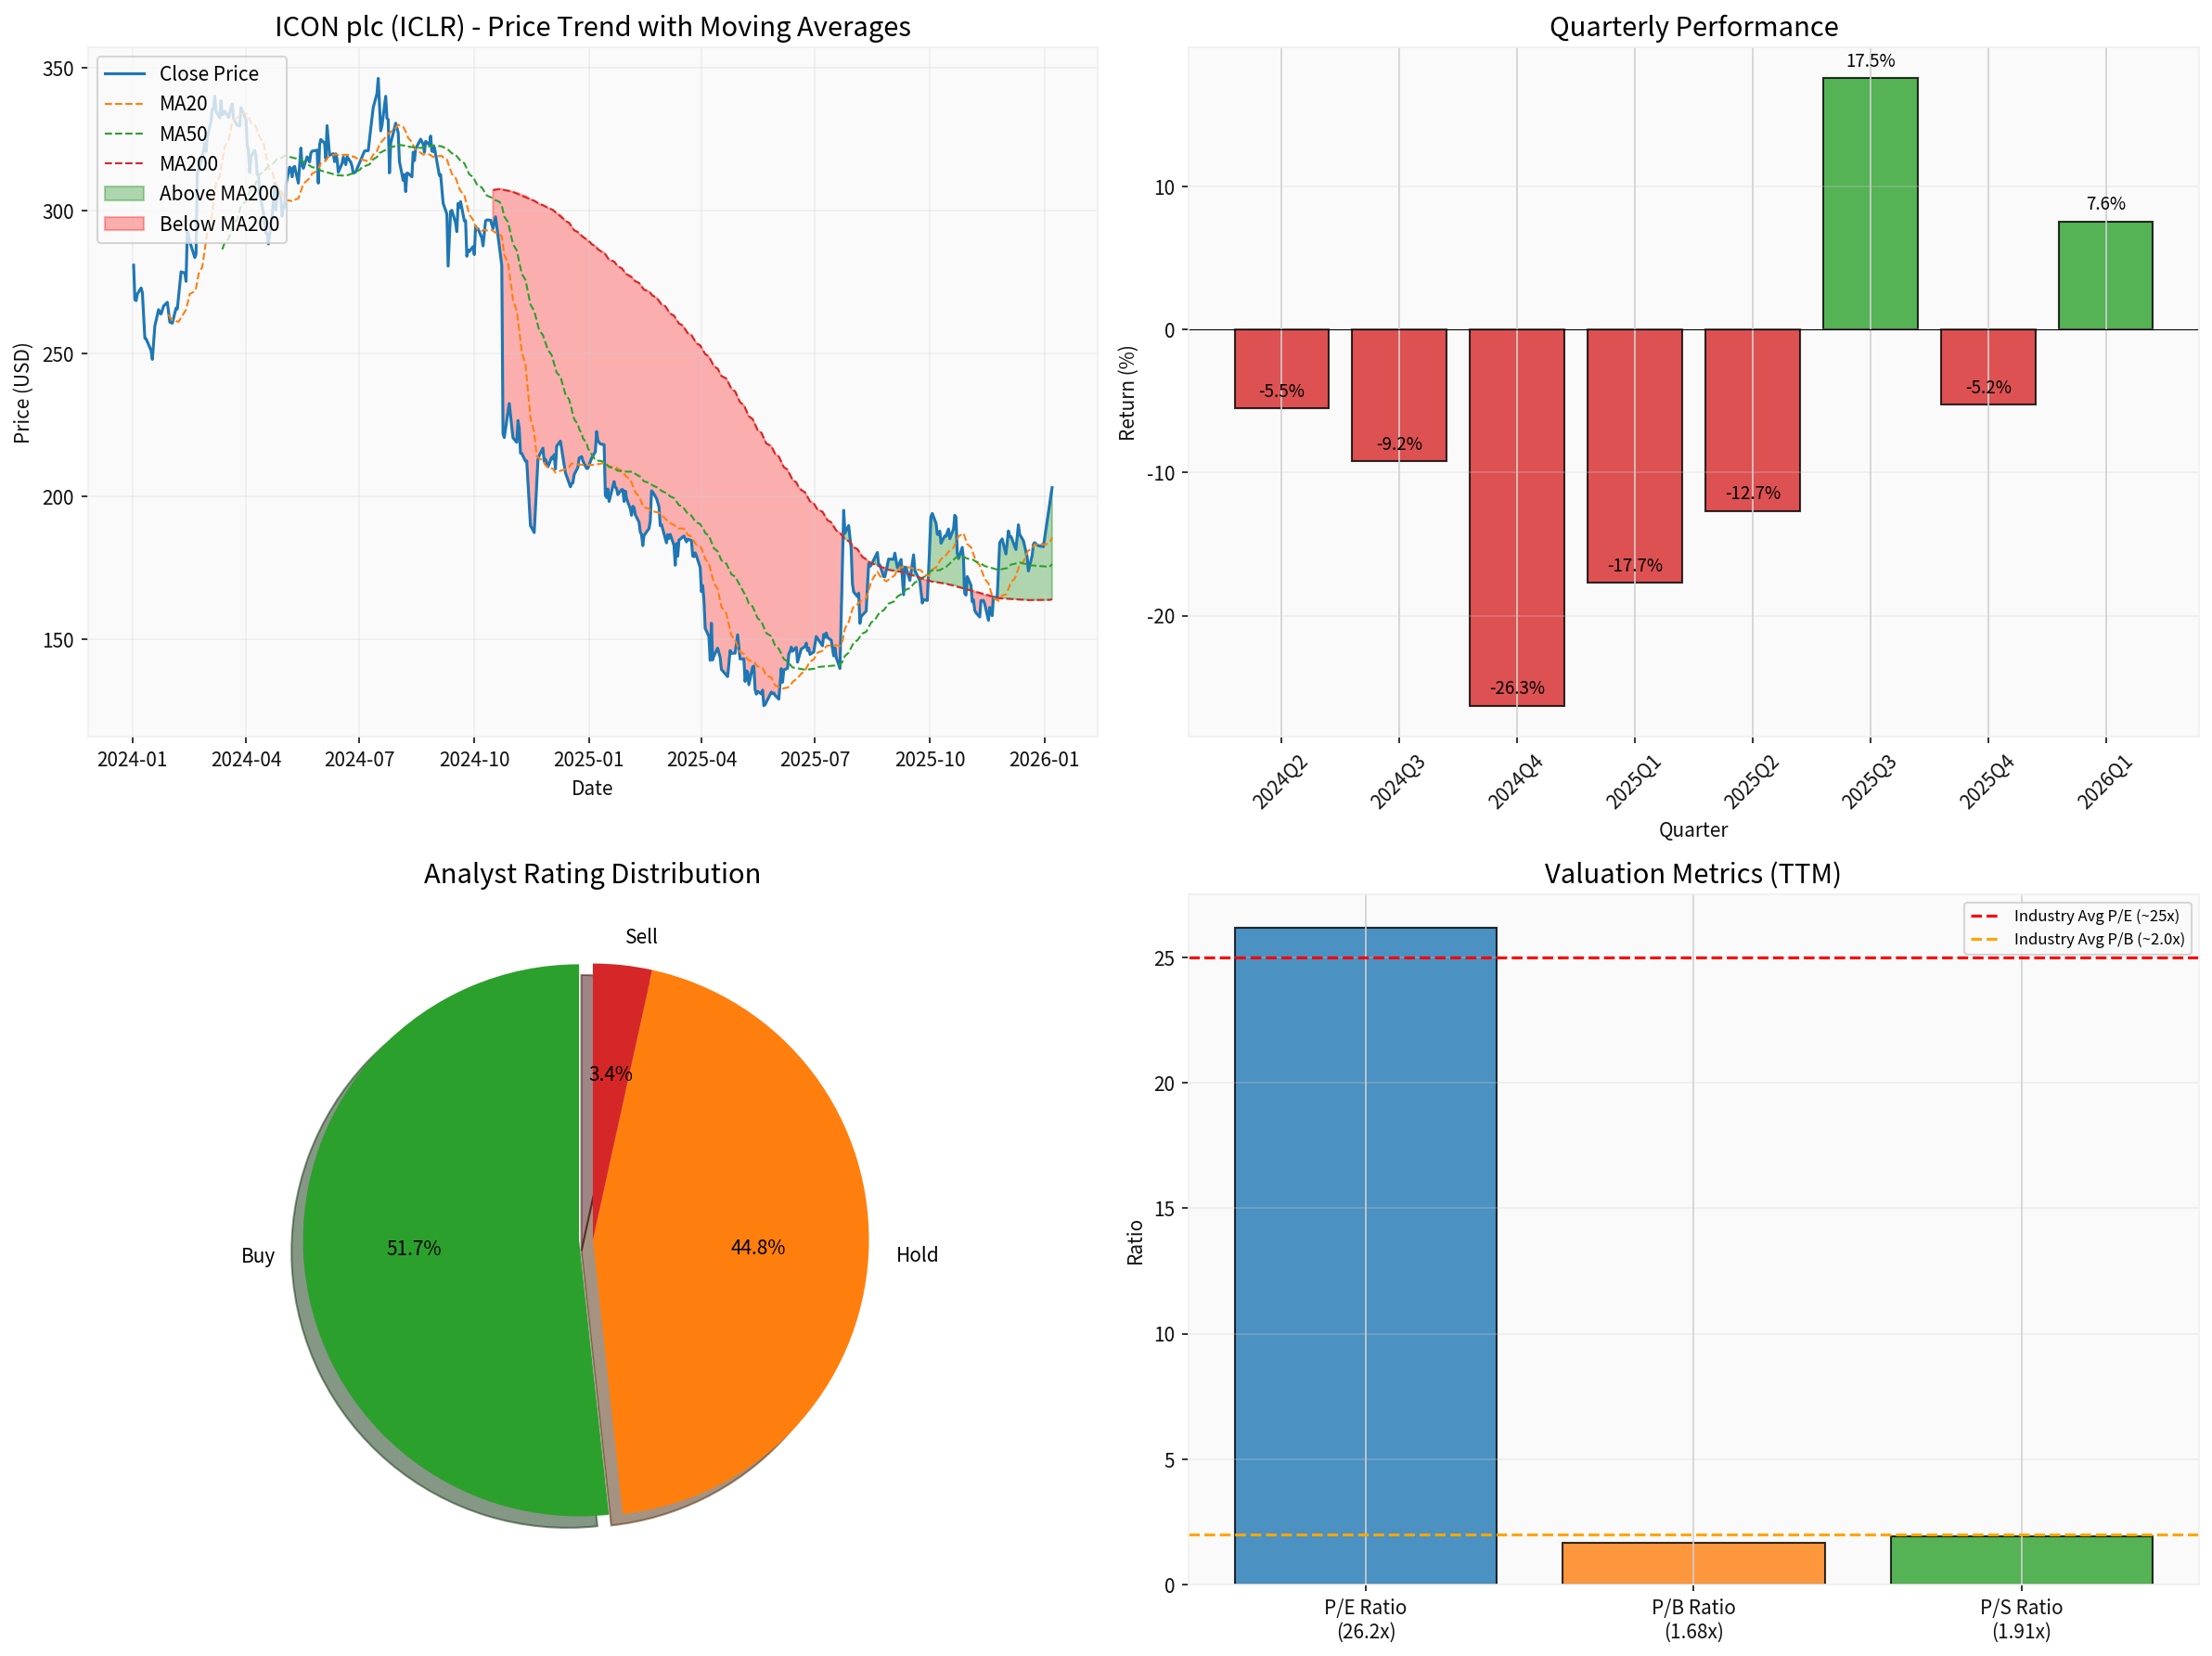
| P/E (TTM) | 26.2x | ~25x | Slightly above industry average |
| P/B | 1.68x | ~2.0x | Trading at a discount |
| P/S | 1.91x | - | Moderate level |
| Beta | 1.26 | 1.0 | Higher than market volatility |
| ROE | 6.32% | - | Moderate return level |
| Net Profit Margin | 7.40% | - | Stable profitability |
| Current Ratio | 1.06 | >1.0 | Sufficient liquidity |
| Period | Change | Assessment |
|---|---|---|
| 5-Day | +10.31% | Strong rebound |
| 1-Month | +11.43% | Robust short-term momentum |
| 6-Month | +33.87% | Upward medium-term trend |
| YTD | +7.55% | Strong start to the year |
| 1-Year | -7.49% | Long-term pressure |
The current stock price is at the
Truist Securities downgraded ICON’s rating from “Buy” to “Hold”, reflecting structural concerns about the company’s growth prospects [1]. This rating adjustment is not an isolated incident, but rather one of multiple downgrades—since 2024, several renowned institutions have successively downgraded ICON’s rating:
| Date | Institution | Action | Rating Change | Target Price |
|---|---|---|---|---|
| 2025-12-15 | BofA Securities | Downgraded | Buy→Neutral | $195 |
| 2025-11-13 | BMO Capital Markets | Initiated Coverage | Market Perform | $175 |
| 2025-09-09 | Jefferies | Downgraded | Buy→Hold | $175 |
| 2025-08-21 | Citigroup | Downgraded | Buy→Neutral | $200 |
| 2025-04-14 | TD Cowen | Downgraded | Buy→Hold | $157 |
| 2025-04-10 | Barclays | Downgraded | Overweight→Equal Weight | $165 |
| 2025-03-21 | Goldman Sachs | Downgraded | Buy→Neutral | $250→$200 |
- Buy (including Overweight): 51.7% (15 analysts)
- Hold: 44.8% (13 analysts)
- Sell: 3.4% (1 analyst)
The consensus target price is
The financing environment for the biotech industry has continued to tighten since 2022. Although there were signs of stabilization in 2025, R&D expenditure growth has not returned to historical highs. As an upstream service provider in the CRO industry, ICON is directly affected by the R&D budgets of its biotech clients.
The CRO industry is undergoing profound changes, with leading enterprises accelerating integration:
- Increased market concentration: The four giants (IQVIA, Thermo Fisher (PPD), ICON, Medpace) continue to expand their market share
- Technological arms race: AI-driven trial design, patient recruitment optimization, and remote monitoring have become core competitive strengths
- Fierce regional competition: CRO enterprises in the Asia-Pacific region (especially China) are rapidly rising due to cost advantages
ICON’s clinical research business has a long execution cycle, and the time lag from order to revenue conversion leads to revenue growth lagging behind improvements in order flow. In addition, the clinical trial cancellation rate has remained high during and after the pandemic, putting pressure on revenue recognition.
According to the company’s Q3 2025 earnings call, management has identified four strategic pillars [3]:
- Biotechnology market penetration: Expand opportunity flow and win rate among biotech clients
- Diversification of large pharmaceutical business: Reduce reliance on single clients and deepen cooperation with large pharmaceutical companies
- Mid-market expansion: Capture the middle market segment with the fastest-growing market share
- Optimize operational efficiency and control SG&A expenditure growth
- Leverage technology platforms to reduce marginal service costs
- Promote automation and digitalization to improve gross profit margin
In January 2025, ICON launched a portfolio of AI tools, including:
- AI-driven trial protocol design
- Predictive patient recruitment modeling
- Automated data review and quality control
- Remote monitoring and virtual visit support
This technological investment aims to improve trial efficiency, shorten R&D cycles, and reduce client costs [2].
- Maintain a strong balance sheet (current ratio of 1.06, healthy net cash position)
- Balance reinvestment and shareholder returns
- Strategic mergers and acquisitions to fill capability gaps
- Share repurchases and dividends (moderate)
Management has specifically emphasized three growth engines for 2026 [4]:
| Therapeutic Area | Strategic Positioning | Growth Driver |
|---|---|---|
Oncology |
Core growth pole | Sustained high R&D investment, precision medicine advancements, demand for combination therapies |
Rare Diseases |
High-value niche | Regulatory accelerated pathways, high pricing power, unmet medical needs |
Advanced Therapies |
Cutting-edge layout | Cell/gene therapies, mRNA technology, personalized treatment |
ICON is promoting the transformation to a “Design & Execution” partnership model, shifting from traditional transactional services to in-depth strategic cooperation [5]:
- Joint innovation agenda: Co-develop new methodologies and tools with clients
- Patient-centric integration: Incorporate patient experience into the core considerations of trial design
- Trust building: Establish long-term partnerships through transparency, real-time data sharing, and measurable performance
The CRO industry is in its most profound transformation period in two decades, with multiple forces reshaping the competitive landscape [2]:
Artificial intelligence has moved from the pilot phase to the core infrastructure of clinical R&D:
- Trial protocol design: AI-assisted protocol optimization to reduce protocol amendment rates
- Feasibility modeling: Predict enrollment speed and research center performance
- Patient targeting: Precisely match patient pools with trial inclusion/exclusion criteria
- Data review: Automated quality control and anomaly detection
The World Health Organization’s (WHO) 2025 “Global Action Plan for Strengthening Clinical Trial Ecosystems (GAP-CTS)” has further promoted the standardized application of AI tools [2].
The Asia-Pacific region is becoming a core hub for global clinical trials:
- Market size: Approximately $11-12 billion in 2024
- Growth forecast: Expected to double by the early 2030s
- Competitive advantages: Fast enrollment, cost advantages, diverse patient pools, mature regulatory system
ICON is increasing its investment in the Asia-Pacific region to capture this structural growth opportunity.
Hybrid clinical trials combining virtual and in-person models have become the standard:
- Remote visits, digital data collection, wearable device monitoring
- Regulatory agencies (FDA, EMA) support the application of innovative methods
- Improve patient accessibility and adherence, and reduce trial costs
| Factor | Mechanism of Impact | Valuation Support |
|---|---|---|
| Technological leadership | AI tool portfolio enhances efficiency premium | Supports P/E ratio above industry average |
| Scale advantage | Fully integrated platform reduces marginal costs | Operating leverage drives profit growth |
| Customer stickiness | Strategic partnership model enhances retention | Improves revenue predictability |
| Industry consolidation | Enhances acquisition and integration opportunities | Potential for external growth |
| Factor | Mechanism of Impact | Valuation Suppression |
|---|---|---|
| Intensified competition | Mid-sized CROs and new Asia-Pacific entrants erode market share | Price pressure erodes gross profit |
| Technological homogenization | Popularization of AI tools weakens differentiation | Narrowing competitive advantages |
| Financing volatility | Biotech clients are sensitive to R&D budgets | Revenue volatility |
| Capital efficiency | Digital transformation requires significant investment | Short-term profit pressure |
| Competitor | Estimated Market Cap | Business Characteristics | Competitive Position |
|---|---|---|---|
IQVIA |
~$50 billion | Leader in medical intelligence + data advantages | Leading in scale but with slowing growth |
Thermo Fisher (PPD) |
~$20 billion | Integrated laboratory + clinical services | Integration effects yet to be realized |
Medpace |
~$8 billion | Mid-sized specialized CRO | High growth but limited scale |
ICON |
~$15.5 billion | Technology-driven, deep therapeutic expertise | Mid-tier positioning with moderate competitive pressure |
Based on technical analysis results [0]:
- Trend type: Upward trend (to be confirmed)
- Trend score: 4.0/5.0 (benchmark 4.5, deducted 0.5 points)
- Signal status: Buy signal triggered on December 24, to be confirmed
| Price Level | Price | Implication |
|---|---|---|
| Resistance Level | $203.91 | Recent high, short-term pressure level |
| Target Level | $210.03 | Short-term technical target |
| Support Level | $188.78 | Key technical support |
- KDJ indicator: K=90.5, D=81.5, J=108.5 → Overbought zone
- RSI: Approaching overbought threshold
- MACD: No death cross signal, but caution is needed for momentum decay
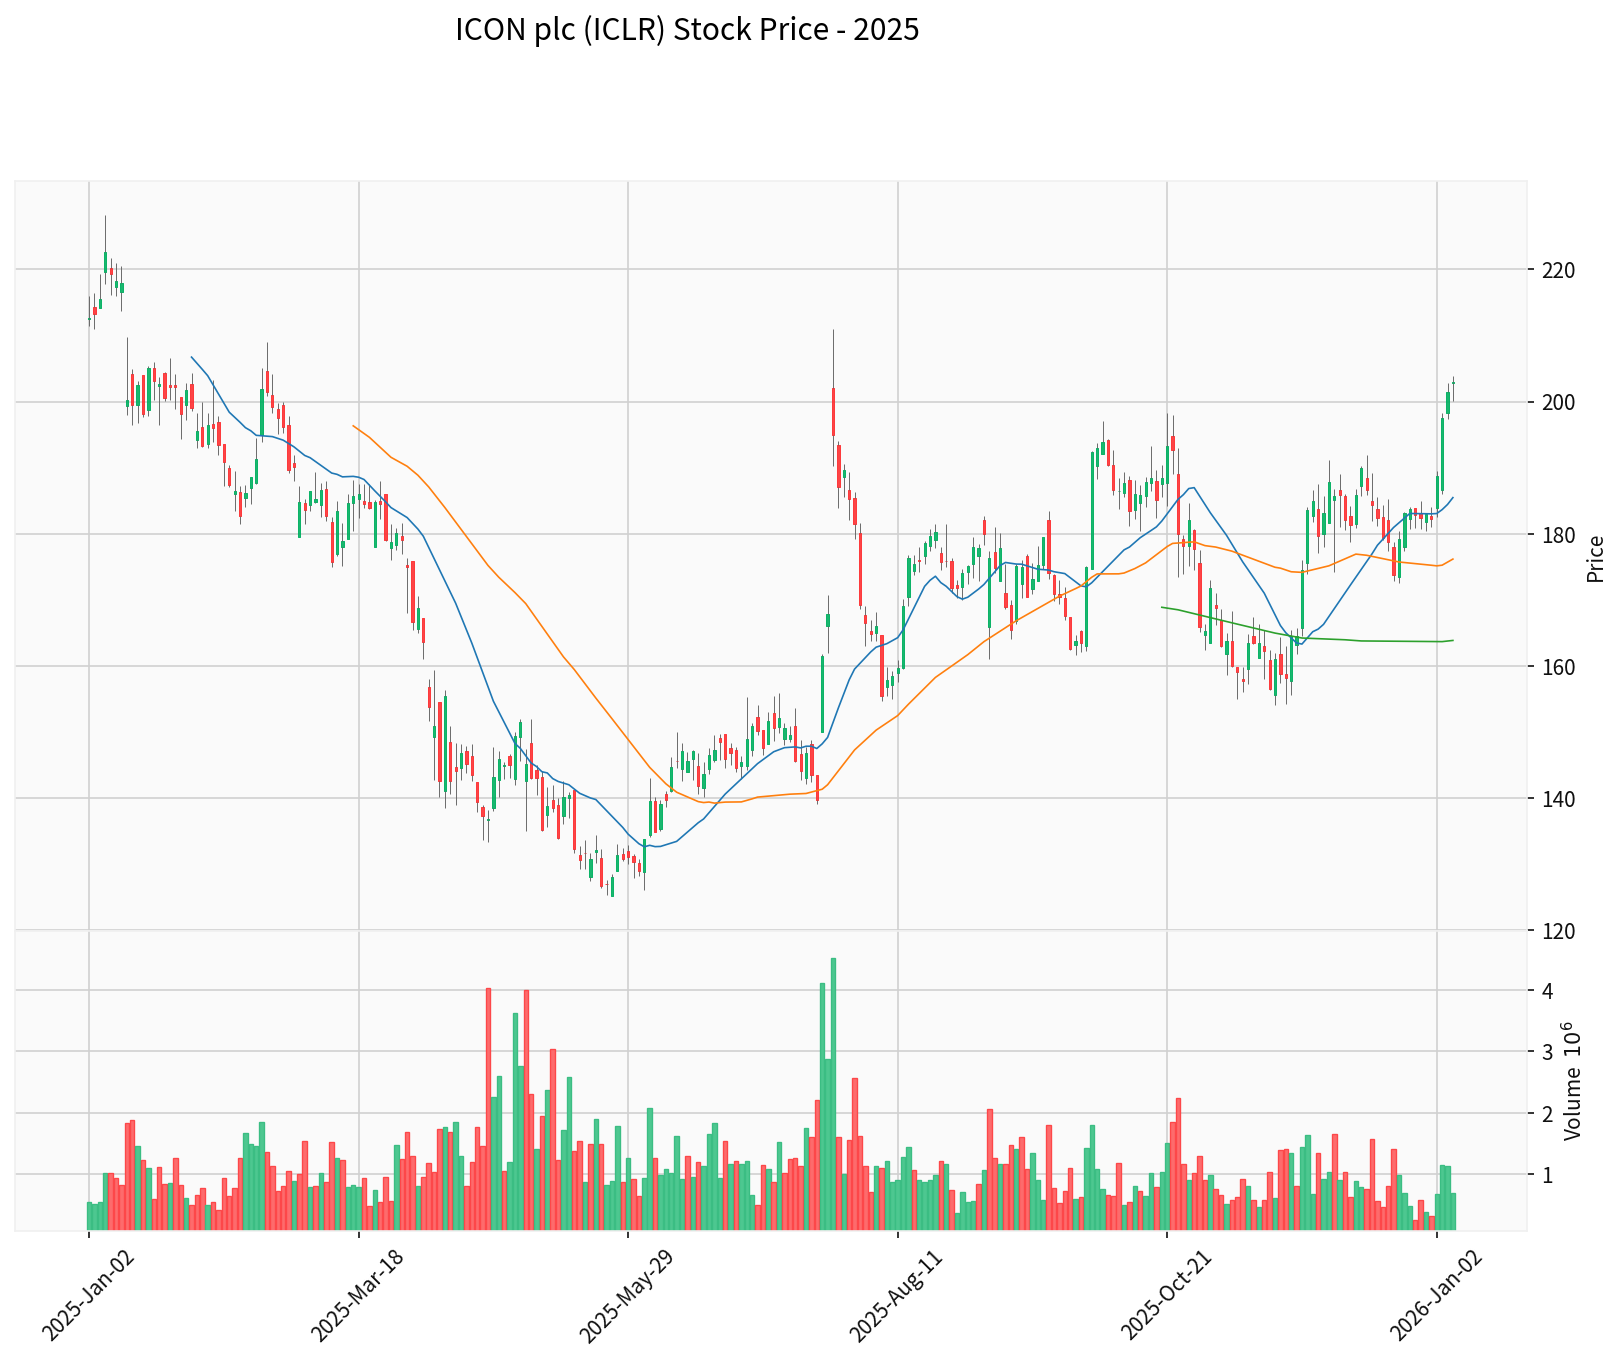
- January-April 2025: Fluctuated downward, falling from above $280 to the $150-160 range
- May-August 2025: Bottom consolidation period, building a support platform
- September 2025 to present: Strong rebound, recovering from below $150 to above $200 (over 35% increase)
| Strategy Type | Recommendation | Rationale |
|---|---|---|
Short-term |
Wait and see/Reduce holdings | In overbought zone, risk of technical pullback |
Medium-term |
Hold/Buy on dips | Upward trend confirmed, solid fundamentals |
Long-term |
Accumulate on dips | Beneficiary of industry consolidation, conversion of technology investments |
- Stop-loss level: $188.78 (near 50-day moving average)
- Take-profit level: $210.03 (short-term target)
- Position management: It is recommended to build positions in batches and avoid chasing highs
- Category: Aggressive
- Characteristics: Low depreciation/capital expenditure ratio
- Interpretation: Upside potential for reported earnings may be limited, need to focus on cash flow quality [0]
- Q3 FY2025 revenue: $2.04 billion (1.56% above expectations)
- EPS: $3.31 (0.91% above expectations)
- Growth trend: Revenue is basically flat year-over-year, with mild quarter-over-quarter growth
- Free Cash Flow (FCF): Approximately $1.12 billion
- Cash flow/net profit ratio: Healthy level
- Risk rating: Low risk
- Robust interest coverage capacity, controllable leverage level
- Net profit margin: 7.40% (moderate level)
- ROE: 6.32% (average)
- Operating profit margin: 12.15% (stable)
| Quarter | EPS | Revenue | Beat Expectations | Assessment |
|---|---|---|---|---|
| Q4 FY2024 | $3.43 | $2.04B | - | Seasonal peak |
| Q1 FY2025 | $3.19 | $2.00B | - | Slowing growth |
| Q2 FY2025 | $3.26 | $2.02B | - | Mild recovery |
| Q3 FY2025 | $3.31 | $2.04B | Yes | Stabilized and rebounded |
- Expected EPS: $3.33
- Market focus: Sustainability of order flow improvement, changes in cancellation rates, 2026 full-year outlook [0]
| Valuation Metric | ICON | Industry Average | Premium/Discount |
|---|---|---|---|
| P/E (TTM) | 26.2x | ~25x | +4.8% |
| P/B | 1.68x | ~2.0x | -16% |
| P/S | 1.91x | - | - |
- Relative P/E is slightly above the industry average, reflecting market expectations of a premium for technological capabilities
- Trading at a P/B discount, which may reflect that expectations of slowing growth have been partially priced in
- Stock price is close to the analyst consensus target price ($220), with limited upside potential
- Beneficiary of industry consolidation: M&A opportunities are expected to drive external growth
- Conversion of technology investments: Efficiency improvements from AI tool portfolio will gradually be reflected in profit margins
- Improved order flow: Positive trends in RFP (Request for Proposal) flow and booking rate for two consecutive quarters
- Strong cash flow: Provides ammunition for shareholder returns and strategic investments
- Uncertainty about growth sustainability: Whether improved order flow can be converted into revenue growth remains to be verified
- Intensified competition: Technological homogenization may compress profit margins
- Macroeconomic uncertainty: Volatility in biotech financing environment affects demand
- Seasonal pressure: Q1 is usually a slow season, and revenue may decline quarter-over-quarter
| Scenario | Valuation Logic | Target Price | Implied Upside/Downside |
|---|---|---|---|
Optimistic |
Sustained improvement in order flow, AI investments deliver results | $250 | +23% |
Neutral |
Mild growth, status quo maintained | $220 | +8% |
Pessimistic |
Slowing growth, intensified competition | $175 | -14% |
ICON plc is responding to the challenge of slowing growth through multi-dimensional strategic adjustments:
- Technological transformation: The launch of the AI tool portfolio reflects a rapid response to technological changes in the industry
- Customer deepening: Transformation from transactional services to strategic partnerships to enhance customer stickiness
- Operational optimization: Strict cost management and cash flow control provide guarantees for shareholder returns
- Growth focus: Clarified three growth engines: oncology, rare diseases, and advanced therapies
However, the full recovery of investor confidence will take time:
- Multiple consecutive quarters of earnings beating expectations are needed to reverse market expectations
- Verification of the conversion of improved order flow into revenue will take 2-3 quarters
- The evolution of the industry’s competitive landscape remains uncertain
- Short-term pressure: Intensified competition and new Asia-Pacific entrants may suppress valuation multiples
- Long-term opportunities: Industry consolidation brings M&A opportunities for leading CROs, and technological leadership is expected to command a premium
- Key variable: AI investment
Insights are generated using AI models and historical data for informational purposes only. They do not constitute investment advice or recommendations. Past performance is not indicative of future results.
About us: Ginlix AI is the AI Investment Copilot powered by real data, bridging advanced AI with professional financial databases to provide verifiable, truth-based answers. Please use the chat box below to ask any financial question.