Investment Value Analysis Report on RPM International (RPM)
Unlock More Features
Login to access AI-powered analysis, deep research reports and more advanced features

About us: Ginlix AI is the AI Investment Copilot powered by real data, bridging advanced AI with professional financial databases to provide verifiable, truth-based answers. Please use the chat box below to ask any financial question.
Related Stocks
Based on the comprehensive data I have collected, I now present to you an in-depth investment analysis report on RPM International.
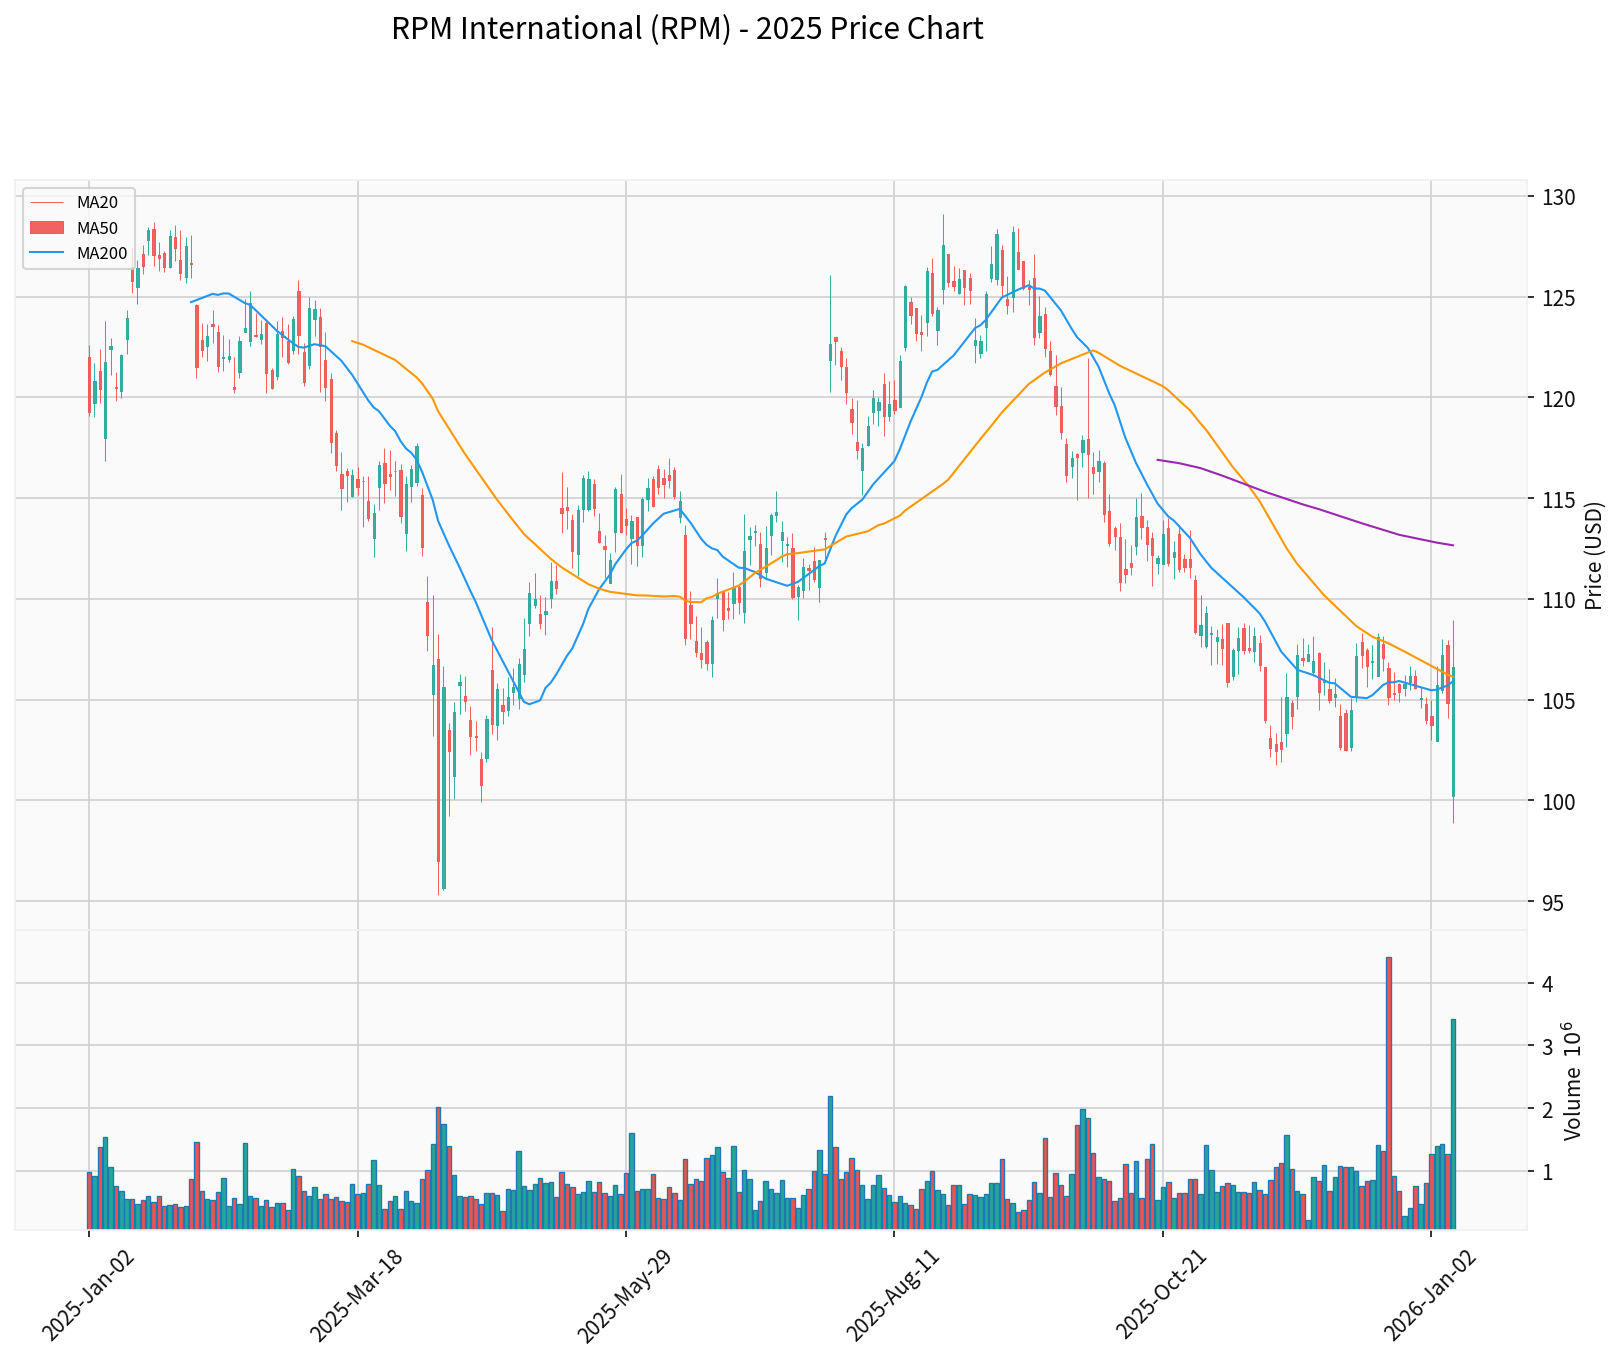
RPM International Inc. is a world-leading manufacturer of specialty chemicals and coatings, headquartered in Ohio, U.S., and listed on the New York Stock Exchange (ticker: RPM). The company currently has a market capitalization of $13.667 billion, a price-to-earnings ratio of 20.34x, and a share price of $106.61[0]. Its operations cover three core segments: Construction Products Group (CPG), Consumer, and Performance Coatings Group (PCG), forming a diversified business portfolio that effectively mitigates cyclical fluctuations in a single market[0].
From a business structure perspective, the Construction Products Group contributes 38.6% of revenue ($737 million), the Consumer segment accounts for 33.4% ($639 million), and the Performance Coatings Group makes up 27.9% ($534 million)[0]. This diversified business structure is one of the company’s key competitive advantages, enabling it to maintain a presence in markets outside the U.S. (which contributes 69.5% of revenue), including Europe (15.9%), Canada (6.6%), Latin America (4.0%), and Asia-Pacific (2.2%)[0].
RPM International boasts a robust brand portfolio, holding leading positions in respective niche markets. The company’s brands cover areas such as construction chemicals, specialty coatings, sealants, adhesives, and consumer DIY products. This brand diversification strategy allows the company to maintain revenue stability across different market cycles[1]. According to the latest quarterly report, the company’s Consumer Segment still achieved business expansion through the acquisition of Star Brands Group despite weak demand in the DIY market[2].
The company’s leading position in specialty coatings is particularly notable. The Performance Coatings Group (PCG) achieved 4.4% total sales growth in the second fiscal quarter, with 2.7% from organic growth, 1.1% from acquisition contributions, and 0.6% benefiting from exchange rate movements[2]. PCG’s growth drivers come from broad-based growth in comprehensive flooring solutions, fire-resistant coatings, protective coatings, food-grade coatings, emerging markets, and fiberglass-reinforced plastic structures.
The company’s MAP 2025 (Margin Achievement Plan 2025) is a key component of its core competitive advantages. This multi-year restructuring initiative aims to improve profit margins by streamlining business processes, reducing working capital, implementing commercial-driven improvements, and enhancing operational efficiency[2]. As of May 31, 2025, the plan has officially concluded, but some projects are still ongoing, with approximately $8.4 million in additional expenses expected in fiscal 2026[2].
The core achievements of the MAP 2025 plan include:
- Procurement Optimization: Cost savings achieved through centralized procurement and supply chain optimization
- Manufacturing Efficiency Improvement: Capacity optimization and cost reduction from plant consolidation
- Commercial Excellence Initiative: Improved sales mix, pricing strategy, and sales team efficiency
In the latest quarter, the benefits from MAP 2025 successfully offset part of cost inflation pressures, including impacts related to tariffs. The company’s gross margin was 40.8%, a decrease of 60 basis points compared to 41.4% in the same period last year, mainly due to reduced fixed cost absorption from lower sales volume and temporary efficiency losses from plant consolidation[2].
RPM International maintains a strong financial position, providing a solid foundation for its continuous investment and strategic acquisitions. As of November 30, 2025:
| Financial Metric | Value | Assessment |
|---|---|---|
| Current Ratio | 2.22 | Very Healthy |
| Quick Ratio | 1.45 | Good |
| Debt-to-Asset Ratio | Moderate | Prudent Management |
| ROE | 22.70% | Excellent |
| Net Profit Margin | 8.79% | Stable |
The company’s current operating cash flow is $583 million, a 10.5% increase from $528 million in the same period last year[2]. Sufficient cash inflow enables the company to continue strategic investments, pay dividends ($133.7 million in semi-annual dividends), and repurchase shares ($35 million)[2].
The company’s free cash flow performance remains robust. For the six months ended November 2025, net cash flow from operating activities was $583 million, capital expenditures were $112 million, and free cash flow was approximately $538 million[2]. This strong free cash flow provides a sustainable funding source for the company’s dividend growth, share repurchases, and strategic acquisitions.
The Construction Products Group (CPG) is RPM International’s largest business segment, benefiting from growing infrastructure investment in the U.S. and globally. The company’s roofing systems business serving high-performance buildings achieved strong growth, with 2.4% sales growth in the second fiscal quarter, including 0.8% from organic growth, 0.5% from acquisitions, and 1.1% from favorable exchange rate movements[2].
Federal funds from the U.S. Infrastructure Investment and Jobs Act are being gradually disbursed, supporting construction demand for public infrastructure projects. Additionally, the booming development of data centers and the trend of manufacturing reshoring have created additional demand drivers for the CPG business[1]. The company’s performance in the European market is particularly strong, benefiting from infrastructure upgrades and building renovation projects in the region.
RPM International continues to expand its business through acquisitions. The company has completed multiple strategic acquisitions in fiscal 2026, including the integration of Star Brands Group, which has brought significant revenue growth[2]. In the latest quarter, organic sales in the Consumer segment decreased by 4.7%, but acquisition contributions offset this decline entirely with 8.7% growth, resulting in 4.1% total growth[2].
In terms of geographic expansion, the European market delivered outstanding performance with 13.9% sales growth in the second fiscal quarter, driven primarily by acquisitions and favorable exchange rates. The North American market saw 1.9% sales growth, mainly driven by demand for high-performance building solutions in the U.S.[2]. In emerging markets, Africa and the Middle East led growth, driven by high-performance building and infrastructure projects.
The company’s continuous investment in research and development has created opportunities to enter high-growth niche markets. The Performance Coatings Group’s fire-resistant coatings, protective coatings, and food-grade coatings businesses have all achieved solid growth. The company also focuses on providing customized solutions for data centers, medical institutions, and high-end commercial buildings, where growth rates outpace traditional markets[1].
Growth drivers for the specialty coatings business include:
- Protective Coatings: Increased demand for corrosion protection in industrial equipment and infrastructure
- Fire-Resistant Coatings: Demand driven by stricter building safety regulations
- Food-Grade Coatings: Growing demand for specialized products meeting food safety standards
- Flooring Solutions: Steady demand for commercial and industrial flooring systems
After the conclusion of the MAP 2025 plan, the company is reaping the rewards of operational improvements. Although plant consolidation has caused some temporary efficiency losses in the short term, these measures will significantly enhance the company’s profitability in the medium to long term[2]. The company’s continuous improvements in procurement, manufacturing, and commercial excellence will lay the foundation for future margin expansion.
Management expects inflationary pressures to continue to be reflected in performance in fiscal 2026, but pricing power and cost optimization measures should partially offset these adverse impacts[2].
For the second quarter of fiscal 2026 (ended November 30, 2025), the company achieved:
- Revenue: $1.91 billion, a year-over-year increase of 3.5%
- Net Profit: $161 million
- Diluted Earnings Per Share (EPS): $1.26
- Gross Margin: 40.8%
Despite solid revenue growth, EPS missed market expectations of $1.42 (-14.89% surprise) and revenue missed expectations of $1.93 billion (-0.90% surprise)[0]. Net profit decreased by 12% year-over-year, mainly due to the following factors:
- Increased income tax expense (from $29.5 million to $49.5 million)
- Higher interest expense (from $23.2 million to $28.0 million)
- Rising medical costs and acquisition-related expenses
| Segment | Q2 Revenue | Year-over-Year Change | Pre-Tax Profit | Profit Margin |
|---|---|---|---|---|
| CPG | $737 million | +2.4% | $94.5 million | 12.8% |
| PCG | $534 million | +4.4% | $81.7 million | 15.3% |
| Consumer | $639 million | +4.1% | $101 million | 15.8% |
The PCG and Consumer segments outperformed CPG, reflecting the company’s market position in high-value-added product segments[2].
Based on the DCF valuation model[0]:
| Scenario | Valuation | Relative to Current Price |
|---|---|---|
| Conservative Scenario | $63.26 | -40.7% |
| Base Scenario | $84.85 | -20.4% |
| Optimistic Scenario | $130.56 | +22.5% |
| Probability-Weighted Valuation | $92.89 | -12.9% |
The current market price ($106.61) is slightly higher than the DCF base valuation, but the analyst consensus target price is $122, implying an upside of approximately 14.4%[0]. Evercore ISI maintains an “Outperform” rating[0], reflecting confidence in the company’s long-term growth prospects.
According to the latest data[0]:
- Consensus Rating: Buy (59.1% of analysts recommend Buy, 40.9% recommend Hold)
- Price Target: Consensus target of $122 (range: $119-$132)
- Upside Potential: Approximately 14.4%
Recent Analyst Actions:
- November 11, 2025: Evercore ISI maintains “Outperform” rating
- December 9, 2025: RBC Capital upgrades to “Outperform” (from “Sector Perform”)
- December 18, 2025: Mizuho maintains “Outperform”
- Diversified Business Portfolio: Three business segments covering construction, consumer goods, and industrial coatings, reducing single-market risks
- Robust Balance Sheet: Current ratio of 2.22, ample operating cash flow, supporting continuous investment and shareholder returns
- Operational Improvement Results: Sustained cost optimization and efficiency gains from the MAP 2025 plan
- Clear Growth Drivers: Infrastructure investment, data center construction, manufacturing reshoring, and geographic expansion provide growth momentum
- Strong Free Cash Flow: $538 million in free cash flow over six months, supporting dividend growth and share repurchases
- Weak DIY Market Demand: The Consumer segment faces cyclical pressures in the DIY market
- Cost Inflation: Rising raw material and labor costs may compress profit margins
- Exchange Rate Volatility: International business accounts for 30.5% of revenue, so exchange rate fluctuations may impact performance
- Integration Risk: Ongoing acquisition integration may bring execution challenges
RPM International, as a world-leading specialty chemicals and coatings company, has multiple core competitive advantages, including a diversified brand portfolio, robust financial position, continuous operational improvements, and clear growth drivers. The company benefits from long-term trends such as growing U.S. infrastructure investment, the boom in data center construction, and manufacturing reshoring, while continuously expanding its business boundaries through acquisition strategies and geographic expansion.
Evercore ISI’s decision to maintain an “Outperform” rating is well-founded: the company’s current share price corresponds to a reasonable valuation (consensus target price of $122), and its free cash flow generation capability, operational improvement results, and growth prospects provide solid support for the share price. Although facing short-term challenges of weak DIY market demand and cost inflation, the company’s diversified business structure and strategic positioning enable it to effectively address these cyclical pressures.
For investors seeking steady growth and dividend income, RPM International is a high-quality specialty chemicals stock worthy of attention.
[0] Jinling AI Financial Database - RPM International company data, valuation analysis, and technical analysis
[1] Seeking Alpha - “RPM International’s Multiple Growth Drivers Come With A More Demanding Valuation” (https://seekingalpha.com/article/4855092-rpm-international-multiple-growth-drivers-come-with-more-demanding-valuation)
[2] SEC.gov - RPM International Form 10-Q Filing (January 8, 2026) (https://www.sec.gov/Archives/edgar/data/110621/000119312526007515/rpm-20251130.htm)
[3] RPM International - Q2 2026 Earnings Call Presentation (https://seekingalpha.com/article/4858079-rpm-international-inc-2026-q2-results-earnings-call-presentation)
Insights are generated using AI models and historical data for informational purposes only. They do not constitute investment advice or recommendations. Past performance is not indicative of future results.
About us: Ginlix AI is the AI Investment Copilot powered by real data, bridging advanced AI with professional financial databases to provide verifiable, truth-based answers. Please use the chat box below to ask any financial question.