In-Depth Analysis Report on Virtus Dividend (NFJ) 52-Week High
Unlock More Features
Login to access AI-powered analysis, deep research reports and more advanced features
About us: Ginlix AI is the AI Investment Copilot powered by real data, bridging advanced AI with professional financial databases to provide verifiable, truth-based answers. Please use the chat box below to ask any financial question.
Related Stocks
I will now present the complete analysis report for you.
| Period | Return |
|---|---|
| 5-Day | +2.98% |
| 1-Month | +1.10% |
| 3-Month | +2.42% |
| 6-Month | +5.84% |
| 1-Year | +6.86% |
| 3-Year | +15.28% |
From a long-term trend perspective, NFJ has risen 15.28% cumulatively over the past three years, but posted a -2.02% return over five years, indicating that the fund only regained upward momentum recently[0].
NFJ currently has a high dividend yield of
NFJ is part of the financial services sector, which rose
- Growth in assets under management driven by improved interest rate conditions
- Increased investor demand for dividend-paying products
- Valuation recovery across the financial industry
The energy sector performed the best that day, rising
According to the latest dividend announcement, NFJ went ex-dividend on December 18, 2025, distributing
The recent market style has tilted toward value stocks and small-cap stocks. The Russell 2000 Small-Cap Index rose
| Indicator | Value | Signal Interpretation |
|---|---|---|
RSI (14) |
88.34 | ⚠️ Severely Overbought (typically >70 indicates overbought) |
MACD |
0.0934 | Buy Signal (0.0429 above the signal line) |
Bollinger Band Position |
94.7% | ⚠️ Price is near the extreme upper band |
Price vs 20-Day MA |
+2.84% | Neutral-Bullish |
Price vs 50-Day MA |
+3.02% | Neutral-Bullish |
Beta |
1.09 | Slightly higher volatility than the market |
30-Day Annualized Volatility |
13.03% | Moderately Low |
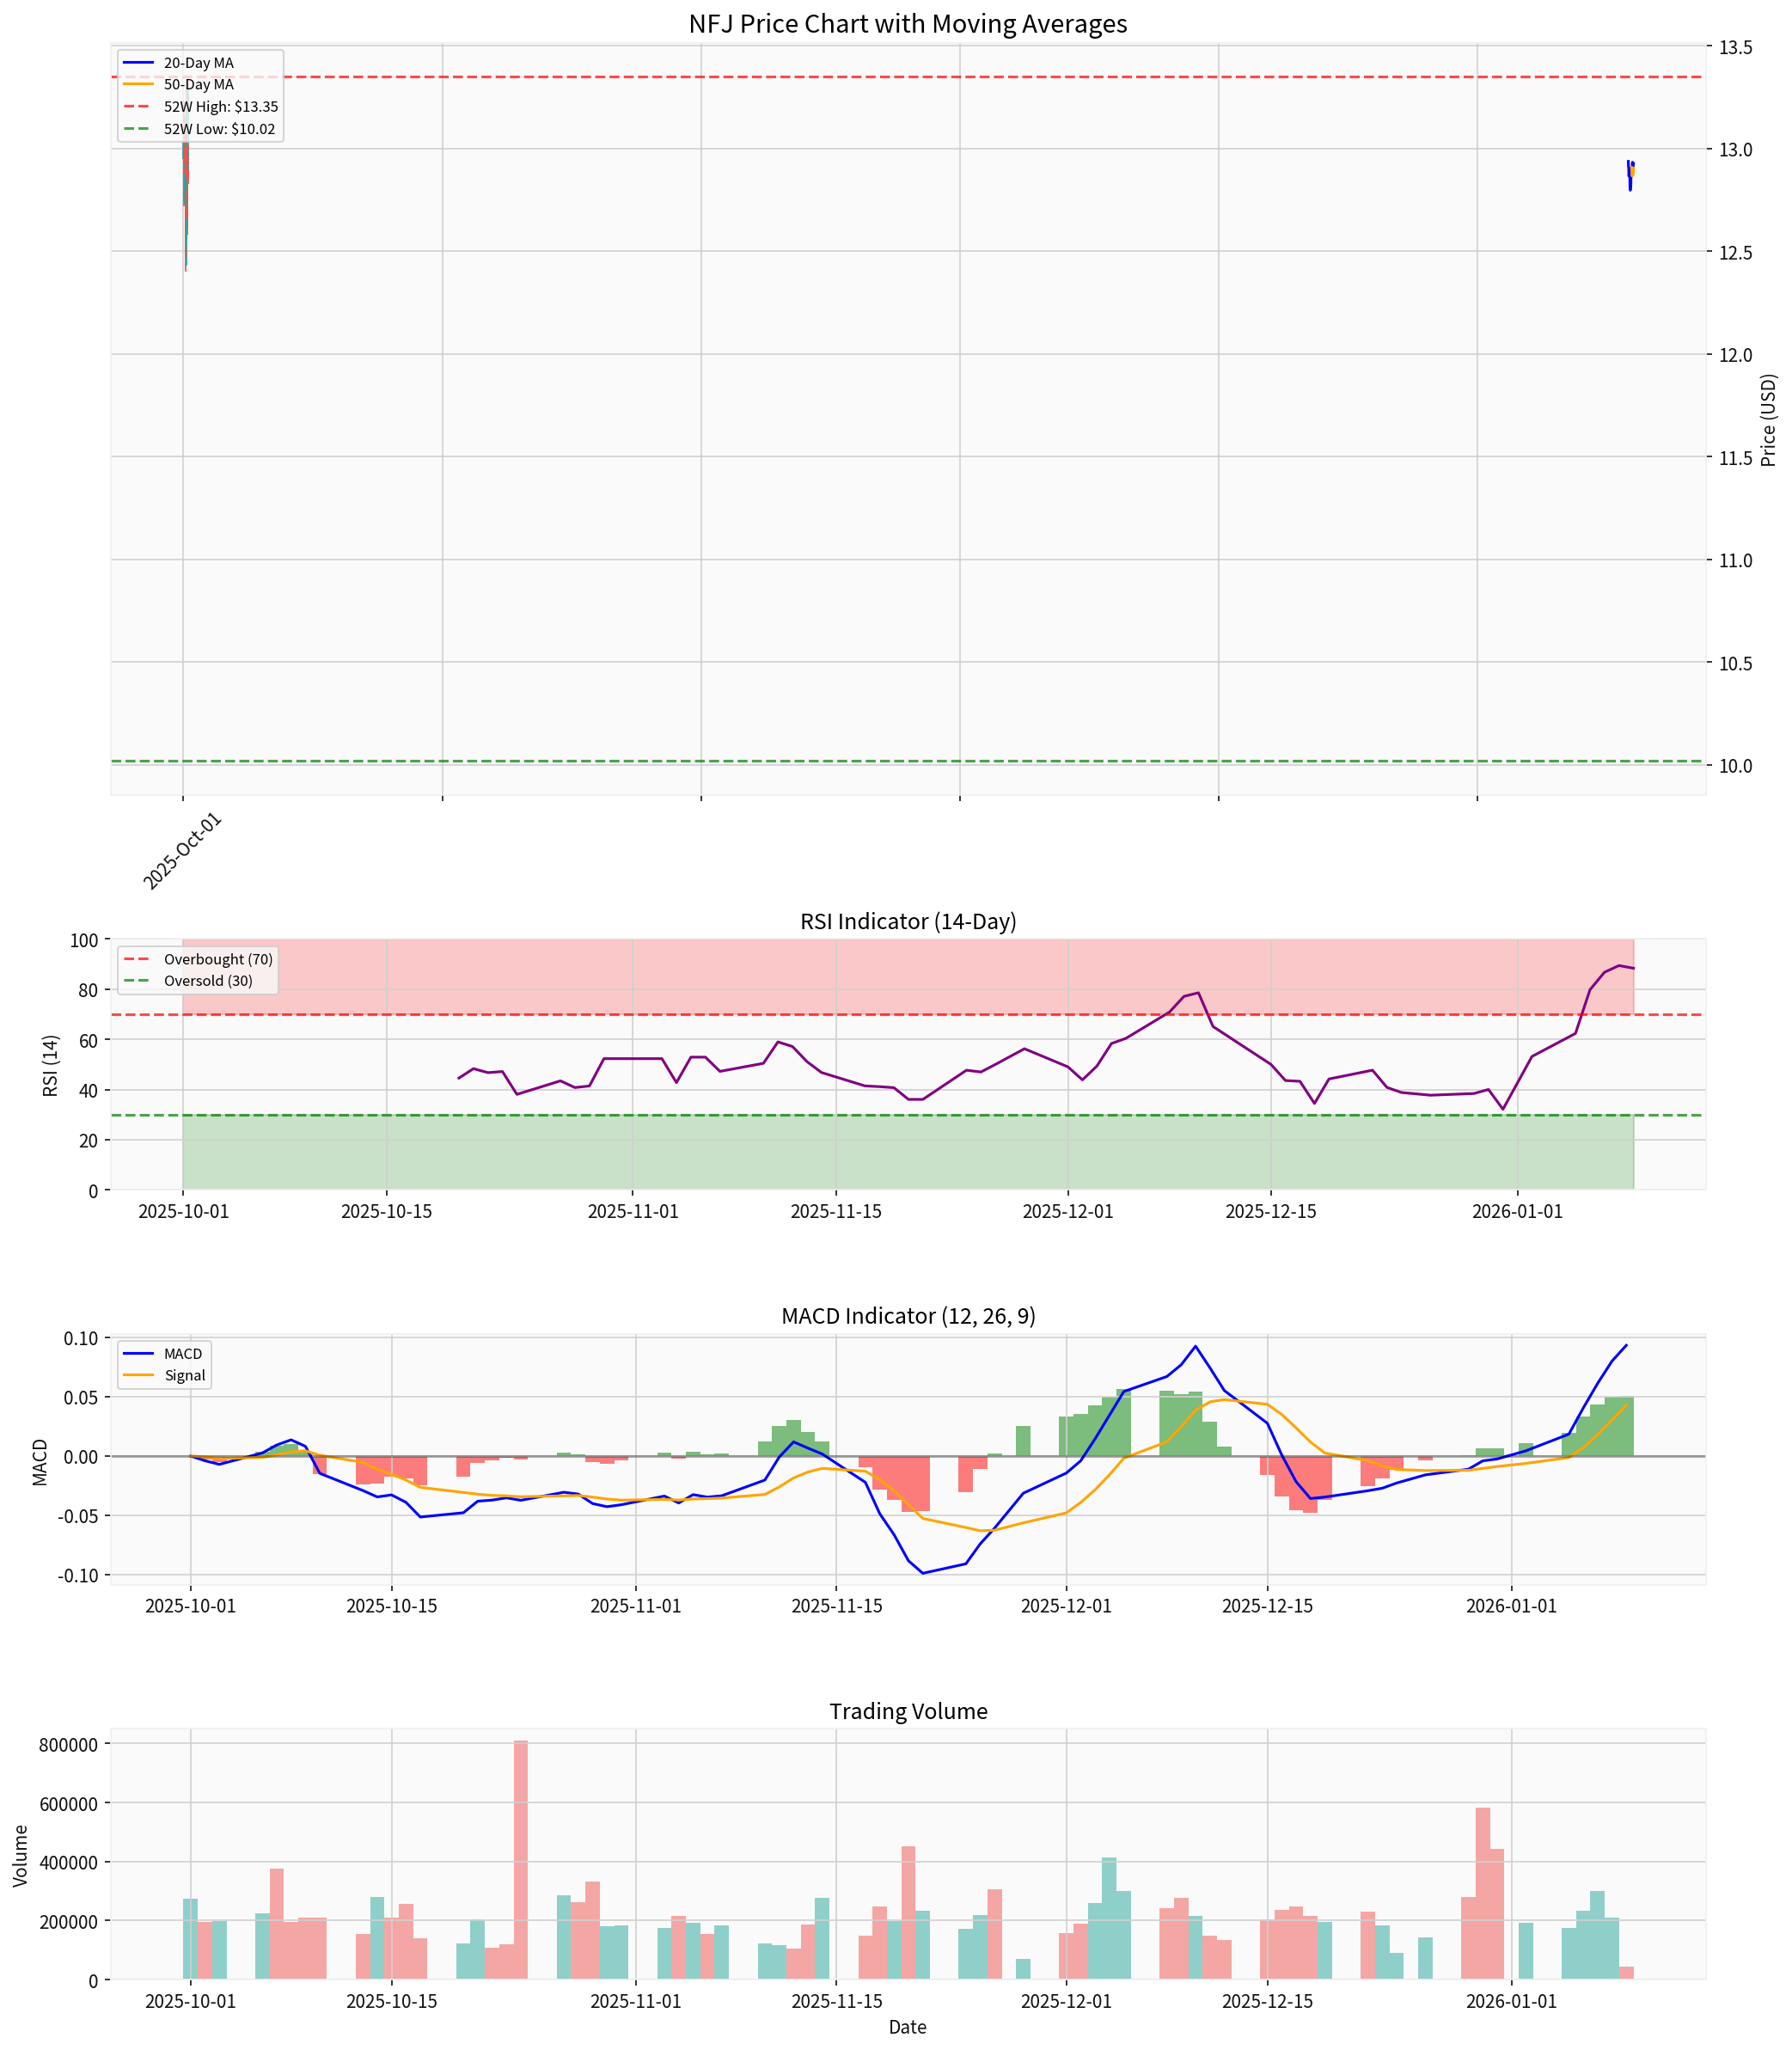
The technical analysis system gave a score of 4.0 out of 5, judging that NFJ is in an “Uptrend (Breakout Day, Pending Confirmation)” state[0]. Key price levels:
- Resistance Level:$13.35 (52-week high)
- Support Level:$13.07
- Next Target Level:$13.48
- Investment Objective:Seek current income and earnings, followed by long-term capital appreciation
- Key Holdings:Diversified dividend-paying stocks and income-oriented convertible securities
- Sector Allocation:Financials (30.52%), Healthcare (14.60%), Industrials (11.14%), Real Estate (10.98%), Energy (8.26%)[2]
- Management Team:NFJ Investment Group, with value investing experience dating back to 1989[2]
| Indicator | Value | Market Assessment |
|---|---|---|
Price-to-Earnings (P/E) |
18.98x | Reasonable |
Price-to-Book (P/B) |
0.95x | Close to Book Value |
Price-to-Sales (P/S) |
15.59x | - |
Return on Equity (ROE) |
4.91% | Moderate |
Net Profit Margin |
81.59% | Excellent |
The current P/B ratio is 0.95x, indicating that the share price is close to book value, which is a reasonable valuation level for closed-end funds[0].
The core factors driving NFJ’s breakthrough to a 52-week high include:
- High Dividend Attractiveness(9.46% yield) attracting income-seeking investors
- Cyclical Recovery of the Financial and Energy Sectors
- Capital Inflows from Year-End Dividend Reinvestment
- Market Environment Favoring Value Stocks
| Risk Type | Risk Level | Description |
|---|---|---|
Technical Overbought |
🔴 High | RSI 88.34, Bollinger Band 94.7% |
Rally-Chasing Risk |
🔴 High | Price is near the 52-week high |
Market Volatility |
🟡 Medium | Beta 1.09, slightly higher volatility |
Option Strategy Risk |
🟡 Medium | The covered call strategy may limit gains during a unilateral upward trend |
-
Severe Technical Overbought:RSI has reached 88.34, which typically signals short-term pullback risks. Historical data shows that when RSI exceeds 80, prices often face adjustment pressure.
-
Price Near Extreme Level:The Bollinger Band position of 94.7% indicates that the current price is at a statistical extreme, with a high probability of a short-term pullback.
-
Pending Breakout Confirmation:Technical analysis shows “pending confirmation”; it is recommended to wait for the price to effectively break through $13.35 and stabilize before considering entry.
-
Unfavorable Risk-Reward Ratio:The current entry cost is near the 52-week high, while technical indicators show significant pullback risks, with relatively limited upside potential.
| Strategy Type | Recommendation |
|---|---|
Conservative |
Wait for a pullback to below $13.00 before building positions in batches |
Moderate |
Set $13.35 as an observation level; enter after a breakout and pullback confirmation |
Aggressive |
Continue holding existing positions and set a stop-loss at $13.07 for protection |
Dollar-Cost Averaging |
Adopt a regular fixed-amount investment approach to smooth out entry costs |
NFJ’s breakthrough to a 52-week high is the result of multiple factors including
For existing investors, it is recommended to
[0] Gilin API Market Data (https://www.gilin-ai.com)
[1] Kraken - Virtus Dividend (NFJ) Stock Information (https://www.kraken.com/stocks/nfj)
[2] Virtus NFJ Dividend Value Fund - Virtus Investment Partners (https://www.virtus.com/products/nfj-dividend-value)
[3] Investing.com - AllianzGI NFJ Dividend, Interest & Premium Strategy Fund (https://www.investing.com/equities/allianzgi-nfj-div-interest-premium)
Insights are generated using AI models and historical data for informational purposes only. They do not constitute investment advice or recommendations. Past performance is not indicative of future results.
About us: Ginlix AI is the AI Investment Copilot powered by real data, bridging advanced AI with professional financial databases to provide verifiable, truth-based answers. Please use the chat box below to ask any financial question.