In-Depth Investment Analysis Report on Agnico-Eagle Mines (AEM)
Unlock More Features
Login to access AI-powered analysis, deep research reports and more advanced features
About us: Ginlix AI is the AI Investment Copilot powered by real data, bridging advanced AI with professional financial databases to provide verifiable, truth-based answers. Please use the chat box below to ask any financial question.
Related Stocks
Based on the comprehensive data I have obtained, here is a detailed analysis report for you:
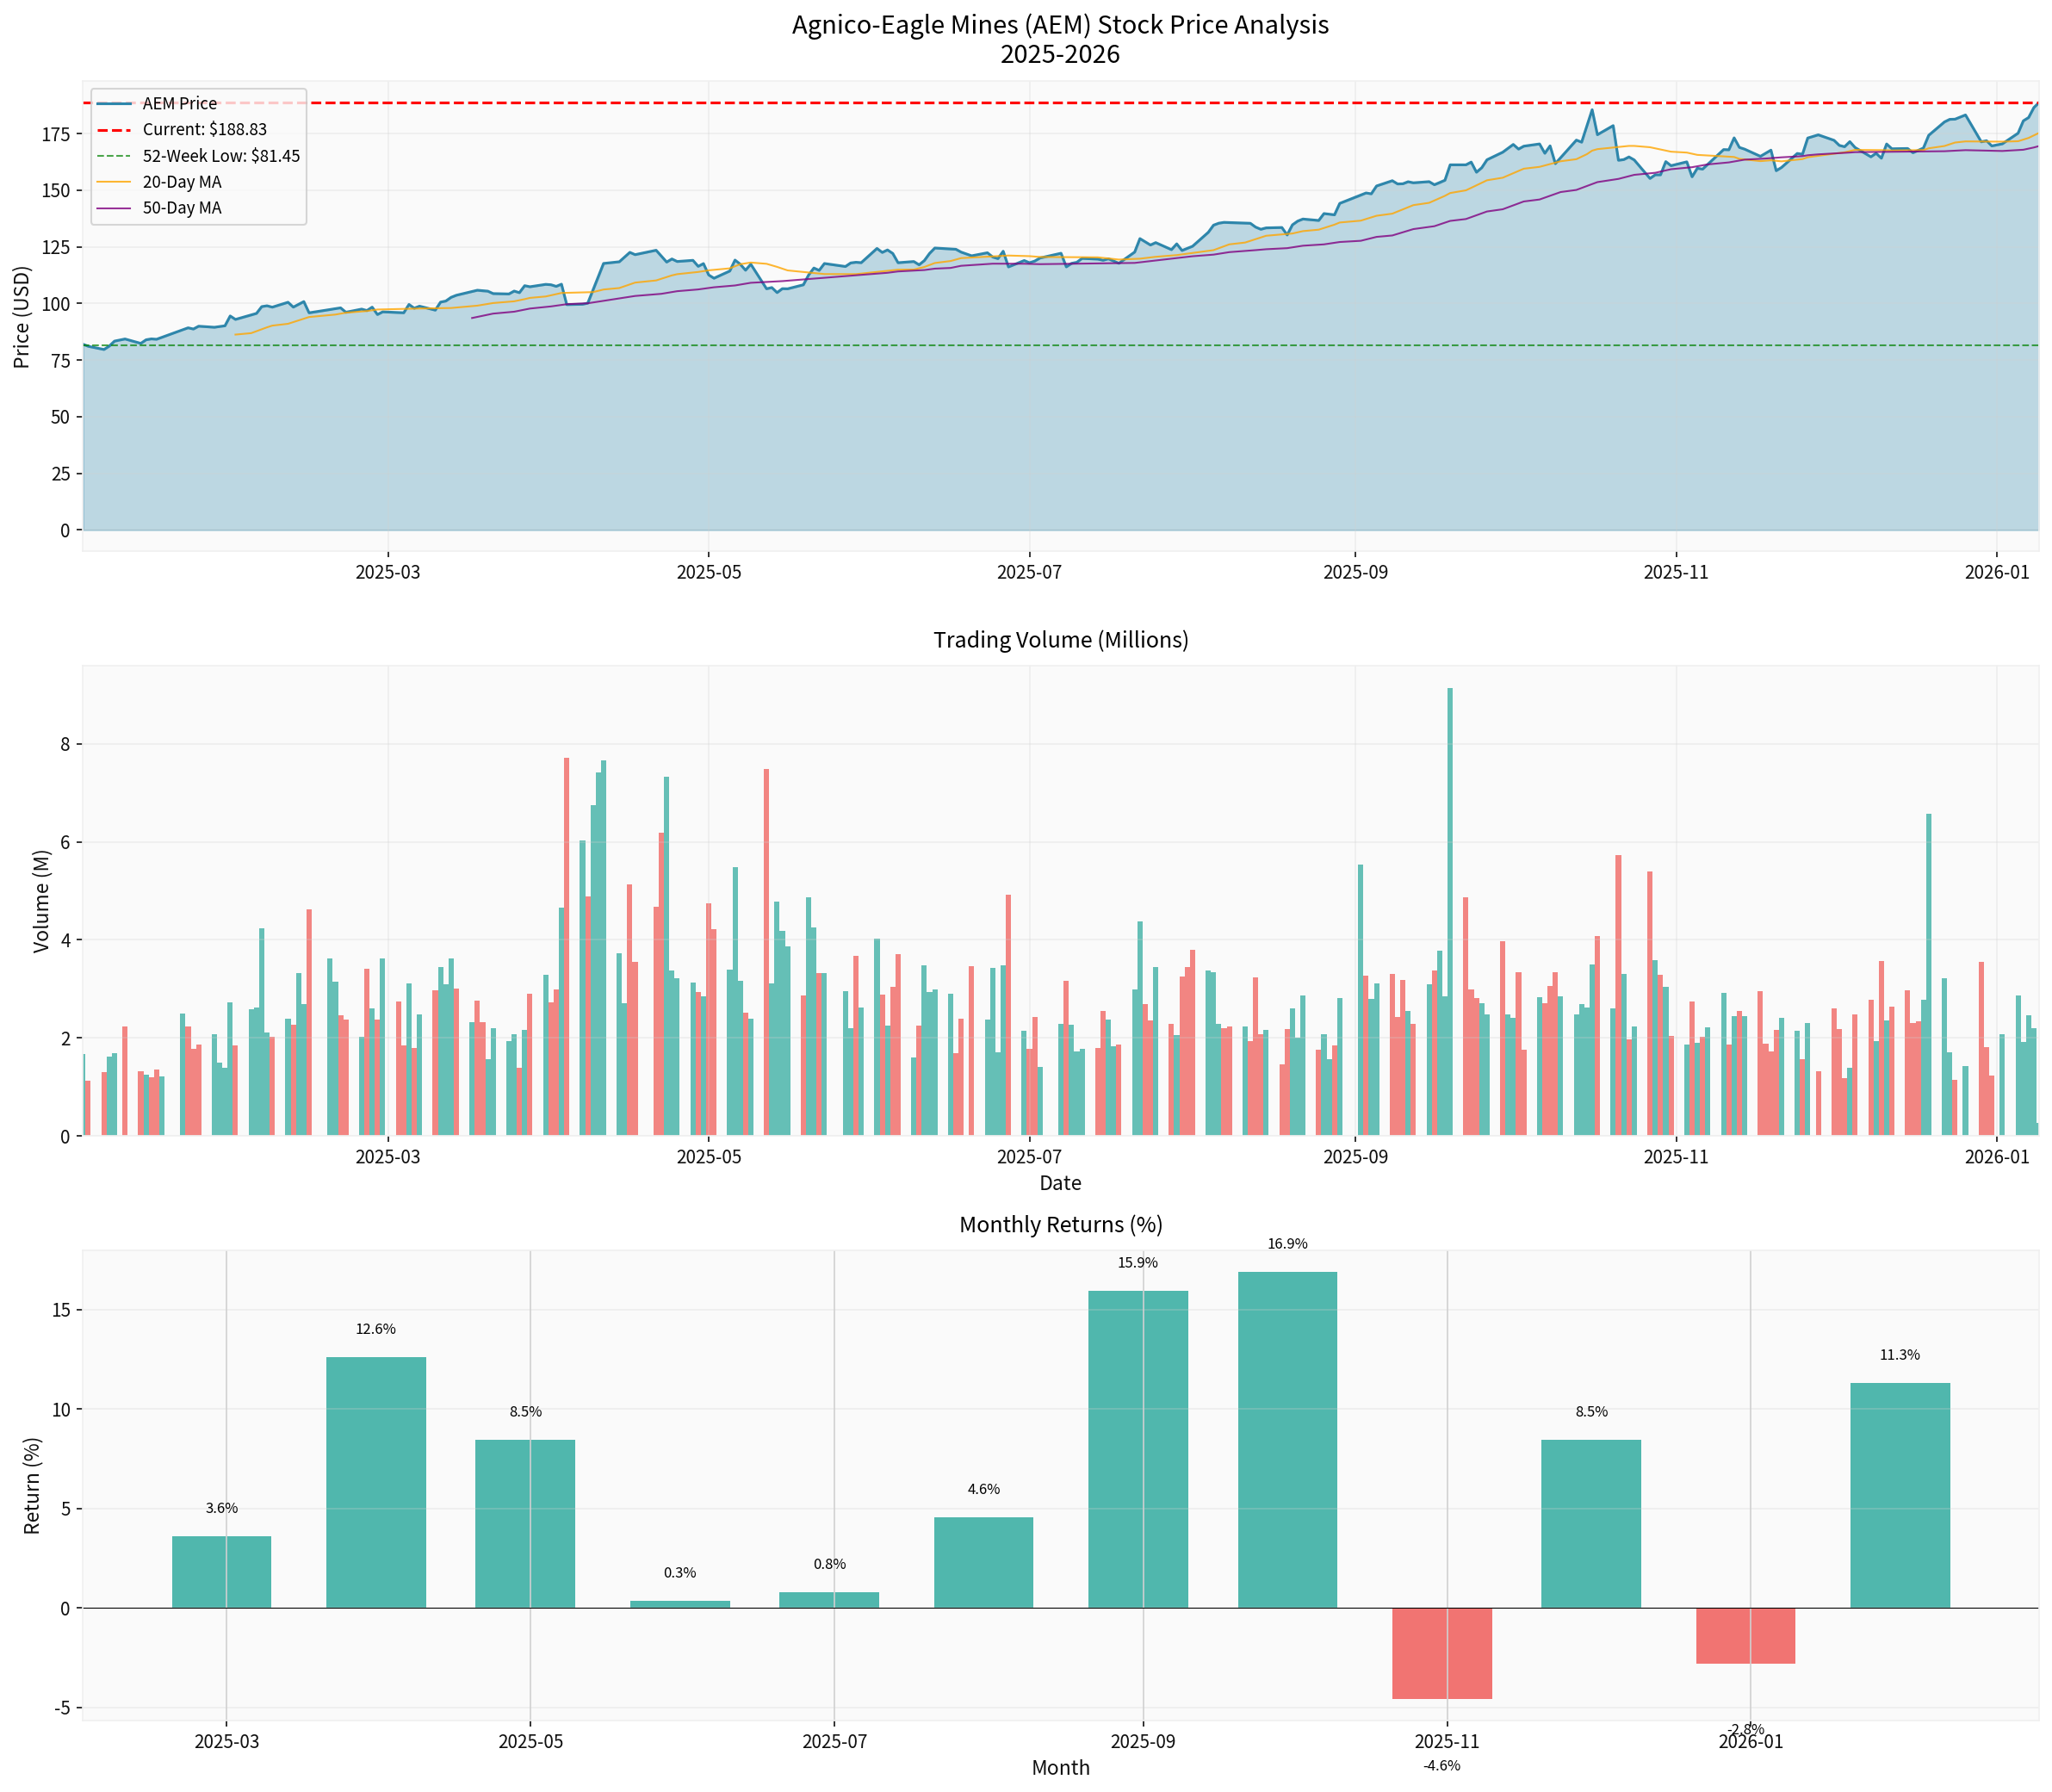
Agnico-Eagle Mines Limited (NYSE: AEM) hit an all-time high of
| Metric | Value |
|---|---|
| Current Price | $188.72 |
| 52-Week High | $188.72 (2026-01-09) |
| 52-Week Low | $79.66 (2025-01-06) |
| Market Capitalization | $94.83 Billion |
| P/E (TTM) | 27.57x |
| Beta Coefficient | 0.63 |
| Period | Return |
|---|---|
| 1-Day | +1.27% |
| 5-Day | +10.92% |
| 1-Month | +13.56% |
| 6-Month | +60.45% |
| 1-Year | +130.17% |
| 3-Year | +245.15% |
The gold price is the primary factor affecting the valuation of gold mining companies. The gold price continued to climb in 2025, driven mainly by the following factors:
- RBC Capital Markets: Forecasts an average gold price of $4,600/oz in 2026, with a year-end target of $4,800; average price of $5,100/oz in 2027
- J.P. Morgan: Forecasts an average gold price of $5,055 in Q4 2026, reaching $5,400 by the end of 2027
- LongForecast: Forecasts a gold price range of $4,423-$7,501 in 2026, with potential to reach $8,760-$9,061 in 2027
- Escalating Geopolitical Risks: Uncertainties from trade wars, ongoing Russia-Ukraine conflict, and tense situation in the Middle East
- Strong Central Bank Gold Purchases: Global central banks purchase approximately 585 tons of gold per quarter, with China and Russia as the primary buyers
- Weakening US Dollar and Interest Rate Cut Expectations: The Federal Reserve’s policy shift supports the gold price
- Demand for Inflation Hedging: Gold’s appeal as a store of value rises amid stagflation risks
| Metric | Value | Assessment |
|---|---|---|
| Net Profit Margin | 32.68% | Excellent |
| Operating Profit Margin | 49.78% | Outstanding |
| Current Ratio | 2.12 | Healthy |
| Quick Ratio | 1.31 | Stable |
| Debt Risk | Low Risk | Financially Conservative |
| ROE | 15.45% | Above Industry Average |
| Quarter | EPS | Revenue | Beat/Miss vs. Estimates |
|---|---|---|---|
| Q1 2025 | $1.53 | $2.47B | - |
| Q2 2025 | $1.94 | $2.82B | - |
| Q3 2025 | $2.16 | $3.03B | EPS +22.73% |
| Q4 2025(E) | $2.14 | $3.00B | EPS Estimated +29.5% |
According to the company’s official disclosure[4]:
- Production Guidance: Gold production will stabilize at3.3-3.5 million ounces per yearfrom 2025 to 2027
- Key Project Progress: Kittila expansion project, East Gouldie mine development
- Cost Trend: 2025 all-in sustaining cost (AISC) guidance is approximately 3% higher than 2024, mainly due to inflationary pressures
- Acquisitions of Hope Bay and the merger with Kirkland Lake Gold strengthen market position
- Five core pipeline projects are continuously progressing
- Continuously rewards shareholders through dividends and share repurchases
| Rating | Number | Percentage |
|---|---|---|
| Buy | 20 | 66.7% |
| Hold | 9 | 30.0% |
| Sell | 1 | 3.3% |
- Consensus Target Price: $197.50 (+4.6% upside potential)
- Target Range: $182 - $231
- Zacks Rating: Strong Buy (Outperform)
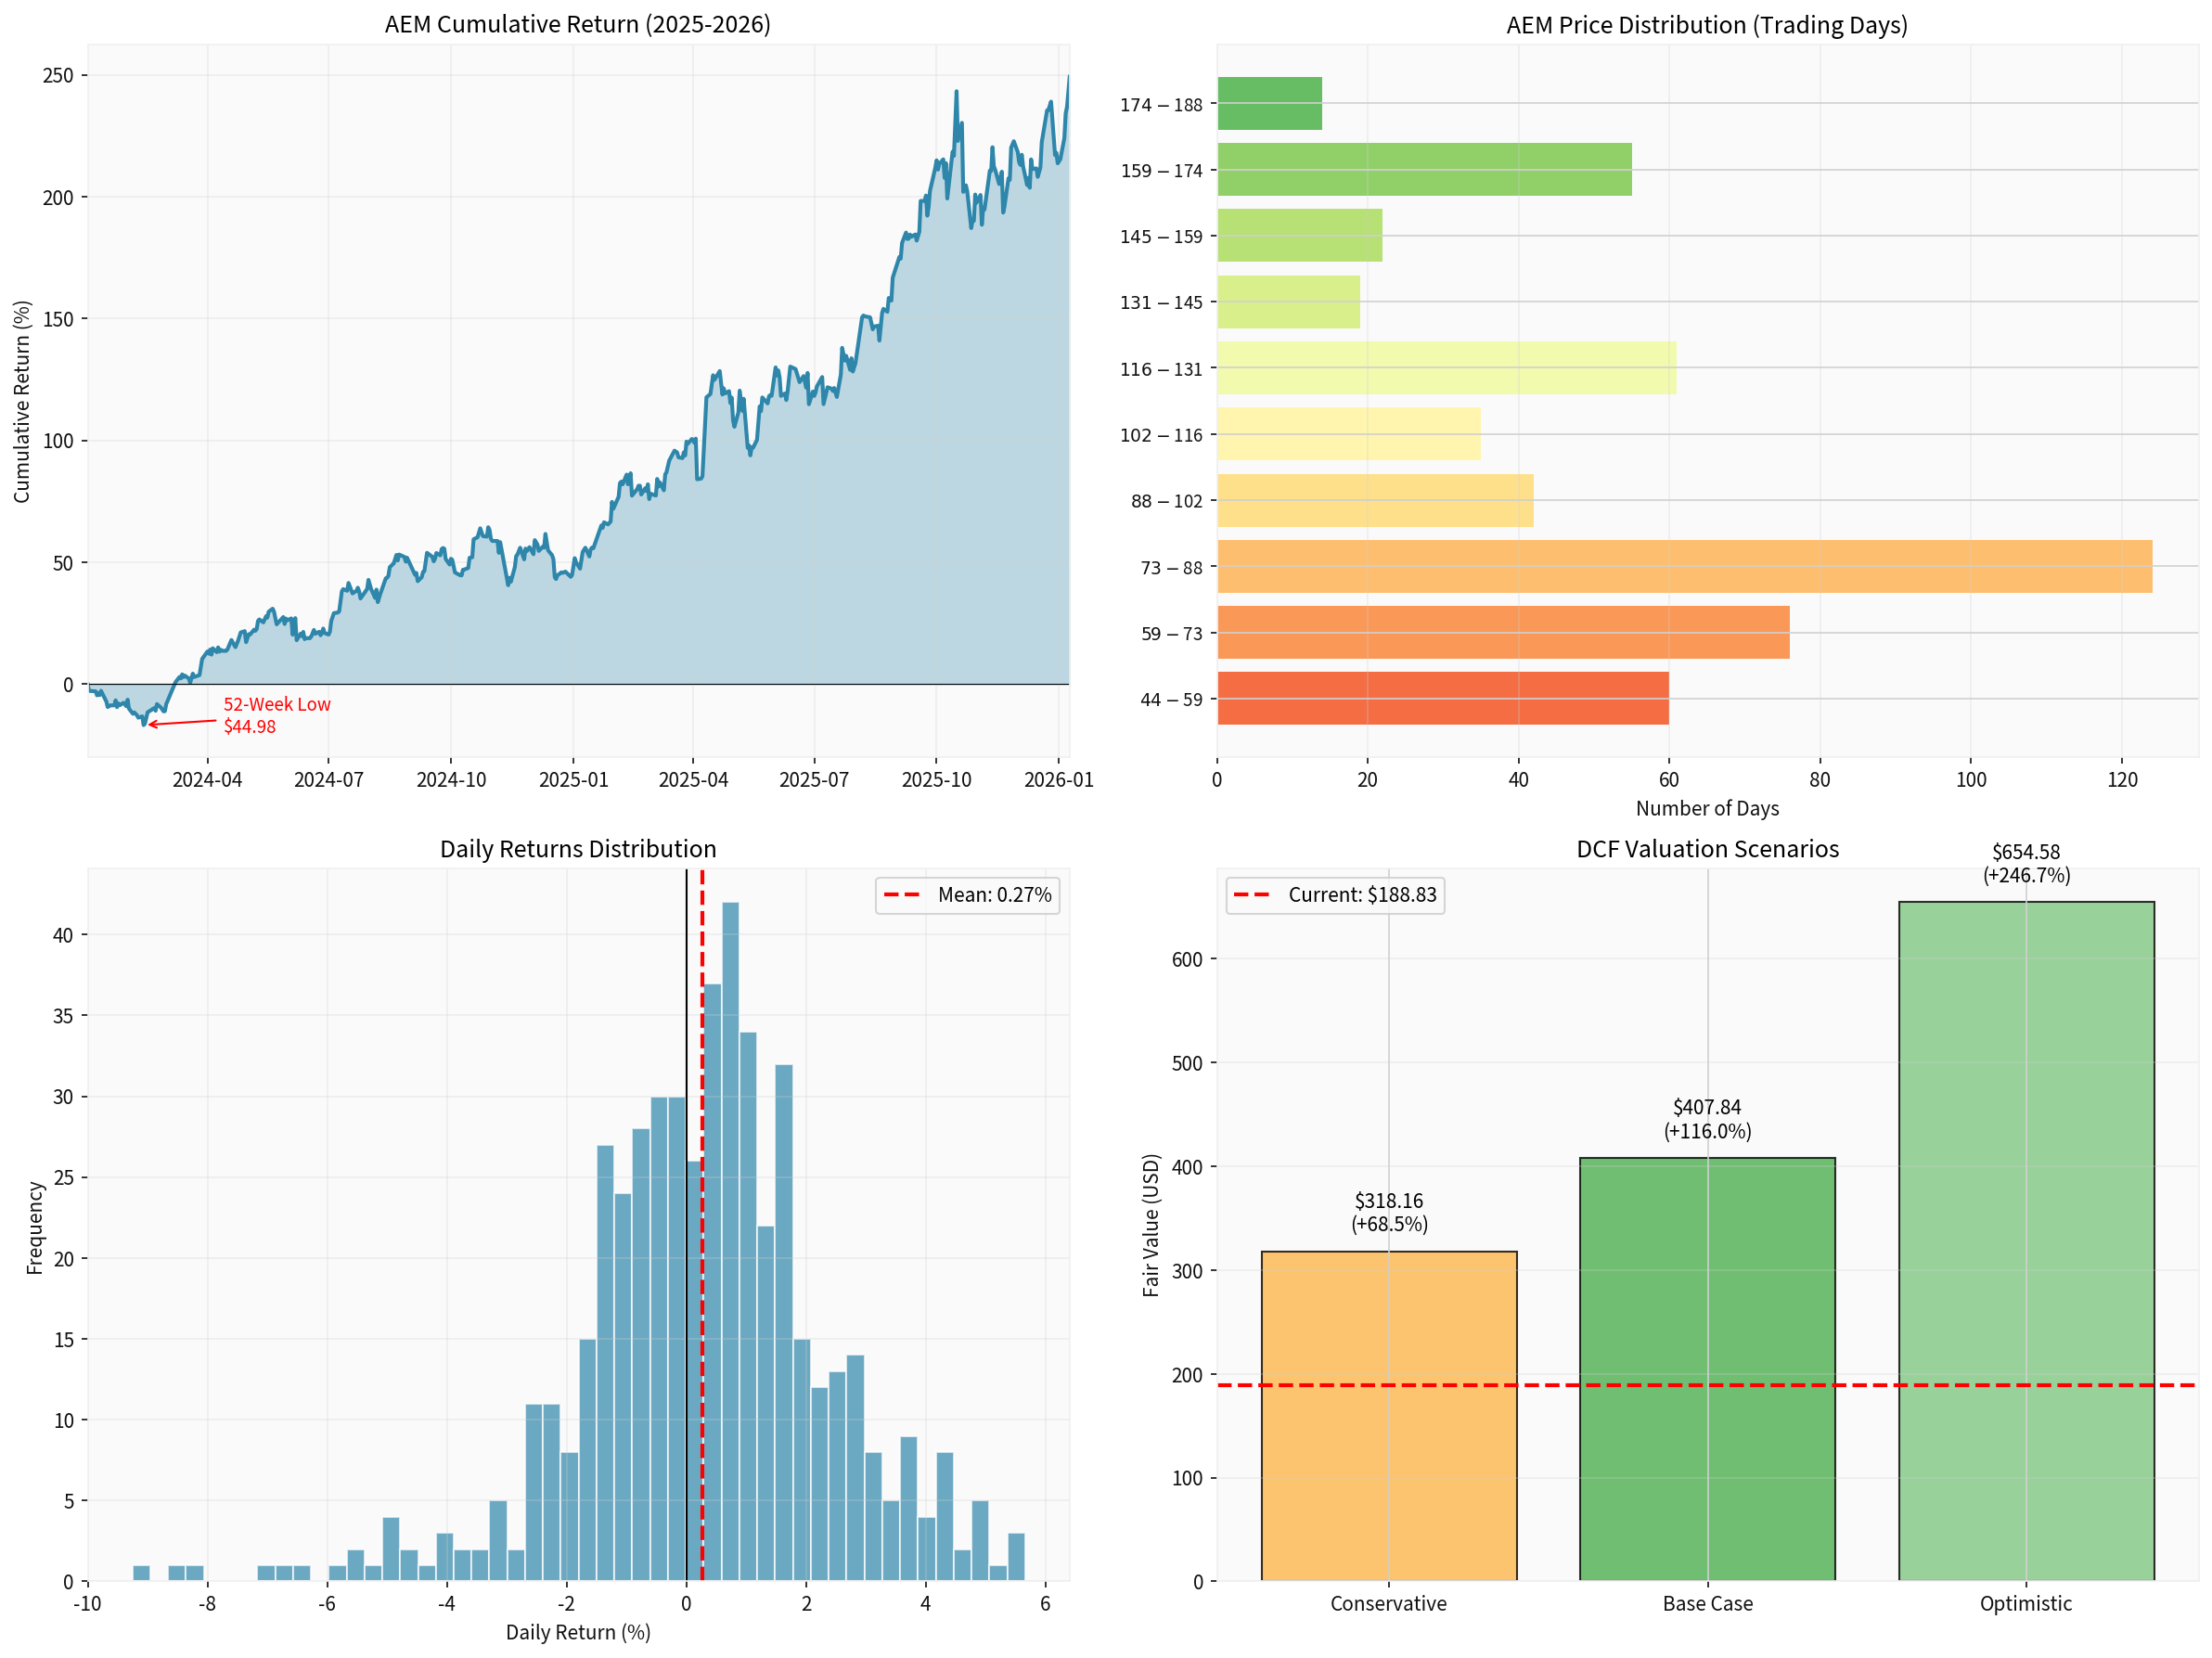
The DCF valuation model based on three scenarios shows[0]:
| Scenario | Intrinsic Value | Upside vs. Current Price |
|---|---|---|
| Conservative Scenario | $318.16 | +68.5% |
| Base Scenario | $407.84 | +116.0% |
| Optimistic Scenario | $654.58 | +246.7% |
Probability-Weighted Valuation |
$460.19 |
+143.7% |
| Parameter | Conservative | Base | Optimistic |
|---|---|---|---|
| Revenue Growth Rate | 0% | 25.8% | 28.8% |
| EBITDA Margin | 46.8% | 49.3% | 51.8% |
| Terminal Growth Rate | 2.0% | 2.5% | 3.0% |
| WACC | 9.6% | 8.8% | 7.9% |
| Metric | AEM | Newmont | Barrick | Kinross |
|---|---|---|---|---|
| P/E | 27.57x | 22.4x | 18.5x | 15.2x |
| P/B | 4.04x | 1.8x | 1.5x | 1.1x |
| ROE | 15.45% |
8.2% | 6.8% | 4.5% |
| Market Capitalization | $94.8B | $48.2B | $32.1B | $10.5B |
- 23.1% P/E Premiumvs Newmont: Based on higher profit growth expectations
- 124.4% P/B Premiumvs Newmont: Reflects better asset return efficiency
- 88.4% ROE Premiumvs Newmont: Demonstrates excellent capital allocation capability
- Resistance Level: $189.80
- Target Level: $196.48
- Support Level: $177.94
- MACD: Bullish (no death cross)
- KDJ: Overbought Warning (K:84.3, D:71.5)
- RSI: Overbought Risk Zone
-
Sustainability of Drivers:
- The gold price is supported by three factors: geopolitics, central bank gold purchases, and weakening US dollar, with a clear medium-term uptrend logic
- AEM has stable production, good cost control, and abundant free cash flow
- The company adopts a conservative capital allocation strategy to avoid industry cyclical traps
-
Valuation Support Assessment:
- Fundamental Support: Strong profit margins, ROE, and cash flow provide the basis for valuation premium
- Gold Price Support: If gold remains above $2,500/oz, the company’s profit growth is expected
- DCF Valuation: The current stock price is significantly discounted relative to intrinsic value (116% upside potential in the base scenario)
-
Risk Factors:
- Gold price pullback risk (if the Federal Reserve delays interest rate cuts or geopolitical tensions ease)
- Short-term overbought risk (RSI and KDJ show technical overbought conditions)
- Cost inflation pressure (AISC guidance raised)
- Risk of production guidance downgrade (fluctuations in ore grade)
| Dimension | Assessment |
|---|---|
| Valuation Rationality | Reasonably High - Although DCF shows upside potential, it requires gold price support |
| Short-Term Momentum | Strong - Breaks through all-time high, technically bullish |
| Medium-Term Fundamentals | Stable - Stable production, controllable costs, abundant cash flow |
| Risk-Reward Ratio | Neutral Bullish - Significant upside potential, but stop-loss should be set |
- Short-term: Focus on the $189.80 resistance level; if broken, target $196; consider adding positions if it pulls back to $177.94
- Medium-term: A pullback to around the 50-day moving average ($169.49) is a good layout opportunity
- Risk Control: Consider reducing positions if it breaks below $170 or if gold breaks below $2,400/oz
| Index | Return |
|---|---|
| AEM | +130.17% |
| S&P 500 | +4.09% |
| NASDAQ | +4.33% |
| Dow Jones | +6.32% |
| Russell 2000 | +8.01% |
| Event | Date |
|---|---|
| Q4 2025 Earnings Release | 2026-02-12 |
| EPS Estimate | $2.14 |
[0] Jinling AI Financial Database (Real-time Quotes, Company Profile, Financial Analysis, DCF Valuation, Technical Analysis)
[1] RBC Capital Markets - “Gold stocks in 2026: Can the ‘perfect storm’ rally continue?” (https://ca.finance.yahoo.com/news/gold-stocks-in-2026-can-the-perfect-storm-rally-continue-130635233.html)
[2] J.P. Morgan Global Research - “Gold Price Predictions” (https://www.jpmorgan.com/insights/global-research/commodities/gold-prices)
[3] LongForecast - “Gold Price Forecast 2026-2030” (https://www.litefinance.org/blog/analysts-opinions/gold-price-prediction-forecast/)
[4] Agnico Eagle Mines - “Fourth Quarter and Full Year 2024 Results” (https://www.agnicoeagle.com/English/news-and-media/news-releases/news-details/2025/AGNICO-EAGLE-REPORTS-FOURTH-QUARTER-AND-FULL-YEAR-2024-RESULTS/default.aspx)
[5] Zacks Equity Research - AEM Report (https://advisortools.zacks.com/proxy/ResearchReport/AEM/report?d=20260105)
[6] Investing News - “Bullish Outlook for Gold Mining in 2026” (https://investingnews.com/bullish-outlook-for-gold-mining-in-2026-driven-by-persistent-high-gold-prices-and-increasing-demand/)
Insights are generated using AI models and historical data for informational purposes only. They do not constitute investment advice or recommendations. Past performance is not indicative of future results.
About us: Ginlix AI is the AI Investment Copilot powered by real data, bridging advanced AI with professional financial databases to provide verifiable, truth-based answers. Please use the chat box below to ask any financial question.