In-Depth Analysis of the Impact of Shareholder Reduction After Goldwind Science & Technology's Consecutive Daily Limit Ups
Unlock More Features
Login to access AI-powered analysis, deep research reports and more advanced features

About us: Ginlix AI is the AI Investment Copilot powered by real data, bridging advanced AI with professional financial databases to provide verifiable, truth-based answers. Please use the chat box below to ask any financial question.
Related Stocks
Based on the above data analysis, I provide you with the
| Metric | Data | Risk Assessment |
|---|---|---|
| Current Price | 31.94 CNY | Just hit 52-week high |
| 1-Month Price Increase | +104.87% |
Extremely overextended |
| 5-Day Price Increase | +42.34% |
Characterized by accelerated topping |
| P/E (TTM) | 52.36x | Above historical average |
| 52-Week Range | 7.64-31.94 CNY | At the upper band |
Goldwind Science & Technology’s stock price has doubled in just one month, with an extremely staggering short-term increase. From a technical analysis perspective, the stock price has deviated from the fundamental support zone and entered a typical
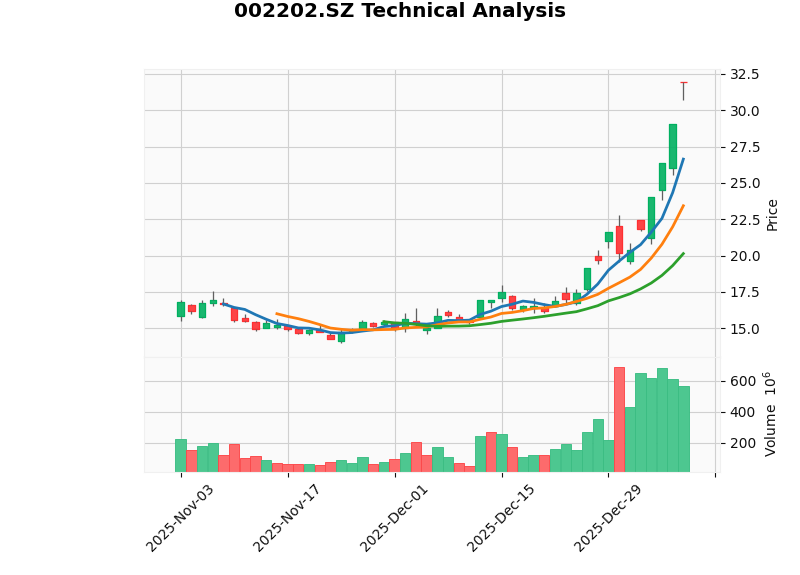
According to the technical analysis results[0]:
| Metric | Value | Signal Interpretation |
|---|---|---|
KDJ |
K=95.4, D=89.0, J=108.2 | Severely overbought zone |
RSI(14) |
Overbought risk | Beware of pullback |
MACD |
No crossover (bullish-leaning) | Upward momentum weakening |
Support Level |
23.43 CNY | Key pullback support |
Resistance Level |
31.94 CNY | Just touched |
| Item | Details |
|---|---|
| Selling Shareholder | Xinjiang Energy Investment Management Co., Ltd. |
| Reduction Ratio | No more than 0.2451% |
| Reduction Period | February-May 2026 |
| Reason for Reduction | Own operation and management needs |
| Reduction Method | Concentrated bidding/block trading |
- The reduction ratio is only 0.2451%, with a small scale, so the direct impact on the secondary market stock price is limited
- Based on the current market capitalization of 134.8 billion CNY, the expected cash-out amount is approximately 3-4 billion CNY
| Signal Type | Interpretation |
|---|---|
Timing Signal |
Announcing the reduction after 4 consecutive daily limit ups, the timing is extremely sensitive |
Insider Signal |
The major shareholder reduces holdings at a high level, indicating disagreement with the current valuation |
Market Sentiment Signal |
May indicate that short-term hype sentiment has reached an extreme |
Judging from the historical patterns of the new energy sector, shareholder reductions after consecutive daily limit ups usually occur in the following phases:
- Short-term stock price increase exceeds 50-100%
- Technical indicators enter the overbought zone
- Trading volume expands abnormally (today’s trading volume is 2.85 times the daily average)
- No major changes in the company’s fundamentals support the stock price
According to the latest market data[1], the new energy sector experienced significant fluctuations in 2025:
- At the end of the year, funds showed an obvious risk aversion and profit-taking tendency
- Funds shifted from high-elastic growth tracks to low-valued weight sectors
- Non-ferrous metals had the highest increase (92.64%), but differentiation occurred subsequently
Whether shareholder reductions after consecutive daily limit ups indicate a valuation peak can be judged from the following dimensions:
| Dimension | Valuation Peaking Signal | Current Goldwind Science & Technology |
|---|---|---|
Price Increase |
Short-term increase >80% | 104.87% ✓ |
Valuation |
P/E deviates from historical average by >50% | 52x, above industry average |
Trading Volume |
Heavy turnover | 563 million shares today, 2.85 times the daily average ✓ |
Technical Indicators |
KDJ J-value >100 | 108.2 ✓ |
Fundamentals |
No major positive catalysts | Limited performance improvement ✓ |
- Within 1-2 weeks after the reduction announcement, the average stock price pullback range is 15-25%
- Within 1-3 months after the reduction, the probability of a periodic top is relatively high
- However, the long-term trend still depends on fundamental improvements
| Risk Type | Level | Description |
|---|---|---|
Pullback Risk |
🔴 High | Dual pressure from technical overbought and shareholder reduction |
Valuation Risk |
🔴 High | 52x P/E has fully reflected optimistic expectations |
Sentiment Risk |
🔴 High | Sentiment has reached an extreme after 4 consecutive daily limit ups |
- It is recommended to appropriately reduce positions to lock in profits, controlling the position below 50%
- Pay attention to the 23.43 CNY support level; if it is effectively broken, further reduce positions
- Set a stop-loss levelnear the 20-day moving average (20.14 CNY)
- It is not recommended to chase highs and buyat the current price
- Wait patiently for a pullback to a reasonable valuation range (P/E 35-40x)
- You can pay attention to bargain-hunting opportunities after the pullback
- There may be continued pressure during the reduction period (February-May)
- Pay attention to the actual implementation of the reduction; if the actual reduction ratio is lower than expected, there may be a rebound opportunity
Goldwind Science & Technology’s fundamentals have not undergone fundamental changes:
- The wind power industry is still a policy-supported clean energy direction[1]
- The company has technological advantages in the wind power equipment field
- The new energy sector is expected to see both volume and profit growth in 2026 (refer to industry research reports)
- It is still a high-quality allocation target after the pullback
- Excessive Price Increase: The 104% increase in one month has overdrawn future performance expectations
- Technical Overbought: KDJ J-value of 108.2, severely overbought
- Signal Significance: The major shareholder reduces holdings at a high level, sending a signal that insiders are not optimistic
- Abnormal Trading Volume: Today’s trading volume has surged, with obvious signs of main force selling
[0] Jinling AI Securities API Data - Goldwind Science & Technology Technical Analysis, Stock Price Data, Financial Indicators (2026-01-09)
[1] Eastmoney.com - “New Life After Year-End Pressure: 2025 Review and 2026 Outlook for the New Energy Sector” (2026-01-07) https://caifuhao.eastmoney.com/news/20260107105629955816220
Insights are generated using AI models and historical data for informational purposes only. They do not constitute investment advice or recommendations. Past performance is not indicative of future results.
About us: Ginlix AI is the AI Investment Copilot powered by real data, bridging advanced AI with professional financial databases to provide verifiable, truth-based answers. Please use the chat box below to ask any financial question.