Research on Valuation Logic and Investment Value Reconstruction of Core Office Assets in Beijing Against the Background of Public REITs Asset Expansion
Unlock More Features
Login to access AI-powered analysis, deep research reports and more advanced features

About us: Ginlix AI is the AI Investment Copilot powered by real data, bridging advanced AI with professional financial databases to provide verifiable, truth-based answers. Please use the chat box below to ask any financial question.
Based on collected market data, policy information, and professional analysis, I have prepared this in-depth research report for you.
On December 31, 2025, the CSRC officially released the Notice on Promoting the High-Quality Development of the Real Estate Investment Trust (REITs) Market and the Announcement of the China Securities Regulatory Commission on Launching the Pilot Program for Commercial Real Estate Investment Trusts, marking the official expansion of underlying assets of public REITs to the commercial office and hotel sectors[1][2]. This landmark policy breakthrough will fundamentally reshape the valuation logic and investment value system of core office assets in Beijing. This report conducts a systematic analysis from four dimensions: policy background, market status, transformation of valuation logic, and reconstruction of investment value, to provide decision-making references for institutional investors.
Since the launch of the pilot program for China’s public REITs in 2021, it has undergone a profound transformation from private to public, and from debt-like to equity-like nature. Initially, warehousing and logistics, toll roads, municipal facilities, industrial parks, etc. were included in the issuance scope, and later sectors such as clean energy, data centers, affordable rental housing, water conservancy facilities, cultural tourism, and consumer infrastructure were gradually added[1]. As of December 31, 2025, the number of public REITs products in China has reached 78, with a total issuance scale exceeding the 200 billion yuan mark, reaching 201.749 billion yuan[2].
On November 28, 2025, the CSRC released the Announcement of the China Securities Regulatory Commission on Launching the Pilot Program for Commercial Real Estate Investment Trusts (Draft for Comment), which was officially implemented on December 31, 2025, marking the official launch of commercial real estate REITs[3]. This policy clarifies the holding path of “Public Fund - ABS - SPV - Underlying Assets” and supports the “mixed loading” model, allowing REITs to hold asset portfolios with similar business types and complementary functions[2].
The regulatory authorities have built a “1+3+N” institutional system, implementing differentiated information disclosure standards for different business types such as commercial retail, office, and hotel[2]. The core features of this institutional framework include:
| System Elements | Specific Content |
|---|---|
| Top-level Design | CSRC Document No. 63 clarifies the definition and operation requirements for commercial real estate REITs |
| Classified Regulation | Differentiated standards formulated for three business types: retail, office, and hotel |
| Review Optimization | The time limit from exchange acceptance to issuance of the first feedback is shortened to 20 working days |
| Information Disclosure | Requires disclosure of the composition and operation status of each business type to enhance transparency |
Huatai Securities analysis points out that continuous policy support, continuous expansion of underlying assets, and increasingly prominent allocation value together constitute the core driving forces for market development[3]. Compared with other infrastructure, the commercial real estate sector has a higher degree of marketization, and there are relatively fewer issues to be clarified in terms of compliance such as land ownership, so the launch speed of projects is expected to accelerate[3].
In 2025, Beijing’s Grade A office market showed significant characteristics of “supply-demand restructuring + value revaluation”, officially entering a period of in-depth adjustment. According to data from Colliers International, the vacancy rate of Beijing’s Grade A office market dropped to 19.2% in the fourth quarter of 2025, a year-on-year decrease of about 1.5 percentage points, indicating optimized market supply-demand structure[4]. The net absorption volume was approximately 83,000 square meters, pushing the annual net absorption volume to 330,000 square meters, which means the market has achieved large-scale de-stocking of over 300,000 square meters for two consecutive years[4].
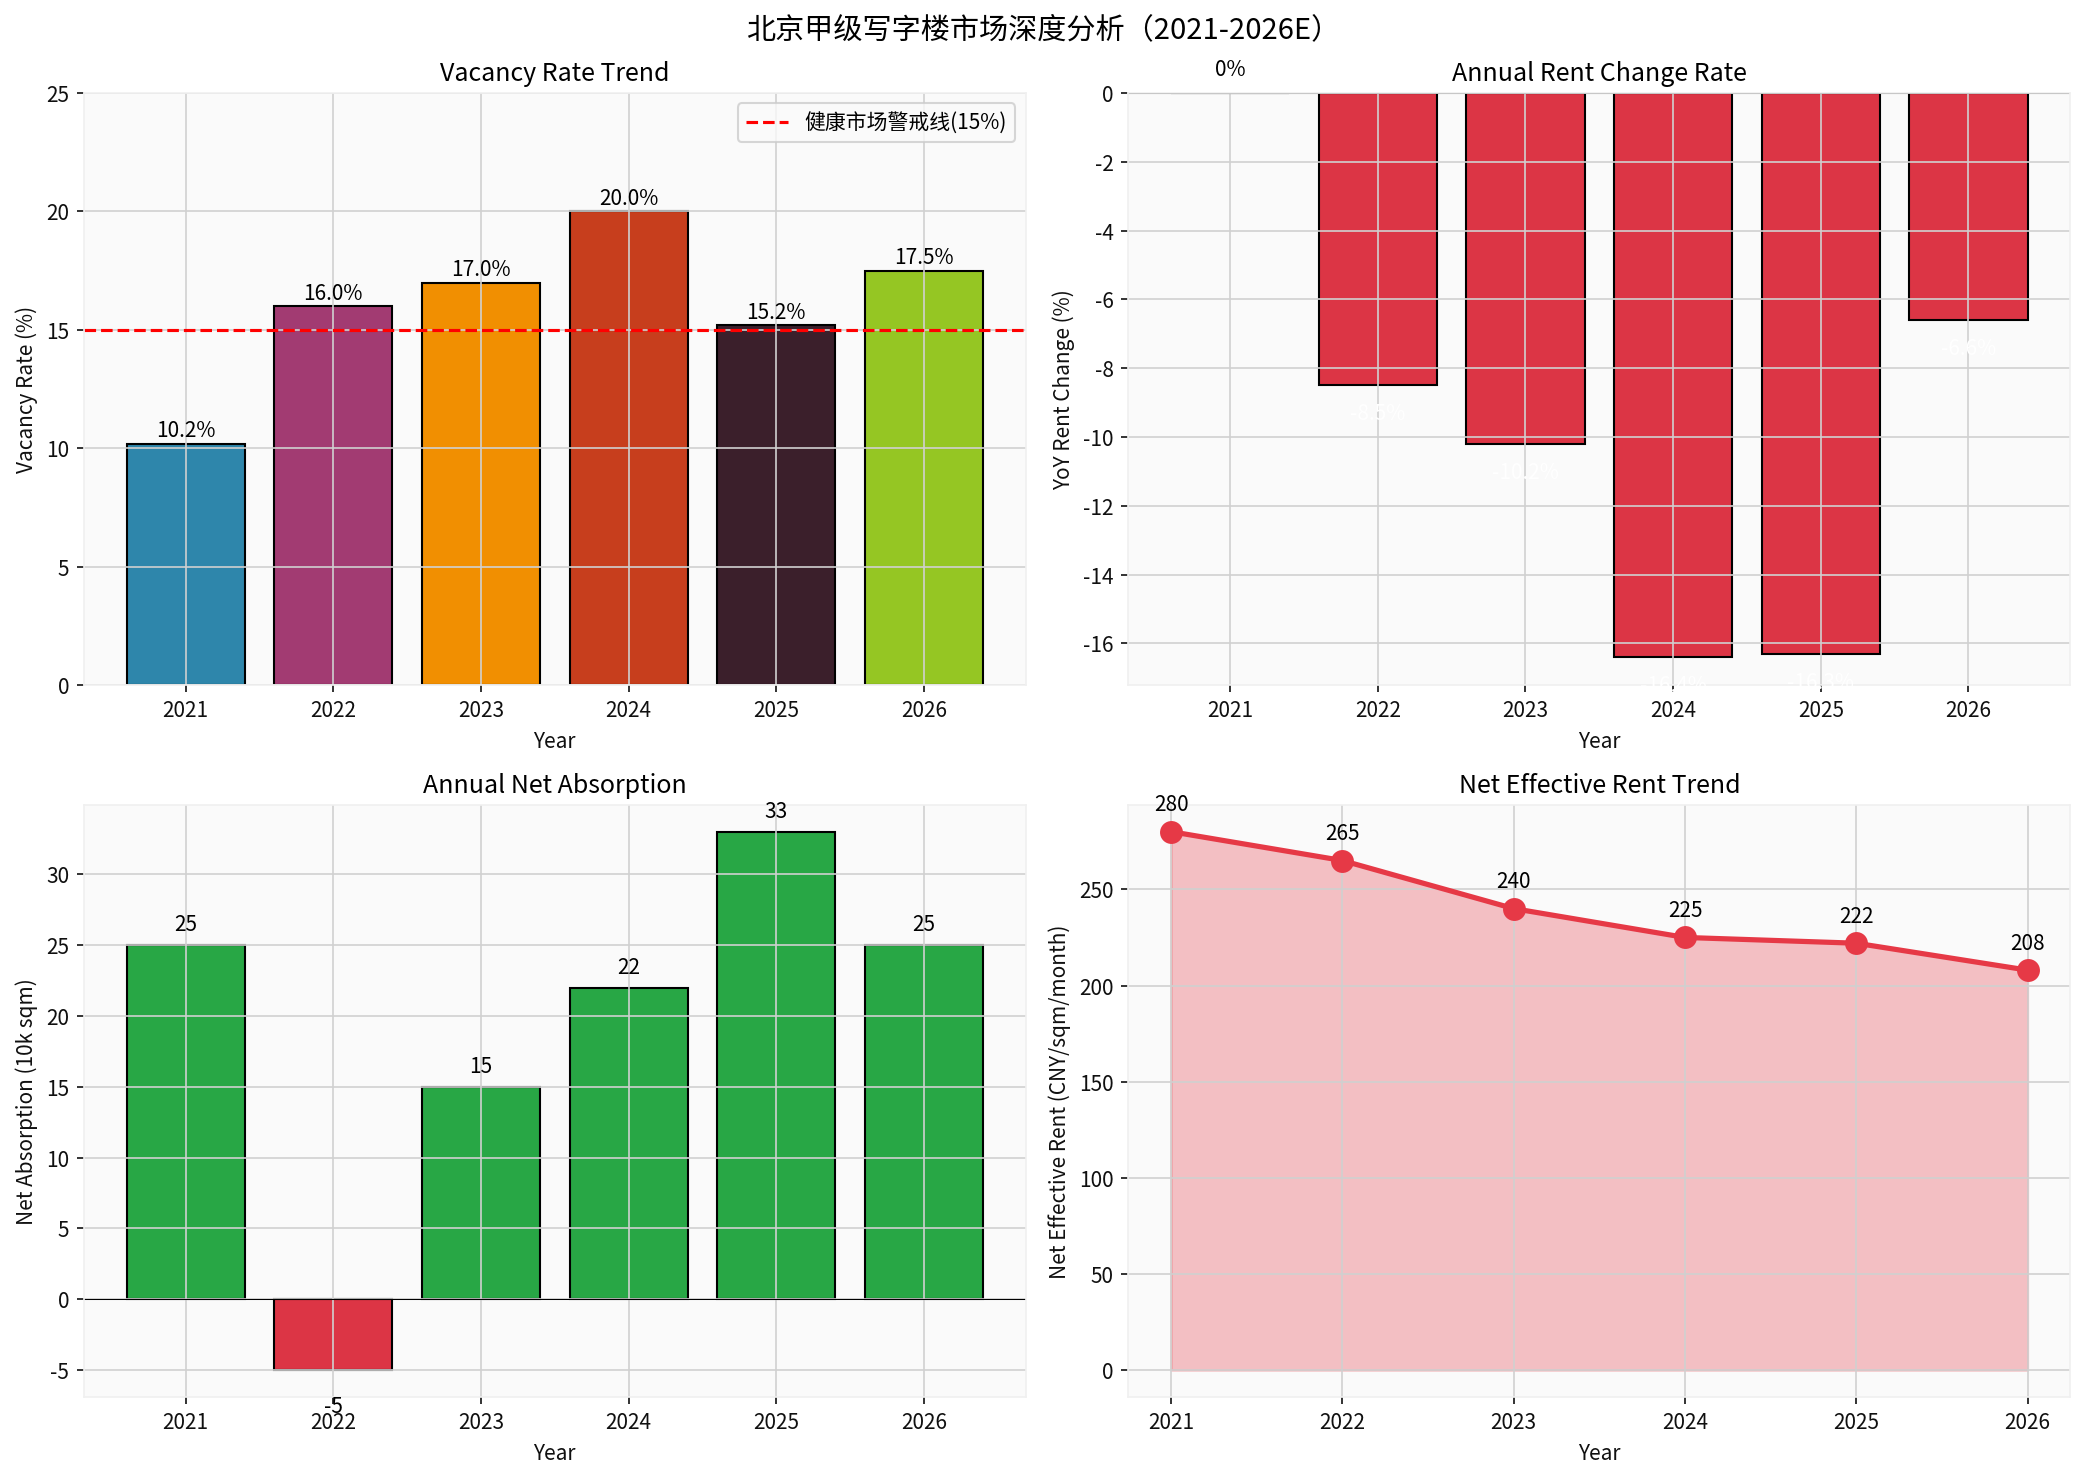
From the perspective of rent, the net effective rent of Beijing’s Grade A office buildings fell to 222 yuan per square meter per month at the end of 2025. Although it decreased by 11.5% year-on-year, the decline narrowed by 4.9 percentage points compared to the previous year[4]. The average rent of mature sub-markets in core areas generally fell by more than 10% year-on-year, and the situation of “trading price for volume” still exists in the market.
Beijing’s office market will face pressure from concentrated new supply in 2026. According to Colliers International data, the new supply in the core market of the Grade A office market will exceed 700,000 square meters in 2026, and a rise in the year-end vacancy rate is inevitable[4]. Based on the distribution of de-stocking volume in the past two years, incremental market demand is highly concentrated in the western sub-markets, but 90% of the projects to be launched in 2026 are concentrated in the eastern sub-markets, which will further intensify competition in the eastern market and exacerbate the geographical supply-demand mismatch in Beijing’s office market[4].
| Indicator | 2024 | 2025 | 2026(E) |
|---|---|---|---|
| Vacancy Rate (%) | 20.0 | 15.2 | 17.5 |
| Year-on-Year Rent Change (%) | -16.4 | -16.3 | -6.6 |
| Net Absorption Volume (10,000 sqm) | 22 | 33 | 25 |
| Net Effective Rent (Yuan/sqm/month) | 225 | 222 | 208 |
Notably, the new supply of office buildings in Beijing in 2025 was approximately 1.8 million square meters, but according to the Industrial Space Adaptability Evaluation System of RET Ruiyide, the proportion of specialized spaces meeting the requirements of emerging industries such as hard technology and life health in terms of floor height, load, and ventilation is less than 30%[5]. This indicates a significant lack of industrial adaptability in existing office buildings.
In 2025, the tenant structure of Beijing’s office market showed significant industry-oriented characteristics. According to monitoring data from China Index Academy, leasing demand is mainly driven by technology, business services, etc.: enterprises in scientific research and technical services account for about 45%, enterprises in information transmission, software and information technology services account for about 13%, and enterprises in leasing and business services, as well as wholesale and retail trade, each account for about 12%. The total proportion of the above four industries exceeds 80%[5].
A report from Cushman & Wakefield points out, from the perspective of leasing demand in Beijing’s office market in the fourth quarter, the three industries of TMT, professional services, and finance accounted for more than 70% of new leasing and relocation transactions, of which the TMT industry accounted for 38.5%, with a transaction share of nearly 45% in the past five years, and the artificial intelligence field has become the core growth driver[5]. Based on the Capital Functional Positioning Evolution Model, RET Ruiyide judges that hard technology enterprises with high R&D attributes and cross-border professional service institutions will gradually fill the demand gap in the next 1-2 years, and the market value standard is rapidly shifting from “location dependence” to “industrial ecosystem adaptability”[5].
The relocation of central enterprise headquarters is releasing over one million square meters of Grade A office building stock space. According to reports from Interface News, this trend has a profound impact on the supply-demand pattern of Beijing’s office market[5]. The situation where some central and state-owned enterprises integrate and move back to their own properties will largely offset the positive impact brought by new demand, and it is expected that some market-oriented projects will still face tenant withdrawal and downsizing in 2026[4].
The introduction of public REITs will drive the transformation of the valuation logic of Beijing’s office assets from the traditional cost approach and market comparison approach to a valuation system centered on the income approach. This transformation is of milestone significance:
- Mainly relies on cost approach or market comparison approach
- Valuation subject is a single asset
- Valuation frequency is mainly annual assessment
- Market participants are mainly institutional investors
- Liquidity premium is not included in valuation considerations
- Centered on income approach (DCF/NOI/Cap Rate)
- Valuation subject is asset portfolio
- Valuation frequency is increased to quarterly disclosure
- Introduces public investor participation
- Liquidity premium is included in the valuation system[3]
The valuation framework of commercial real estate REITs is built around four core indicators:
| Core Indicator | Weight | Calculation Method | Current Status of Beijing Office Buildings |
|---|---|---|---|
| NOI (Net Operating Income) | 40% | Annual Rental Income - Operating Expenses | 222 Yuan/sqm/month × 84.8% Occupancy Rate |
| Cap Rate (Capitalization Rate) | 30% | NOI / Asset Purchase Price | Approximately 4.5%-5.5% (Under Continuous Pressure) |
| P/NAV (Price-to-Net Asset Value) | 20% | Market Value / Net Asset Value | 1.0-1.2x (In a Discount State) |
| Distribution Rate | 10% | Annual Distribution Amount / Market Value | 4.5%-5.5% |
CICC research points out that as of the end of September 2025, the P/NAV valuation of the public REITs market was 1.28x, located at the 80th percentile of history. Although it has adjusted recently, it is still at a relatively high valuation level in history[6]. Taking equity REITs as an example, the distribution rates (TTM) of industrial parks, warehousing and logistics, consumer infrastructure, and affordable rental housing are 4.48%, 4.25%, 3.73%, and 2.91% respectively[6].
The capitalization rate (Cap Rate) of Beijing’s office buildings is under continuous pressure, and it is expected to gradually stabilize under the positive impact of REITs policies. According to CICC analysis, the core concerns of investors mainly focus on key asset indicators (geographic location, occupancy rate, tenant concentration, etc.), compliance (whether asset ownership is clear, etc.), and valuation (mainly using the income approach for valuation, while referring to the valuation of similar assets in public REITs, with a discount rate generally ranging from 6% to 8%)[6].
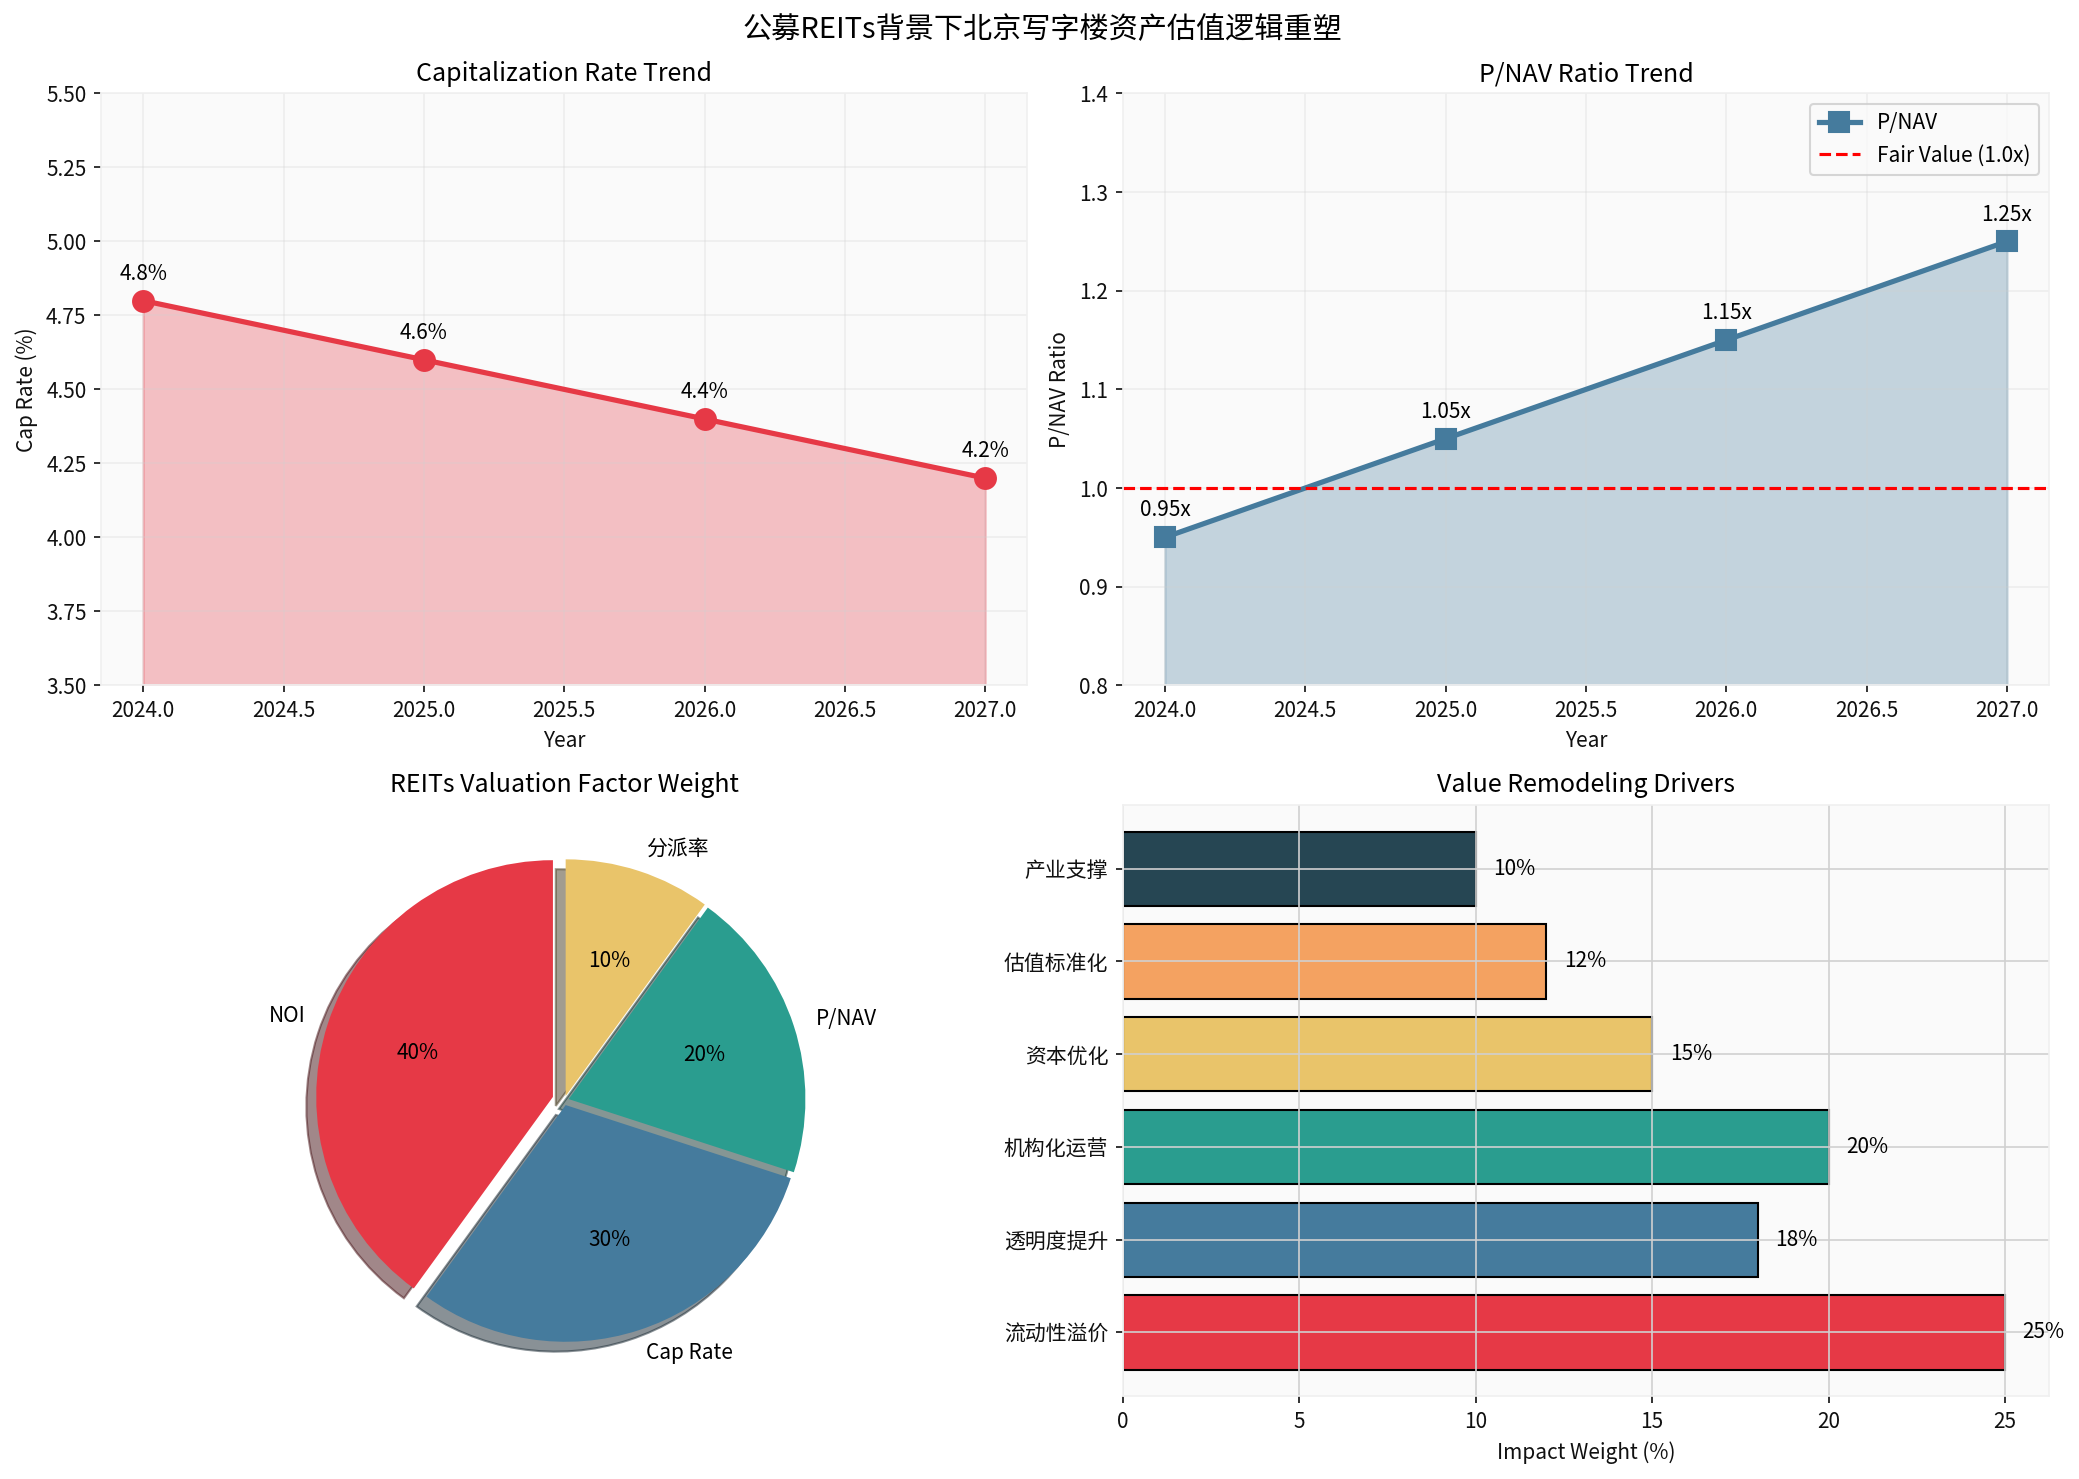
| Year | Capitalization Rate (%) | P/NAV | NOI Growth Rate (%) | Discount Rate (%) |
|---|---|---|---|---|
| 2024 | 4.8 | 0.95 | 0 | 6.5 |
| 2025 | 4.6 | 1.05 | -2 | 6.2 |
| 2026 | 4.4 | 1.15 | 3 | 5.8 |
| 2027 | 4.2 | 1.25 | 5 | 5.5 |
It is expected that with the implementation of REITs policies and the gradual maturity of the market, the capitalization rate will gradually decrease from 4.8% in 2024 to 4.2% in 2027, a decrease of about 60 basis points. This trend reflects the repricing of risk premiums for commercial real estate REITs by investors.
Currently, the P/NAV of Beijing’s office assets is in a discount state, operating in the range of 0.95-1.05x on average. With the provision of exit channels by REITs, improved transparency, and the advancement of institutionalized operations, it is expected that P/NAV will gradually recover to the range of 1.15-1.25x, implying a 15-20% valuation upside potential[3].
Huatai Securities points out that REITs are expected to increase the variance of management premiums, thereby further promoting the revaluation of high-quality related assets and enterprises[3]. Mature operators have already formed scales, and the vigorous promotion of REITs is expected to catalyze further concentration, break the constraints of high asset illiquidity, further open up the closed loop of investment, financing, operation, and exit, and enhance asset liquidity[3].
The most direct value reconstruction brought by REITs to Beijing’s office assets lies in the fundamental improvement of liquidity. Under the traditional model, office asset investment has a long cycle and limited exit channels, and liquidity discounts are widespread. The introduction of REITs will:
- Provide Standardized Exit Channels: Public REITs provide an exit channel for private REITs and direct investments, forming a complete investment chain[6]
- Reduce Investor Thresholds: Public investors can participate in commercial real estate investment and share rental income and capital appreciation
- Narrow Valuation Discounts: Improved liquidity is expected to drive P/NAV to recover from the current 0.95x to above 1.15x
- Increase Transaction Activity: The scale of the private REITs market is growing rapidly, with 14 issues launched as of the end of September 2025, with a cumulative issuance amount of 21.381 billion yuan[6]
The CSRC requires the construction of a “1+3+N” institutional system, implementing differentiated information disclosure standards for different business types such as commercial retail, office, and hotel[2]. This institutional arrangement will significantly enhance market transparency:
- Mandatory Information Disclosure: Fund managers are required to disclose the composition and operation status of each business type
- Valuation Standardization: Unify valuation methodologies to reduce valuation differences
- Regular Performance Disclosure: Disclose operating data quarterly to improve market efficiency
- Clear Regulatory Responsibilities: All regulatory authorities perform regulatory and risk monitoring duties in accordance with laws and regulations
Under the REITs model, professional REITs management institutions will replace traditional property managers, promoting a fundamental transformation of the operation model of office assets:
| Operation Dimension | Traditional Model | REITs Model |
|---|---|---|
| Management Role | Property Manager | Industry Partner |
| Profit Model | Mainly Rental Income | Rental Income + Value-Added Services + Capital Operations |
| Cost Control | Passive Management | Active Asset Management |
| ESG Compliance | Lagging Response | Pre-Deployment |
| Digitalization Level | Nearly Half of Projects Not Intelligent | Comprehensive Digital Transformation |
RET Ruiyide points out that holders must completely abandon the “property manager” mindset and transform into “industry partners”[5]. On the product side, it is necessary to build a three-dimensional matrix of “basic office space + professional space + ecological services”, focusing on configuring customized spaces adapted to future industries[5].
The public REITs policy is highly aligned with the “14th Five-Year Plan” industrial policy, and the value standard of Beijing’s office market is rapidly shifting from “location dependence” to “industrial ecosystem adaptability”[5]. This transformation has a profound impact on investment value assessment:
- Aggregation Degree of Technology Enterprises (TMT accounts for 38.5%, with transactions close to 45% in the past five years)
- Carrying Capacity of Hard Technology Innovation Enterprises (Spaces meeting requirements of floor height, load, and ventilation)
- Density of Professional Service Institutions (Growing demand for cross-border professional service institutions)
- Space Allocation for Life Health Industry (Demand from biomedicine and medical device enterprises)
Against the backdrop of market structural differentiation, the investment value of different types of assets shows significant differences:
| Asset Type | Expected Distribution Rate | Capital Appreciation Potential | Risk Level | Liquidity | Suitable Investors |
|---|---|---|---|---|---|
| Grade A Office Buildings in Core Areas | 4.5-5.0% | Medium | Low-Medium | High | Stable Institutional Investors |
| Grade A Office Buildings in Sub-Core Areas | 5.0-5.5% | Medium-High | Medium | Medium | Growth-Oriented Institutional Investors |
| Industrial Parks | 4.8-5.2% | Medium-High | Medium | Medium | Industrial Capital |
| Traditional Warehousing and Logistics | 4.2-4.8% | Medium | Low-Medium | Medium | Conservative Investors |
The
Based on the above analysis, we recommend that institutional investors adopt the following strategies:
- Stable End: Allocate to Grade A office buildings in core locations to obtain stable dividend income
- Growth End: Lay out high-quality assets in industrial parks and sub-core areas to share the dividends of valuation repair
With the maturity of the expansion mechanism, screening high-quality targets with stable underlying asset operations and reasonable valuations to grasp the incremental opportunities brought by expansion will become an important investment logic in 2026[2].
Prioritize office assets agglomerated with TMT, hard technology, and life health industries, as these assets are in line with policy orientation and have stronger rental support.
Assets with professional operation and management capabilities and completed intelligent transformation will obtain management premiums, which should be focused on.
Despite obvious policy benefits, investors still need to pay attention to the following risks:
- Sustained macroeconomic downturn, with effective demand recovery falling short of expectations
- Interest rate fluctuations affecting REITs valuation and distribution rate attractiveness
- Structural demand contraction caused by central enterprise relocation
- Concentrated launch of 700,000 square meters of new supply in 2026, putting pressure on vacancy rates
- Intensified regional supply-demand mismatch, with escalating competition in the eastern market
- Sustained downward pressure on rents, with NOI growth falling short of expectations
- Hidden liabilities or low operational efficiency issues in some assets
- Existing assets with insufficient industrial adaptability face transformation pressure
- Cash flow volatility risks caused by high tenant concentration
- Pilot progress of REITs falls short of expectations
- Secondary market supply shocks disturbing prices (lock-up expiration peak in the first half of 2026)
- Increased compliance costs brought by higher information disclosure and compliance requirements
-
Valuation Paradigm Shift: The introduction of public REITs drives the transformation of the valuation logic of Beijing’s office assets from the cost approach to the income approach, with NOI, Cap Rate, and P/NAV becoming core valuation indicators.
-
Value Revaluation Initiated: Three factors including improved liquidity, enhanced transparency, and institutionalized operations will drive P/NAV to recover from the current 0.95x to the range of 1.15-1.25x, bringing a 15-20% valuation upside potential.
-
Deepening Industry Orientation: The market value standard is shifting from “location dependence” to “industrial ecosystem adaptability”, with TMT, hard technology, and life health industries becoming core demand support.
-
Differentiated Pattern Continues: High-quality assets in core locations and industry-adapted assets will obtain valuation premiums, while assets with traditional operation models face pressure of value revaluation.
Looking forward to 2026 and longer cycles, Beijing’s office market will enter a stage of dual-drive development of “REITs Empowerment + Industrial Upgrade”. With the official implementation of the commercial real estate REITs pilot program, core office assets in Beijing will usher in a historic opportunity for value reconstruction. Investors should grasp the following key trends:
- Short-Term (2026): Focus on valuation repair opportunities, and prioritize the allocation of core assets with industrial agglomeration advantages
- Medium-Term (2027-2028): Focus on differentiation of operational capabilities, and professional operation institutions will obtain management premiums
- Long-Term (2029-2030): Focus on accelerated securitization of existing assets, reshaping the market pattern
Public REITs are not only an important tool for revitalizing existing assets, but also fill the allocation gap of medium-risk, stable-yield assets in a low-interest rate environment[1]. For investors, public REITs have both stable dividend and capital appreciation potential, and their low correlation with mainstream assets makes them an important choice for optimizing asset allocation and diversifying investment risks[1].
[1] Phoenix Net Finance - “Policy Supports Public REITs Entering a Golden Era of Development” (https://i.ifeng.com/c/8pJFi51MufF)
[2] CLS - “Policy Sector Sees a Major Breakthrough, Secondary Market Shrinks to Find Bottom | A Comprehensive View of Public REITs” (https://www.cls.cn/detail/2249133)
[3] Huatai Securities - “Commercial Real Estate REITs Officially Launched” (https://www.163.com/dy/article/KIIUR5Q70519QIKK.html)
[4] China Times - “2025”
Insights are generated using AI models and historical data for informational purposes only. They do not constitute investment advice or recommendations. Past performance is not indicative of future results.
About us: Ginlix AI is the AI Investment Copilot powered by real data, bridging advanced AI with professional financial databases to provide verifiable, truth-based answers. Please use the chat box below to ask any financial question.