Widening Fractures in US Dollar Credit and the Global De-Dollarization Trend: In-Depth Analysis of Gold's Investment Value and US Dollar Asset Allocation Strategies
Unlock More Features
Login to access AI-powered analysis, deep research reports and more advanced features

About us: Ginlix AI is the AI Investment Copilot powered by real data, bridging advanced AI with professional financial databases to provide verifiable, truth-based answers. Please use the chat box below to ask any financial question.
Now, based on the obtained data and news information, I will prepare an in-depth analysis report for you.
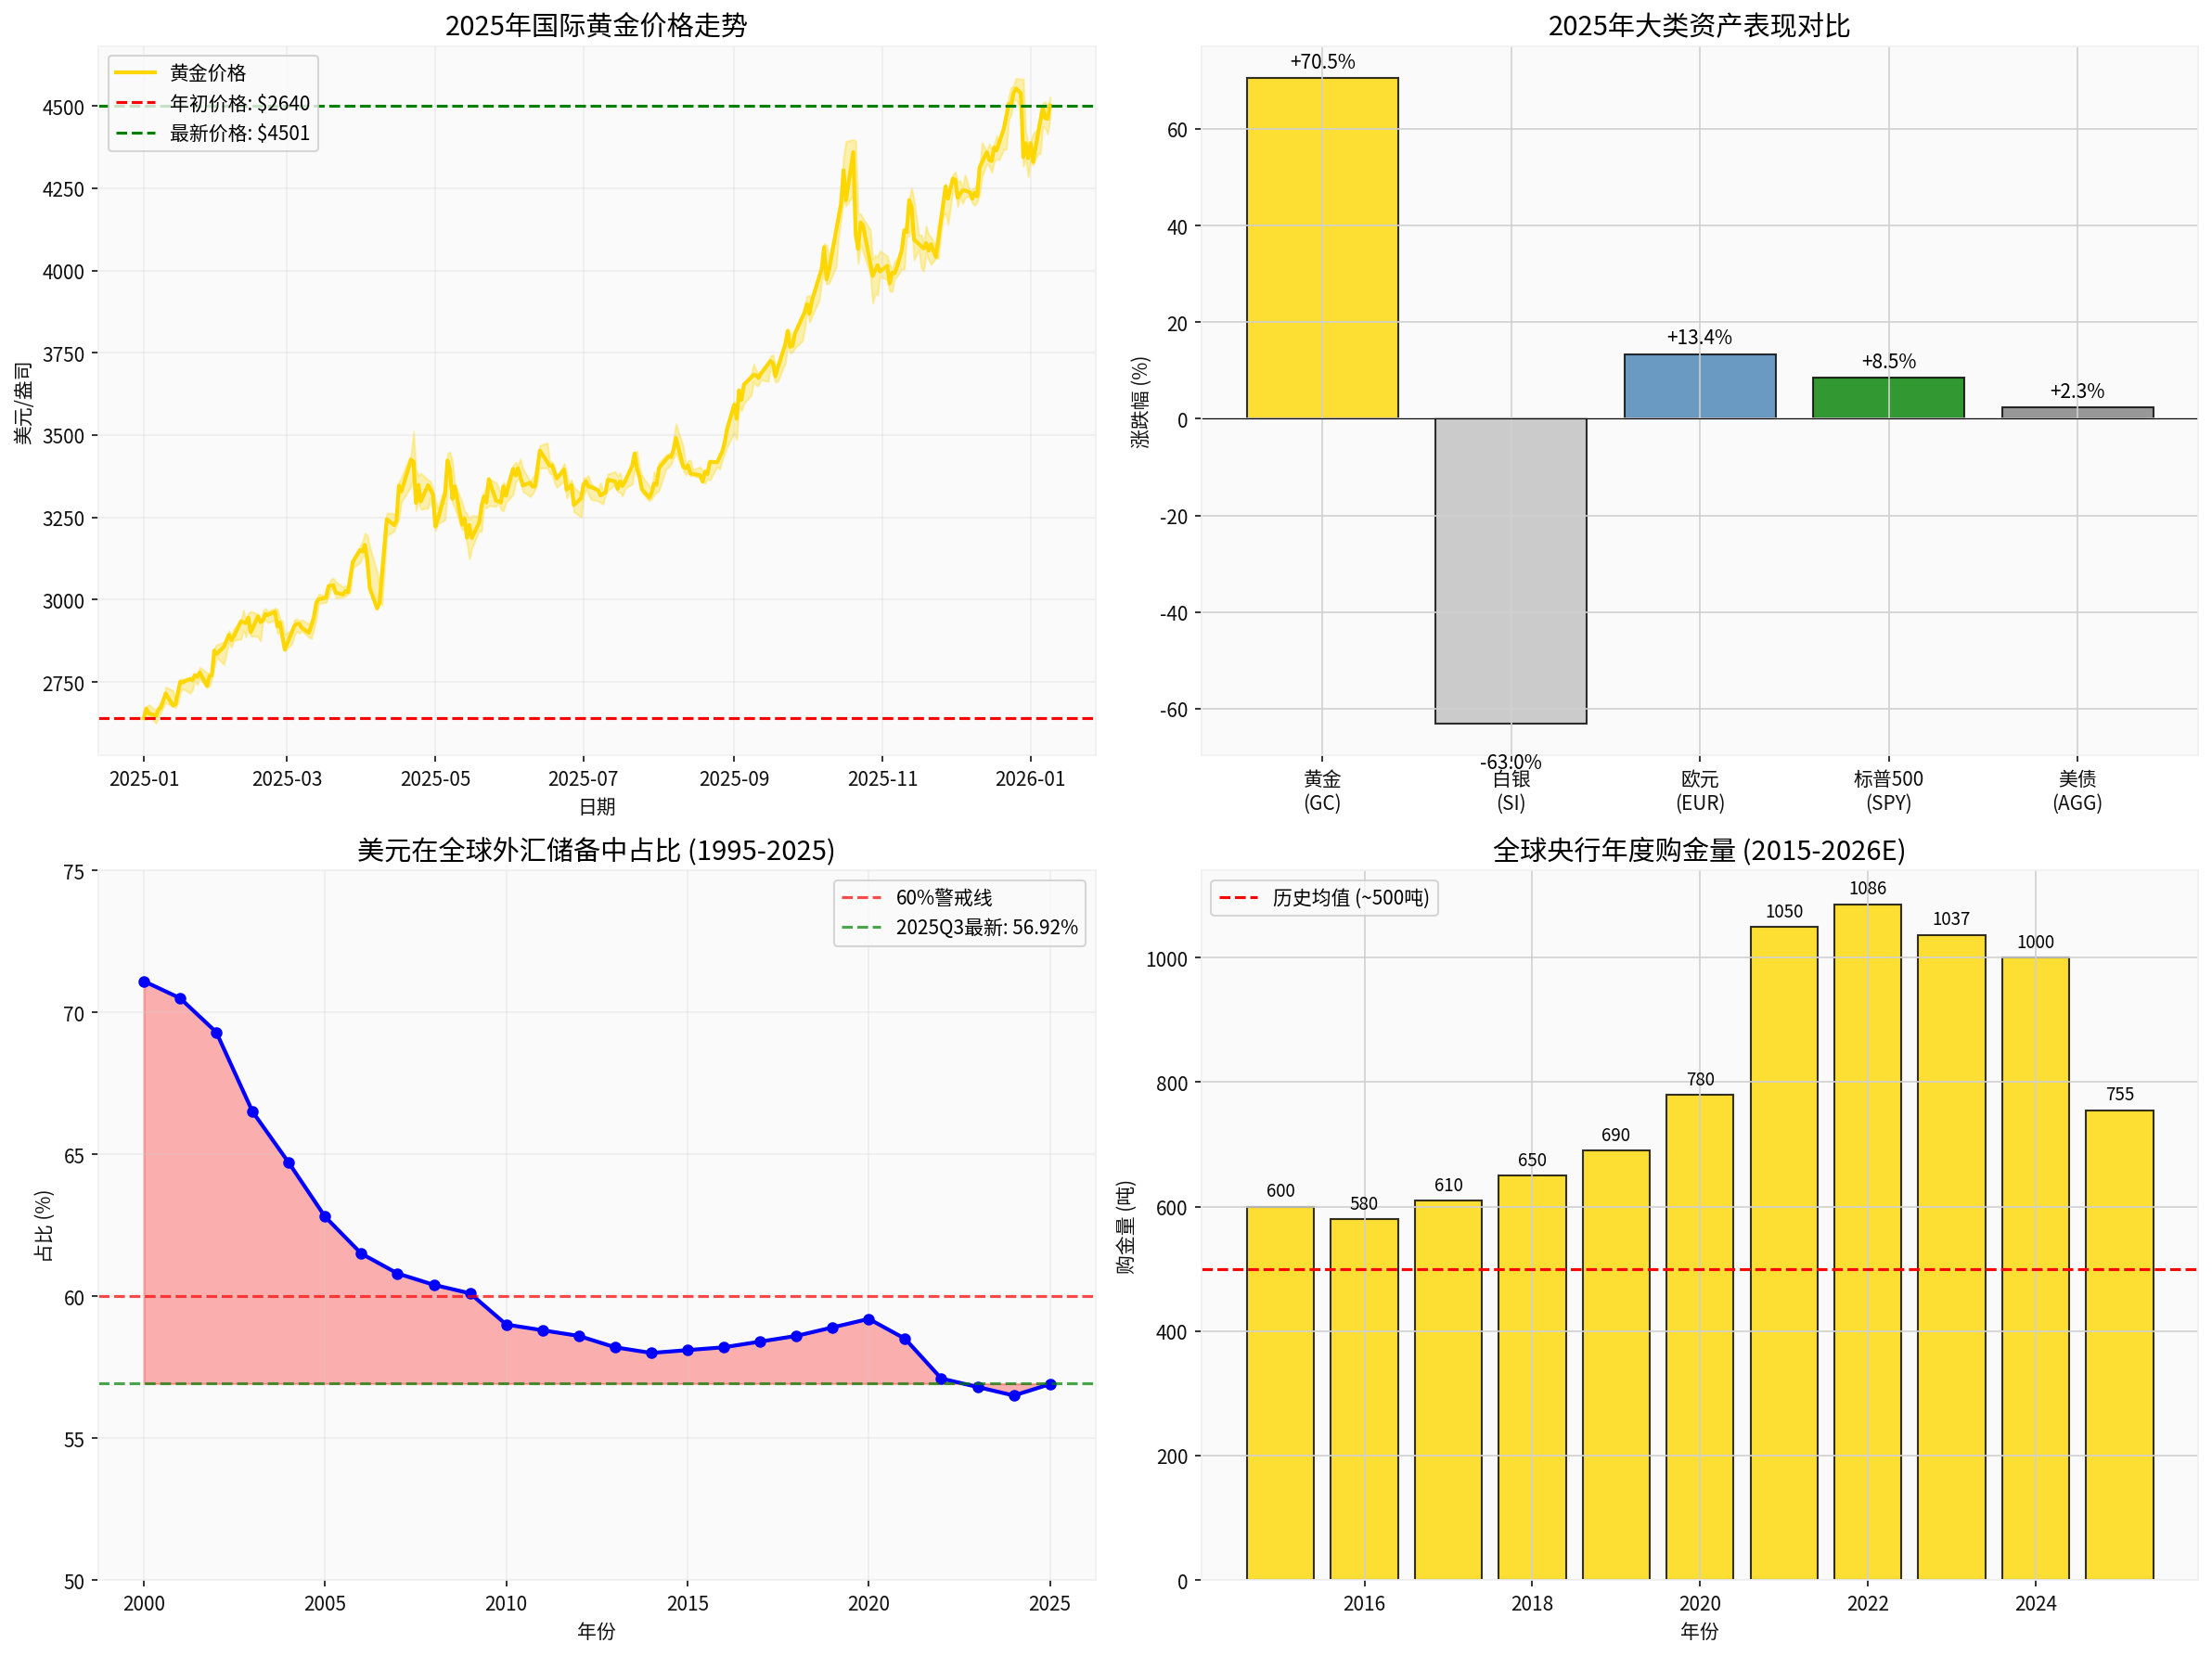
According to the latest market data [0], the 2025 international gold market experienced an unprecedented rally:
| Indicator | Value | Market Implication |
|---|---|---|
Beginning-of-Year Price |
$2,640.10/oz | Benchmark Starting Point |
Latest Price |
$4,500.90/oz | January 9, 2026 |
Annual Increase |
+70.48% |
Best performance in half a century |
Annual High Price |
$4,584.00/oz | Historical Peak |
Number of New Historical Highs |
66 |
Frequent record-breaking within the year |
Price Fluctuation Range |
$1,959.40 | High volatility characteristic |
This increase surpasses the gold bull market during the collapse of the Bretton Woods system in the 1970s (the over 2,300% increase needs to be compared with the absolute price level at that time), making it one of the most spectacular annual rallies in modern financial history [1].
- The US Dollar Index fell from around the 108 level at the start of the year to near 98
- 10.8% drop in the first half of the year, marking its worst performance in 52 years
- The euro rose 13.40% against the US dollar, while the US dollar was basically flat against the Japanese yen
| Time Node | US Dollar Share | Trend |
|---|---|---|
| 1995 | Approx. 58% | Benchmark Level |
| Q4 2024 | Approx. 59% | Continuous decline |
| Q1 2025 | 57.79% | Accelerated decline |
Q2 2025 |
56.32% |
Below 60% for 11 consecutive quarters |
Q3 2025 |
56.92% |
Lowest since 1995 |
The share of the US dollar in global foreign exchange reserves has remained below the key psychological threshold of 60% for over 10 consecutive quarters, marking the entry of the de-dollarization process into an accelerated phase [1].
The current US federal government debt scale has exceeded $38 trillion [1], which carries multiple risks:
- Rapidly Rising Interest Expenditures: In a high-interest rate environment, debt interest has become one of the fastest-growing items in US fiscal spending
- Normalized Fiscal Deficits: The US deficit rate is expected to rebound significantly in 2026 compared to 2025
- Debt Ceiling Crisis: Periodic debt ceiling negotiations have seriously damaged the credit image of the US government
The US government has frequently used the US dollar system as a political tool, seriously damaging the international credibility of the US dollar [1]:
- Financial sanctions against Russia: Freezing of the Russian central bank’s foreign exchange reserves, setting a dangerous precedent
- Weaponization of SWIFT: Politicizing international financial infrastructure
- Asset freezing precedent: Any country holding US dollar assets faces the risk of being sanctioned
As Zhao Gege, Chief Macro Analyst at Everbright Securities, pointed out, US policies such as the arbitrary imposition of tariffs have severely disrupted the international order, further undermining US national credibility and the foundation of US dollar circulation [1].
The “reciprocal tariffs” incident in April 2025 became a landmark node [1]:
- The three major US stock indices plummeted cumulatively over two trading sessions: Dow Jones -9.26%, NASDAQ -11.44%, S&P -10.53%
- The 10-year US Treasury yield rose 48 basis points to 4.5% within a week
- The US Dollar Index fell 4.37% within the month
This “stock-bond-currency meltdown” has shattered the “safe-haven aura” of US dollar assets, completely overturning the traditional logic that US Treasuries, as “safe assets”, would attract safe-haven capital inflows when US stocks fall [1].
Central banks around the world are “voting” with concrete actions:
| Central Bank | Gold Purchasing Actions | Strategic Intent |
|---|---|---|
National Bank of Poland |
Purchased 67 tons of gold cumulatively in the first three quarters of 2025 | Raising the target share of gold reserves from 20% to 30% |
National Bank of Kazakhstan |
Purchased approximately 40 tons of gold in the first three quarters | Continuing to promote reserve diversification |
People’s Bank of China |
Increased holdings for 13 consecutive months, totaling 24 tons in the first three quarters | Reserve asset diversification strategy |
Central Bank of the Republic of Turkey |
Significant gold purchasing actions | Hedging against Turkish lira depreciation risk |
Central Bank of Brazil |
Significant gold purchasing actions | Representative of de-dollarization in emerging markets |
Data from the World Gold Council shows that global central banks purchased over 1,000 tons of gold annually for three consecutive years from 2022 to 2024 [2][3]. The total net gold purchases by global central banks in the first three quarters of 2025 reached 634 tons, which, while lower than the previous peak, is significantly higher than the historical average of approximately 400-500 tons before 2022 [3].
The European Central Bank pointed out in its annual report The International Role of the Euro [1]:
- The share of gold in global reserve assets reached 20% in 2024, exceeding the euro’s 16%
- For the first time since 1996, the share of gold in central banks’ foreign exchange reserves has exceeded that of US Treasuries
- Ray Dalio, founder of Bridgewater Associates, stated bluntly: “Gold is starting to replace US Treasuries as the risk-free asset”
This change is a milestone, marking a fundamental shift in the logic of global reserve asset management.
- ASEAN Consensus (March 2023): Strengthen the use of local currencies and reduce dependence on the US dollar
- Acceleration of local currency settlement: China has signed local currency swap agreements with multiple countries
- Diversification of cross-border payment systems: Systems such as CIPS and SPFS are developing rapidly
According to research from the Financial Markets Department of Agricultural Bank of China [4], gold’s investment value is based on three attributes:
Gold prices show a significant negative correlation with the US Dollar Index. When US dollar credit is damaged, gold, as a physical asset with “no sovereign risk”, naturally undergoes revaluation.
- As a non-interest-bearing asset, gold is negatively correlated with real interest rates
- The Federal Reserve’s interest rate cut cycle began in 2025, further reducing the cost of holding gold
- The market expects the Federal Reserve to cut interest rates twice more by 25 basis points each in 2026 [5]
- Normalization of geopolitical conflicts (Russia-Ukraine, Middle East, East Asia)
- Rising global economic uncertainty
- Supply chain security and the rise of resource nationalism
Research from Allianz Global Investors points out [6] that gold is evolving from a traditional “safe-haven hedging tool” to a “strategic allocation asset”:
- Low correlation: Low correlation with stocks and US Treasuries, effectively playing a diversification role in portfolios
- Physical asset attribute: Cannot be frozen, sanctioned, or devalued
- Liquidity: The world’s third-largest traded asset with ample liquidity
- Stability of intrinsic value: Unaffected by any sovereign credit endorsement
| Institution | Target Forecast Price | Time Node | Core Logic |
|---|---|---|---|
World Gold Council |
Break through $5,000 | 2026 | Central bank gold purchases + de-dollarization |
JPMorgan Chase |
$5,055 | End of 2026 | Macroeconomic support |
Goldman Sachs |
$4,900 | December 2026 | 14% increase |
UBS |
$4,800 | End of 2026 | Beware of pullback risks |
Citigroup |
$6,000 | 2027 | Long-term bullish |
- Gold prices are already at an absolute historical high, with some positive factors fully priced in
- Changes in Federal Reserve policy expectations may trigger volatility
- Increasing risk of technical pullbacks
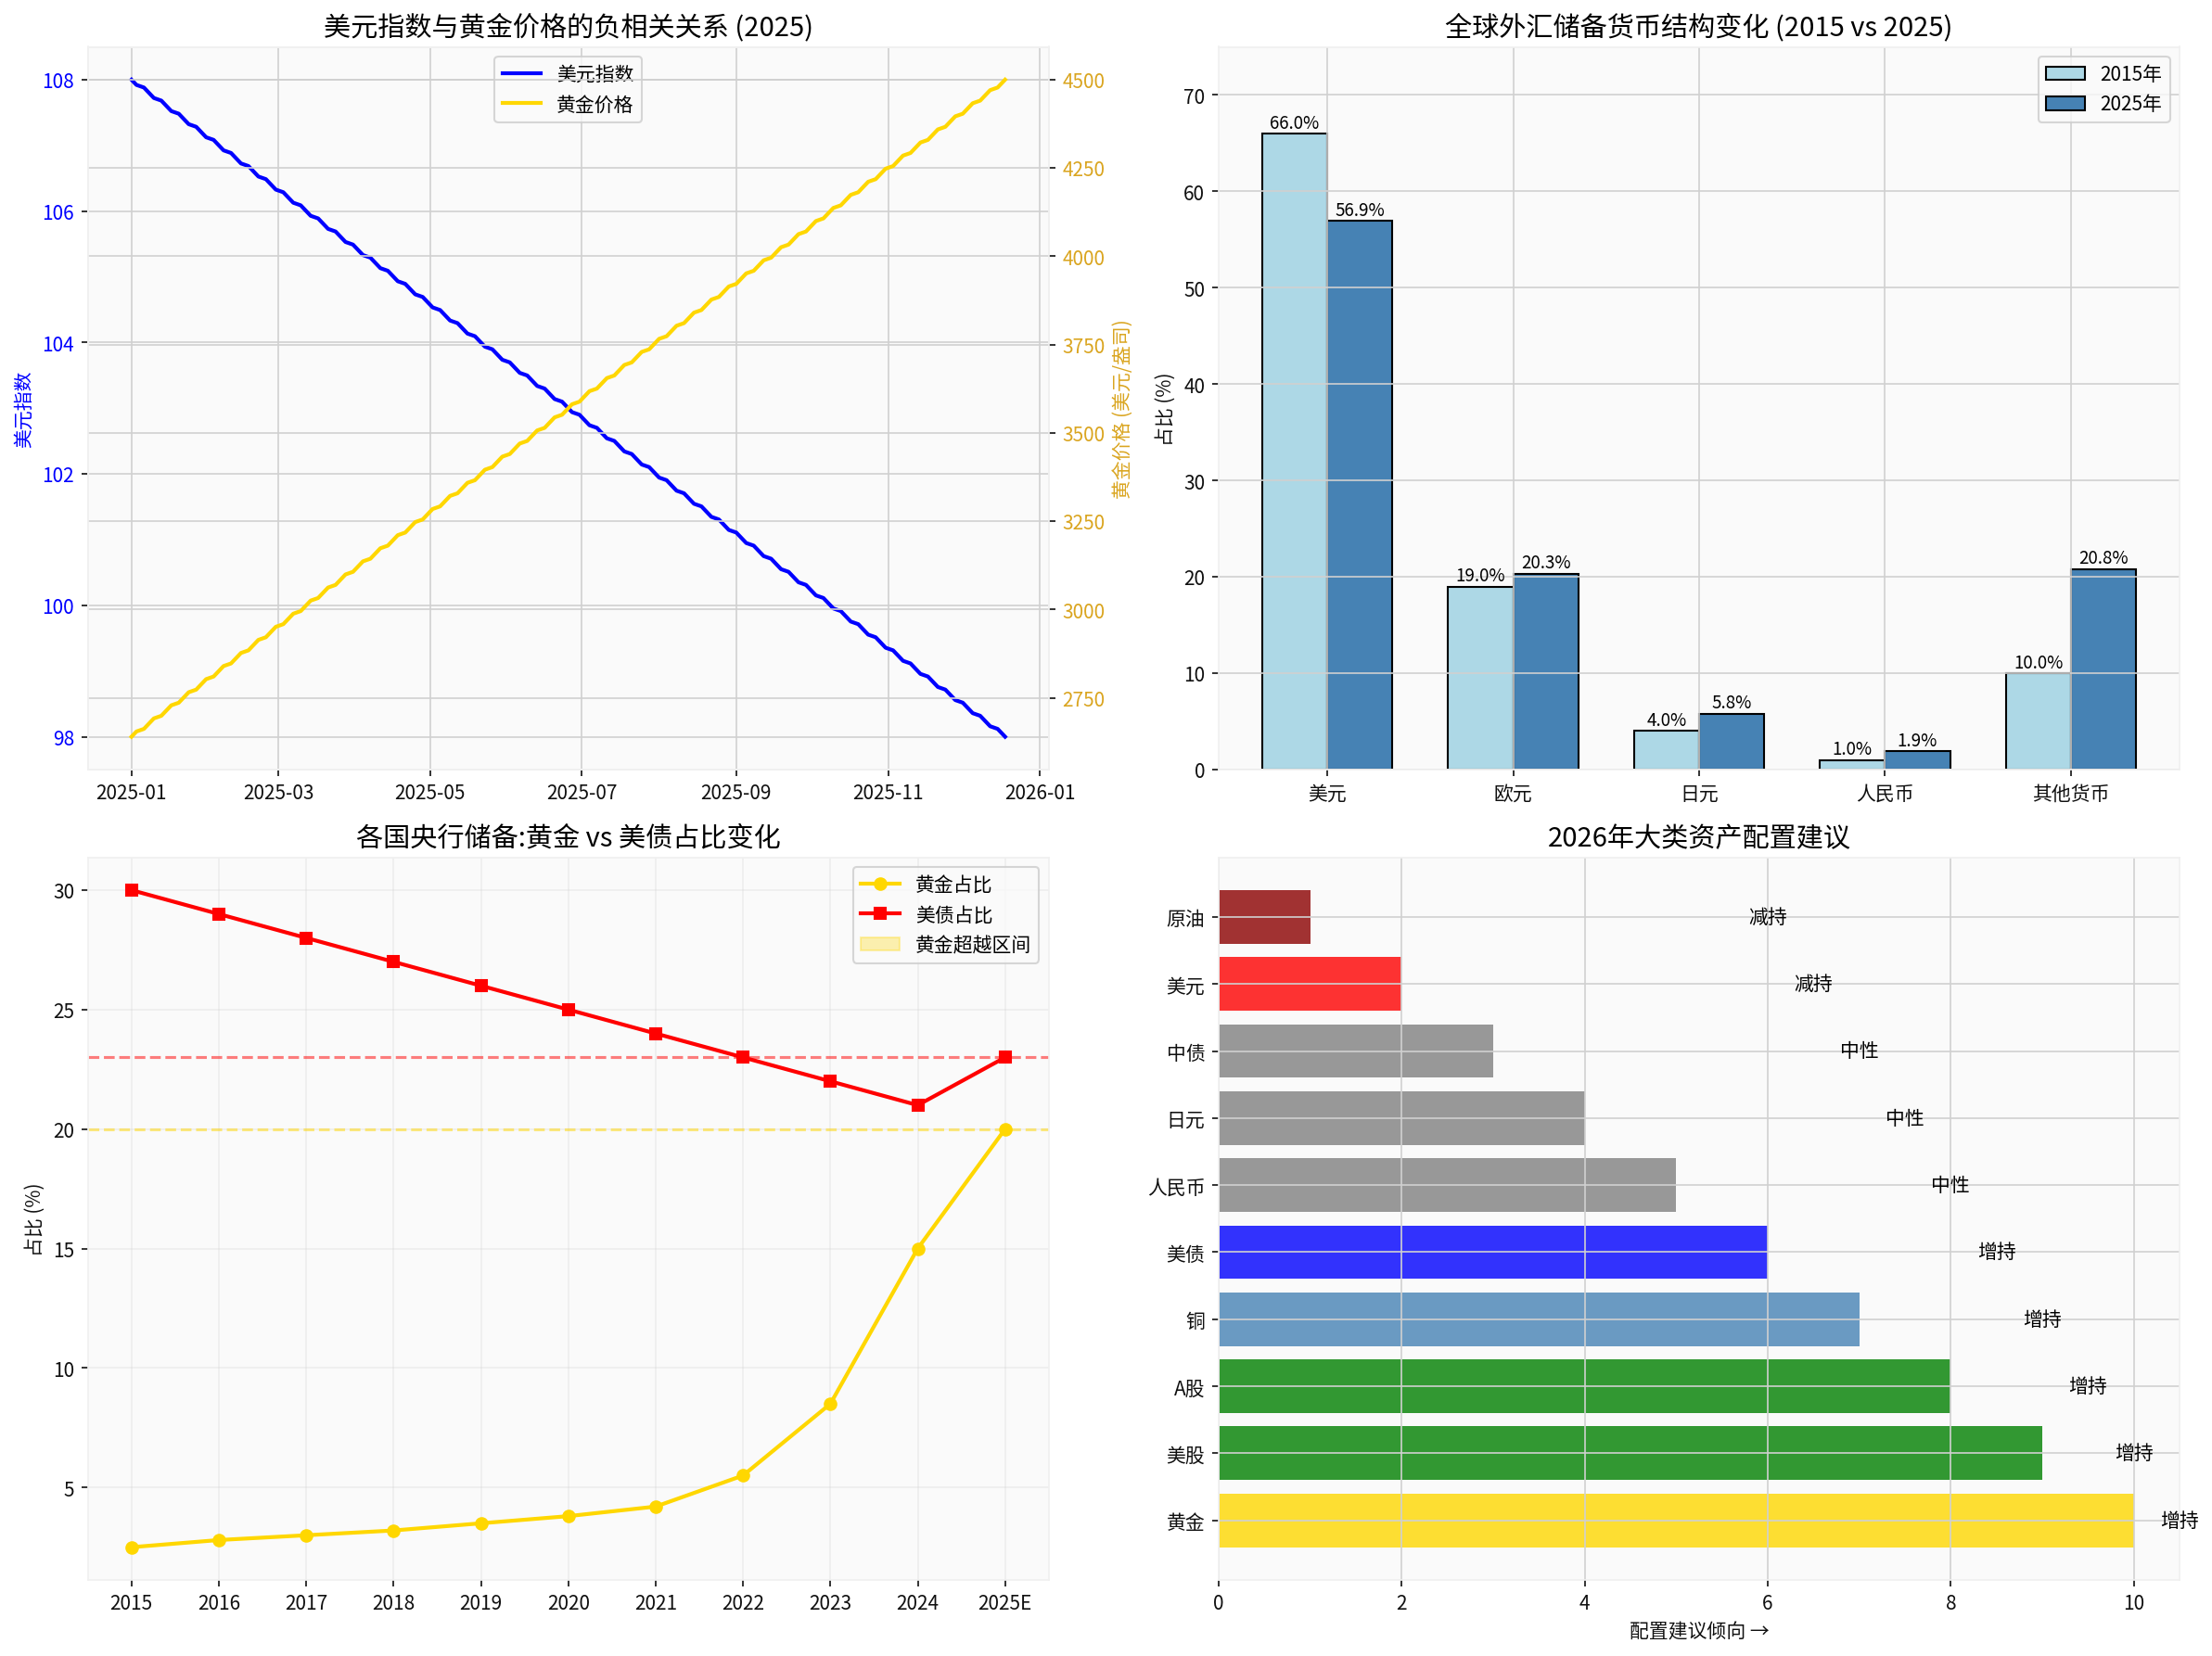
According to forecasts from institutions such as TF Securities and BOCOM International [5][7], the 2026 ranking of major asset allocation is:
- Short-to-medium-term US Treasuries are more advantageous: Bonds with maturities of less than 10 years can benefit more directly from interest rate cuts and liquidity easing
- Coupon yields remain attractive: The current 10-year US Treasury yield remains above 4%
- Short-term bonds are better than long-term bonds: The yield curve is expected to steepen further
- The Dow Jones may offer better value for money: The NASDAQ and S&P 500 are already highly valued, with weak profit expansion
- Volatility is expected to increase: Uncertainty from the 2026 midterm elections will increase market volatility
- Increased divergence among tech stocks: AI investment is shifting from the “burst period” to “in-depth implementation”
| Investor Type | Recommended Allocation Ratio | Participation Method |
|---|---|---|
Conservative |
5%-8% | Gold ETFs, bank accumulated gold |
Balanced |
8%-12% | Gold ETFs + physical gold bars |
Aggressive |
10%-15% | Gold ETFs + gold stock ETFs |
Institutional Investors |
5%-15% | Multi-level allocation |
- Build positions in batches: Avoid heavy one-time positions to smooth out volatility risks
- Hold long-term: Treat gold as the “ballast” of the asset portfolio
- Layout during pullbacks: Technical pullbacks are viewed as allocation opportunities rather than selling points
Traditional 60/40 Portfolio (Stocks/Bonds):
  - US Stocks: 40%
  - US Treasuries: 40%
  - Other: 20%

Recommended Adjustment (2026 Version):
  - US Stocks: 25%-30% (Gradual reduction)
  - US Treasuries: 15%-20% (Short-term bonds primarily)
  - Gold: 8%-12% (Strategic increase)
  - A-Shares/Hong Kong Stocks: 15%-20% (Increase allocation to emerging markets)
  - Other Currency Assets: 10%-15%
- The widening of US dollar credit fractures is structural: The superposition of three factors—fiscal crisis, currency weaponization, and convergence of relative economic advantages—puts medium-to-long-term pressure on the US dollar
- De-dollarization has entered an accelerated phase: The US dollar’s reserve share has been below 60% for 11 consecutive quarters, gold’s reserve share has historically surpassed that of US Treasuries, and central bank gold purchases have become the new normal
- The logic of the gold bull market is solid: Supported by four factors—monetary credit restructuring, central bank gold purchases, safe-haven demand, and declining real interest rates—gold is expected to maintain a volatile upward trend
- Asset allocation needs to keep pace with the times: Reduce reliance on single US dollar assets, increase allocations to gold and emerging markets, and prioritize short-term bonds
- Gold: Expected to rise 15%-30%, with potential to break through $5,000, but the increase may be weaker than in 2025
- US Dollar: Expected to fall first then fluctuate, with a potential low near 95
- US Treasuries: Yields will fluctuate at high levels, with short-term bonds relatively better than long-term bonds
- US Stocks: Expected to close higher for the year, but volatility will increase, with profit growth still supported
“Against the backdrop of global monetary credit restructuring, continuous central bank gold purchases, and persistent safe-haven demand, gold’s long-term allocation value remains prominent. It is recommended that investors participate rationally based on the principles of ‘long-term perspective and phased layout’.” [8]
“Gold is not a speculative tool, but a ‘strategic core position’ or ‘bottom-of-the-chest’ asset in asset allocation. The true essence of gold investment is safety.” [3]
[1] Shanghai Securities News - “The International Monetary System Is Accelerating Towards Multipolar Fragmentation” (https://paper.cnstock.com/html/2025-12/23/content_2161581.htm)
[2] China Fortune Network - “The International Monetary System Is Accelerating Towards Multipolar Fragmentation” (https://www.cfbond.com/2025/12/23/wap_991115293.html)
[3] Cailive China - “Gold Repeatedly Trending! Industry Analysis of 2026 Market Trends” (https://www.caishiv.com/insight/detail?id=31324)
[4] Financial Market Research - “Looking at Global Major Asset Allocation from the Gold Bull Market” (https://www.nafmii.org.cn/yj/jrscyj/qk/2025/202504/202504/P020250414376194513718.pdf)
[5] 21st Century Business Herald - “TF Securities 2026 Annual Strategy | Fixed Income: 2026 Asset Allocation: Opportunities Amid Overseas Fiscal Expansion” (https://www.21jingji.com/article/20251229/herald/4af2b72aab8b0341ae4d599d82fec4b2.html)
[6] Allianz Global Investors China - “2026: Does Gold Still Have Allocation Value?” (https://www.allianzgi.com.cn/contents/2026/1/7-546b45f5d59043e0ac998b786ae5be0d.html)
[7] BOCOM International - “Asset Allocation Model Series” (https://pdf.dfcfw.com/pdf/H3_AP202512041793596908_1.pdf)
[8] Sina Finance - “2026 Lunar New Year Gold Allocation Guide: Focus on the Allocation Logic and Operational Recommendations of Gold Fund ETFs” (https://finance.sina.com.cn/roll/2026-01-09/doc-inhfsnix0651060.shtml)
Insights are generated using AI models and historical data for informational purposes only. They do not constitute investment advice or recommendations. Past performance is not indicative of future results.
About us: Ginlix AI is the AI Investment Copilot powered by real data, bridging advanced AI with professional financial databases to provide verifiable, truth-based answers. Please use the chat box below to ask any financial question.