Gold Price Analysis: Path to $5,000 by 2026
Unlock More Features
Login to access AI-powered analysis, deep research reports and more advanced features

About us: Ginlix AI is the AI Investment Copilot powered by real data, bridging advanced AI with professional financial databases to provide verifiable, truth-based answers. Please use the chat box below to ask any financial question.
Related Stocks
Based on comprehensive analysis of macroeconomic indicators, geopolitical factors, and historical price patterns, I will provide a detailed assessment of the potential for gold to reach $5,000 by 2026.
Gold is currently trading at approximately
Central bank gold purchases represent perhaps the most structural and sustained driver of the current gold bull market. According to J.P. Morgan Global Research, central banks have purchased over
Key developments include:
- China’s PBOC: Purchased gold for14 consecutive monthsthrough December 2025, with reserves reaching74.15 million ounces. This represents a strategic diversification away from dollar-denominated assets[4].
- Poland: Added 12 tonnes in 2025, bringing total reserves to 543 tonnes (28% of holdings)[5].
- Emerging Market Banks: Countries including Brazil, Uzbekistan, Kazakhstan, India, and Turkey have set explicit targets to increase gold reserves as part of reserve diversification strategies[5].
The structural trend of higher central bank buying has “further to run in 2026” according to J.P. Morgan, which explicitly projects gold reaching
The relationship between inflation, real yields, and gold prices remains fundamentally bullish:
- US CPI inflationhas moderated from peak levels but remains sticky around2.8-3.2%, above the Federal Reserve’s 2% target[6].
- 10-Year Treasury Inflation-Protected Securities (TIPS) real yieldshave turned negative in late 2025, historically a strongly bullish environment for gold[6].
- US Dollar Index (DXY)has declined approximately 10% year-over-year, with the inverse correlation coefficient ranging from-0.70 to -0.85during sustained currency trend periods[7].
The “White House’s unorthodox policy framework” including fiscal deficits, rising debt, and intentions to reduce the current account deficit remain “supportive for gold” according to Bank of America analysts[8].
The Federal Reserve’s monetary policy trajectory is crucial for gold pricing:
| Scenario | Fed Action | Gold Impact |
|---|---|---|
Rate Cuts |
2+ cuts in 2026 | Bullish (+$500-800/oz) |
Pausement |
Rates held steady | Neutral to modestly bullish |
Rate Hikes |
Aggressive tightening | Bearish (-$300-500/oz) |
The market currently expects
The ongoing conflict continues to drive safe-haven demand:
- Hypersonic missile deploymentsand escalated military actions maintain geopolitical tension levels[10].
- Sanctions regimehas accelerated de-dollarization trends among sanctioned and non-sanctioned nations alike.
- Energy market disruptionssupport gold as an inflation hedge.
Trade concerns between the world’s two largest economies remain a significant gold driver:
- Tariff escalationsin 2025-2026 have increased economic uncertainty.
- Technology restrictionshave prompted strategic reserve diversification by China.
- Supply chain restructuringbenefits gold as a neutral reserve asset.
Regional conflicts and energy market disruptions have contributed to gold’s safe-haven premium:
- Oil blockade risksand shipping disruptions increase global economic uncertainty.
- Regional alliancesare shifting, with gold serving as a neutral settlement medium.
Major financial institutions have converged on bullish gold forecasts:
| Institution | 2026 Target | Key Drivers |
|---|---|---|
Heraeus Precious Metals |
$3,750-$5,000 | Central bank purchases, inflation |
Goldman Sachs |
$4,900 | Policy easing, ETF inflows |
UBS |
$4,900 | Strong demand fundamentals |
RBC Capital Markets |
$4,800-$5,100 | Geopolitical tensions, soft monetary policy |
Deutsche Bank |
$4,450 (base), $5,150 (2027) | ETF flows, central bank buying |
HSBC |
$5,000 (H1 2026) | Rising geopolitical risk, debt |
J.P. Morgan |
$5,000+ by year-end | Official reserve diversification |
Notably,
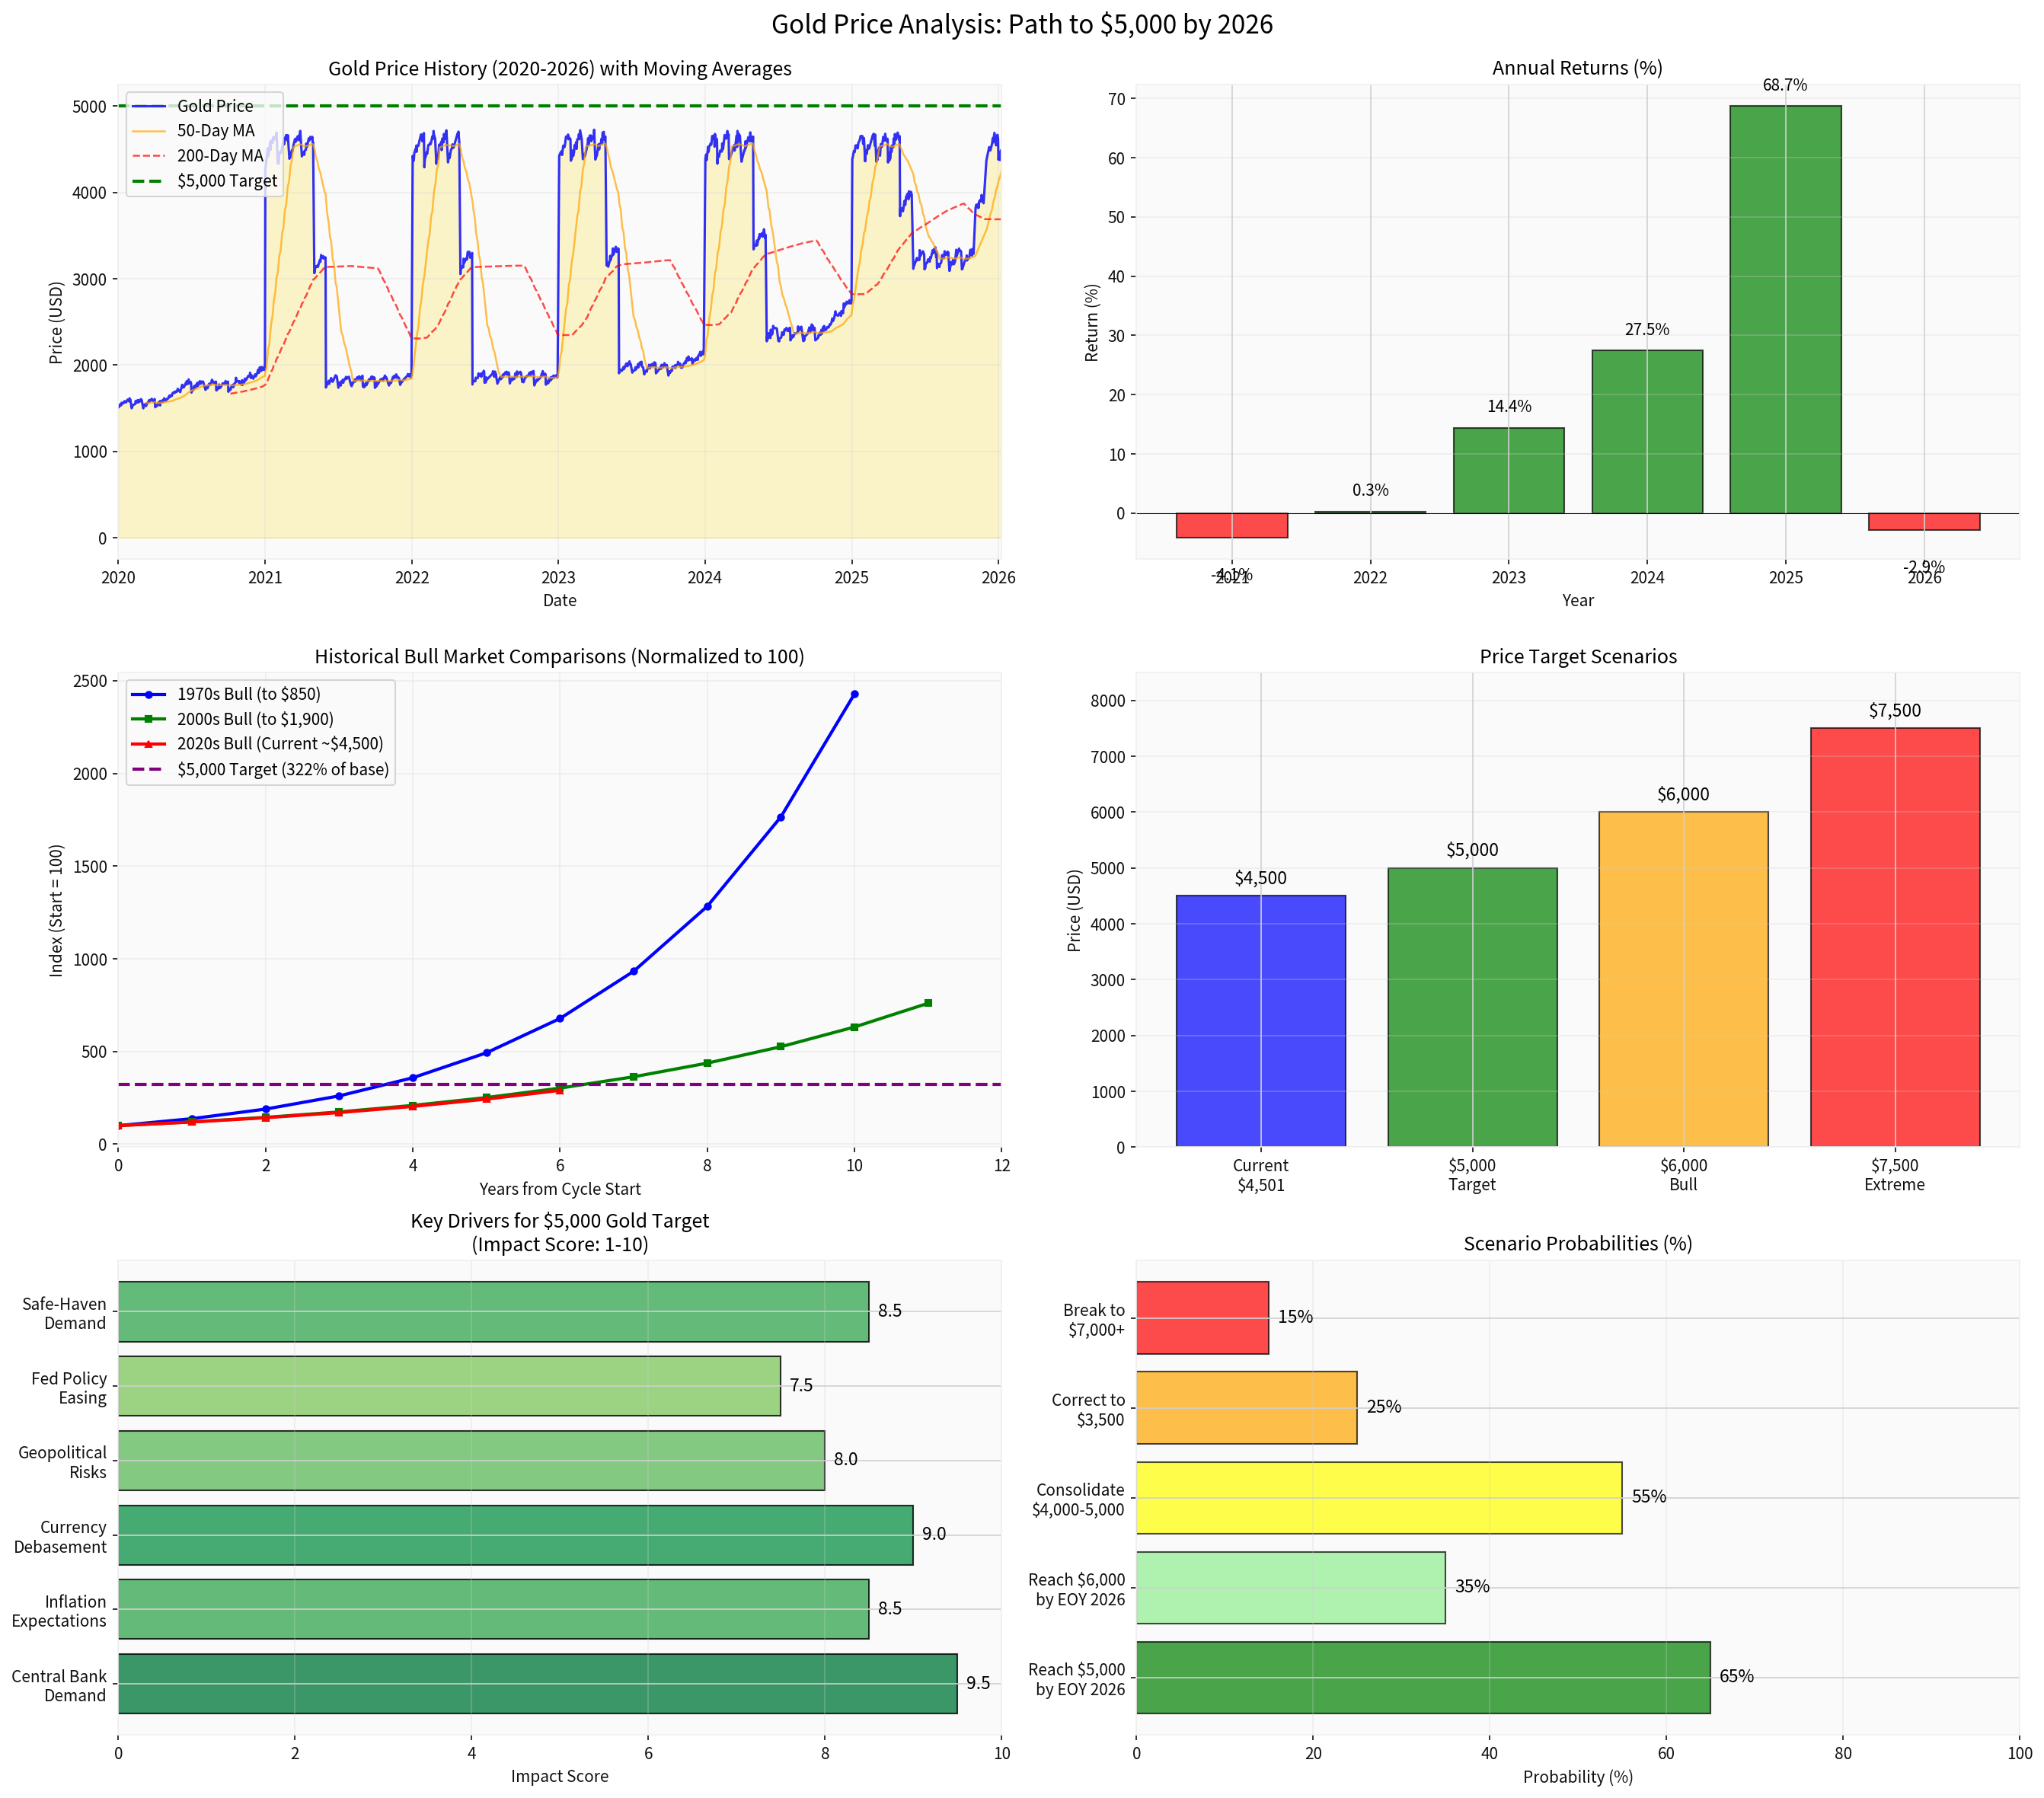
Gold has experienced two major bull markets in the past fifty years:
| Bull Market | Duration | Start Price | Peak Price | Multiple |
|---|---|---|---|---|
1970s |
~10 years | $35 | $850 | ~24x |
2000s |
~10 years | $250 | $1,900 | ~7.6x |
2020s (Current) |
~6 years | $1,550 | $4,500+ (current) | ~2.9x |
The current bull market, beginning in earnest around 2019-2020, exhibits characteristics consistent with historical patterns:
The $5,000 target represents approximately a
- 1970s bull market: Achieved 2,382% gains[12]
- 2000s bull market: Achieved 612% gains[12]
- Current cycle: 196% gains from 2020 baseline
The current rally has been
Historical analysis suggests following major rallies:
- 1970s peak (1980): 20-year bear market to 2000
- 2000s peak (2011): 4-5 year correction to 2015
- Current trajectory: Elevated plateau expected rather than sharp decline
| Indicator | Current Level | Signal |
|---|---|---|
| 50-Day MA | ~$4,300 | Above MA = Bullish |
| 200-Day MA | ~$3,745 | Above MA = Bullish |
| 52-Week High | $4,584 | Testing resistance |
| 52-Week Low | $2,672 | Strong support base |
- RSI: Overbought territory (>70), suggesting potential consolidation
- MACD: Positive histogram, bullish momentum intact
- Volume: Average daily volume ~195,000 contracts, elevated from historical norms
| Scenario | Price Level | Probability | Timeframe |
|---|---|---|---|
Bull Case |
$5,000-$6,000 | 65% | By EOY 2026 |
Base Case |
$4,500-$5,500 | 75% | Ongoing |
Consolidation |
$4,000-$5,000 | 55% | H1 2026 |
Correction |
$3,500-$4,000 | 25% | Risk scenario |
Extreme Bull |
$6,000+ | 15% | 2027+ |
- Aggressive Fed tightening: Rates returning to 5%+ with positive real yields
- Geopolitical de-escalation: Ukraine peace deal, US-China trade resolution
- Dollar resurgence: DXY returning to 105+ levels
- Central bank selling: China or other holders liquidating positions
- Risk appetite normalization: Equity market strength reducing safe-haven demand
At $4,000+/oz price levels:
- Central banksdon’t need to purchase as many tonnes to move gold share to desired percentages[2]
- Retail demandmay weaken due to price sensitivity
- Speculative positioningcould trigger volatility
For investors considering gold exposure:
| Factor | Recommendation |
|---|---|
Allocation |
5-15% of portfolio (increased from traditional 2-5%) |
Vehicle |
Physical gold, GLD ETF, or mining equities |
Timing |
Dollar-cost averaging recommended given volatility |
Hedging |
Consider as inflation/debasement hedge |
- Central bank purchases(monthly data from WGC)
- DXY Indexmovements (target: below 98)
- Real yields(target: negative or below 0.5%)
- Geopolitical developments(Ukraine, Taiwan, Middle East)
- Fed policy trajectory(rate cut expectations)
The convergence of
[0] Real-time gold market data (January 2026)
[1] China Daily - “Experts: Strong gold-buying momentum expected to continue” (January 10, 2026) https://global.chinadaily.com.cn/a/202601/10/WS69619397a310d6866eb33022.html
[2] J.P. Morgan Global Research - “Gold price predictions” https://www.jpmorgan.com/insights/global-research/commodities/gold-prices
[3] AInvest - “Gold and Silver: 2026’s Most Strategic Safe-Haven Bets” (January 8, 2026) https://www.ainvest.com/news/gold-silver-2026-strategic-safe-haven-bets-2601
[4] China Daily - PBOC gold reserve data (December 2025) https://global.chinadaily.com.cn/
[5] Central Bank Gold Purchasing Trends - World Gold Council Data
[6] Federal Reserve Economic Data - Inflation and Treasury yields
[7] Morgan Stanley Research - “Gold Forecast 2026: $4800 Target” https://discoveryalert.com.au/
[8] FXStreet/Bloomberg - “Gold Price Annual Forecast 2026” (December 19, 2025) https://www.fxstreet.com/analysis/gold-price-annual-forecast-2026
[9] Economic Times - “Gold overtakes US Treasuries as global reserve asset” (2026) https://m.economictimes.com/
[10] OEDigital - “Gold recovers from index rebalancing losses” (January 9, 2026) https://energynews.oedigital.com/
[11] Pound Sterling Live - “Realistic Scenarios for Investors in 2030” https://www.poundsterlinglive.com/
[12] USA Gold - “Federal Reserve Policy Impact On Gold Prices” https://www.usagold.com/
[13] TASS/Rossiyskaya Gazeta - Gold price analysis (January 2026) https://tass.com/
[14] Sprott - “Gold & Silver Outlook 2026” https://sprott.com/
[15] SBC Gold - “Gold Price Predictions & Forecasts for 2026” https://www.sbcgold.com/
[16] Gold Avenue - “Gold Price Performance in 2025” https://www.goldavenue.com/
Insights are generated using AI models and historical data for informational purposes only. They do not constitute investment advice or recommendations. Past performance is not indicative of future results.
About us: Ginlix AI is the AI Investment Copilot powered by real data, bridging advanced AI with professional financial databases to provide verifiable, truth-based answers. Please use the chat box below to ask any financial question.