Investment Analysis of Resource Stocks and Defense Sector Amid Rising Geopolitical Risks
Unlock More Features
Login to access AI-powered analysis, deep research reports and more advanced features

About us: Ginlix AI is the AI Investment Copilot powered by real data, bridging advanced AI with professional financial databases to provide verifiable, truth-based answers. Please use the chat box below to ask any financial question.
Related Stocks
I have now collected sufficient data and information, and will provide you with a systematic and comprehensive analysis report.
Recently, U.S. President-elect Trump’s statement about “acquiring control of Greenland in some way” is profoundly reshaping the global geopolitical and investment landscape. Greenland has proven rare earth reserves of approximately 1.5 million tons, including critical minerals such as neodymium, praseodymium, dysprosium, and terbium, which are core components of smartphones, computers, batteries, and high-end defense equipment [1]. However, experts point out that rare earth resource development in this region faces severe challenges: harsh climate, lack of infrastructure, and doubts about mining economics mean that large-scale commercial mining may take decades [2]. Fortune magazine analyzed that, “The obsession with Greenland is more of a geopolitical gesture — a military strategic interest and a stock promotion narrative — rather than a realistic supply solution for the technology industry” [3].
The Greenland Island incident poses an unprecedented challenge to the internal unity of NATO. Analyst Rahman pointed out, “Greenland is a greater threat to NATO cohesion than Russia’s invasion of Ukraine.” Russia is a recognized adversary of European countries, but if the most important NATO country responsible for European security attempts to annex the territory of another NATO member state, it will completely overturn Europe’s perception of the global order [1]. This risk premium is driving European countries to accelerate the process of defense autonomy, bringing structural growth momentum to the defense sector.
Catalyzed by multiple geopolitical shocks, the defense sector has become a core global investment theme at the start of 2026. Aneeka Gupta, Head of Macro Research at WisdomTree, pointed out that recent events are “a huge wake-up call”, indicating that key allies may not be overly relied upon, which means that the level and speed of rearmament need to be increased [4]. Meanwhile, Trump has called for increasing the U.S. defense budget by $500 billion to the $1.5 trillion level. Coupled with simultaneous increases in defense spending by European countries, this has formed a global military expenditure expansion cycle.
China occupies an absolutely dominant position in the global rare earth supply chain: it accounts for 70% of global rare earth mining volume, 90% of processing capacity, 92% of rare earth magnet production capacity, and approximately 69% of rare earth oxide output [5]. This highly concentrated pattern creates strategic vulnerabilities for Western countries in terms of critical mineral supply. In October 2025, China announced a one-year suspension of the implementation of new rare earth export control regulations, providing a one-year window for the US and other Western countries to build alternative supply chains [5].
| Segment | China’s Market Share | US/Allies’ Efforts |
|---|---|---|
| Rare Earth Mining | 70% | 12% |
| Rare Earth Processing | 90% | 8% |
| Rare Earth Magnet Capacity | 92% | 5% |
| Rare Earth Oxide Output | 69% | 10% |
The US is advancing rare earth industry autonomy through a multi-pronged strategy:
-
MP Materials (MP): As the only large-scale rare earth mine operator in North America, the Mountain Pass mine accounts for approximately 12%-15% of global rare earth concentrate output. The U.S. Department of Defense has invested $400 million to acquire a 15% stake, becoming the largest shareholder, and has committed to purchasing all rare earth permanent magnet materials over the next 10 years [6]. The company plans to start mass production at its “10X Factory” in 2028, with a target annual output of 1,000 tons of neodymium-iron-boron magnets — although this is only equivalent to 1% of China’s 2018 output [7].
-
Alliance Cooperation: The US has signed a memorandum of understanding with Saudi Arabia to develop a complete rare earth supply chain; jointly invested $1 billion with Australia in rare earth mining and processing projects; and reached a rare earth material purchase agreement with Canada, covering critical materials such as praseodymium-neodymium metal, dysprosium oxide, and terbium oxide [5].
-
Technological Innovation: General Motors and Stellantis have invested in Niron Magnetics to develop iron nitride magnet technology; the Department of Energy has funded research and development of bio-based rare earth recycling processes; Momentum Technologies has developed membrane solvent extraction technology to break through processing bottlenecks [7].
| Metric | Data |
|---|---|
| Market Capitalization | $10.99 billion |
| Current Stock Price | $62.00 |
| 1-Year Return | +217.46% |
| YTD Return | +12.79% |
| P/E Ratio | -91.75x (due to ongoing losses) |
| Current Ratio | 8.05 (sound financial position) |
| Analyst Consensus | Buy (90.9% of analysts recommend) |
| Average Target Price | $77.00 (+24.2% upside potential) |
MP Materials adopts a prudent financial attitude and conservative accounting treatment. The high depreciation/capital expenditure ratio indicates that the company is still in the capacity investment period; free cash flow is negative but constitutes strategic investment. The company has low debt risk, with a current ratio as high as 8.05x [8]. Recent quarterly results show that revenue exceeded expectations; in Q3 2025, EPS was -$0.10 (expected -$0.17), and revenue was $53.55 million (expected $53.24 million), with the loss margin continuing to narrow.
The defense sector showed strong upward momentum in early 2026:
| Region | Index/Basket | 2025 Return | January 2026 Return |
|---|---|---|---|
| Europe | Goldman Sachs Defense Stock Basket | +90% | +21% |
| US | Goldman Sachs Contractor Basket | +30% | +13% |
| South Korea | Defense Contractors | +300%+ | +30% |
| Japan | Defense Contractors | - | +15% |
After a record rally in 2025, European defense stocks continued their strong performance in 2026. Germany’s Rheinmetall AG rose approximately 22% in January 2026 after a 150% gain in 2025 [4]. South Korea’s Hanwha Aerospace Co.'s stock price rose nearly 30% this month after quadrupling in the previous year [4].
| Metric | Data |
|---|---|
| Market Capitalization | $252.35 billion |
| Current Stock Price | $188.50 |
| 1-Year Return | +60.10% |
| P/E Ratio | 38.32x |
| ROE | 10.61% |
| Net Profit Margin | 7.67% |
| Analyst Consensus | Buy (65.4% recommend) |
| Average Target Price | $197.00 (+4.5% upside) |
| Metric | Data |
|---|---|
| Market Capitalization | $127.06 billion |
| Current Stock Price | $542.92 |
| 1-Year Return | +12.37% |
| P/E Ratio | 29.98x |
| ROE | 68.48% (extremely high) |
| Net Profit Margin | 5.73% |
| Analyst Consensus | Buy (56.8% recommend) |
| Average Target Price | $546.50 (+0.7% upside) |
| Metric | Data |
|---|---|
| Market Capitalization | $84.24 billion |
| Current Stock Price | $112.15 |
| 1-Year Return | +93.83% |
| 3-Year Return | +175.62% |
| 5-Year Return | +318.00% |
| P/E Ratio | 31.45x |
| ROE | 17.61% |
| Analyst Consensus | Hold |
The valuation of rare earth companies needs to consider the following key factors:
- Production Growth Expectations: MP Materials plans to produce 1,000 tons of neodymium-iron-boron magnets by the end of 2025, and capacity expansion after the mass production of the “10X Factory” in 2028 is a key catalyst.
- Policy Dividends: The U.S. Department of Defense’s price floor policy (approximately $110/kg for neodymium and praseodymium) ensures profit margins and reduces the risk of cyclical fluctuations.
- Industry Chain Integration: The ability to vertically integrate from mines to magnet materials determines the ability to capture added value.
- Customer Structure: Long-term agreements with high-quality customers such as Apple, General Motors, and the Department of Defense provide revenue visibility.
| Scenario | Assumptions | Valuation Impact |
|---|---|---|
| Optimistic | Smooth capacity expansion, rising rare earth prices, sustained government subsidies | Target price $82+ |
| Neutral | Progress as planned, China’s rare earth policy remains unchanged | Target price $77 |
| Pessimistic | Capacity delays, cost overruns, increased exports from China | Target price below $71 |
Core Drivers of Defense Company Valuation:
- Defense Budget Trends: If Trump’s proposed $1.5 trillion budget is passed, it will significantly boost long-term revenue expectations.
- Order Backlog: Existing order backlogs of companies such as RTX and Lockheed Martin provide revenue certainty.
- Geopolitical Premium: The acceleration of European defense autonomy brings structural opportunities for European defense contractors.
- Profit Margin Improvement Potential: Economies of scale and technological upgrades may drive profit margins upward.
| Company | P/E | P/B | EV/OCF | ROE | Rating |
|---|---|---|---|---|---|
| RTX | 38.32x | 3.92x | 36.05x | 10.61% | Buy |
| LMT | 29.98x | 20.37x | 22.92x | 68.48% | Buy |
| BAE Systems | 31.45x | 5.74x | 22.27x | 17.61% | Hold |
Based on geopolitical risk assessment, we have constructed the following investment strategy matrix:
| Strategy Type | Target Recommendations | Expected Return | Risk Level | Investment Horizon |
|---|---|---|---|---|
Core Allocation |
MP Materials (MP), RTX, Lockheed Martin (LMT) | 15-25% | Medium | 6-12 Months |
Satellite Allocation |
REMX ETF, BAE Systems, Rheinmetall | 20-30% | Medium-High | 3-9 Months |
Long-Term Value |
Energy Fuels (UUUU), Lynas Rare Earths | 40%+ | High | 18-36 Months |
Defensive Allocation |
Defense ETFs, Low-Volatility Defense Stock Portfolio | 10-15% | Medium-Low | 3-6 Months |
- Core strategic target for the revival of the US rare earth industry, benefiting from policy support and Department of Defense endorsement
- 90.9% of analysts recommend a Buy rating, with the $77 target price representing 24% upside potential from the current price
- Multiple institutions have upgraded their ratings recently (Morgan Stanley, JP Morgan, Deutsche Bank, etc.)
- Current ratio of 8.05x, sound financial position, strong ability to withstand market volatility
REMX has total assets of $2 billion, with its top 10 holdings including Albemarle (8.17%), China Northern Rare Earth (7.35%), MP Materials (6.33%), Lynas (6.32%), etc. [10]. The fund has risen by more than 113% over the past year, but its portfolio is highly concentrated (only about 20 stocks), resulting in high volatility [10].
Given the US proposal to restrict share buybacks and dividends of defense stocks, Mediobanca analysts believe that European peers are more attractive [4]. Key focuses include:
- Rheinmetall (Germany): Core beneficiary of European defense spending, rose 22% in January 2026 after a 150% gain in 2025
- BAE Systems (UK): Has the highest exposure to the U.S. budget, benefiting from European defense autonomy
- Saab AB (Sweden), Kongsberg Gruppen ASA (Norway): Geographically close to Greenland, with rising regional security demand
- RTX (Raytheon Technologies): Diversified business (engines + aerospace + intelligence), Q3 results exceeded expectations, healthy cash flow
- Lockheed Martin: Extremely high ROE (68.48%), solid Q3 performance, growth potential in space business
- Policy Risk: Progress of U.S. defense budget negotiations, NATO expenditure commitments, changes in China’s rare earth export policies
- Valuation Risk: The defense sector is already at a historical high; need to be vigilant against pullbacks after expectations are realized
- Execution Risk: Rare earth capacity expansion may be delayed, and costs may exceed budgets
- Geopolitical Risk Mitigation: If there is a major de-escalation in the Russia-Ukraine conflict or Sino-US relations, it may weaken the sector’s upward momentum
- Maintain a moderate position to avoid over-concentration in a single sector
- Set stop-loss levels to guard against intensified short-term volatility
- Focus on earnings verification during earnings season, and select targets that exceed expectations
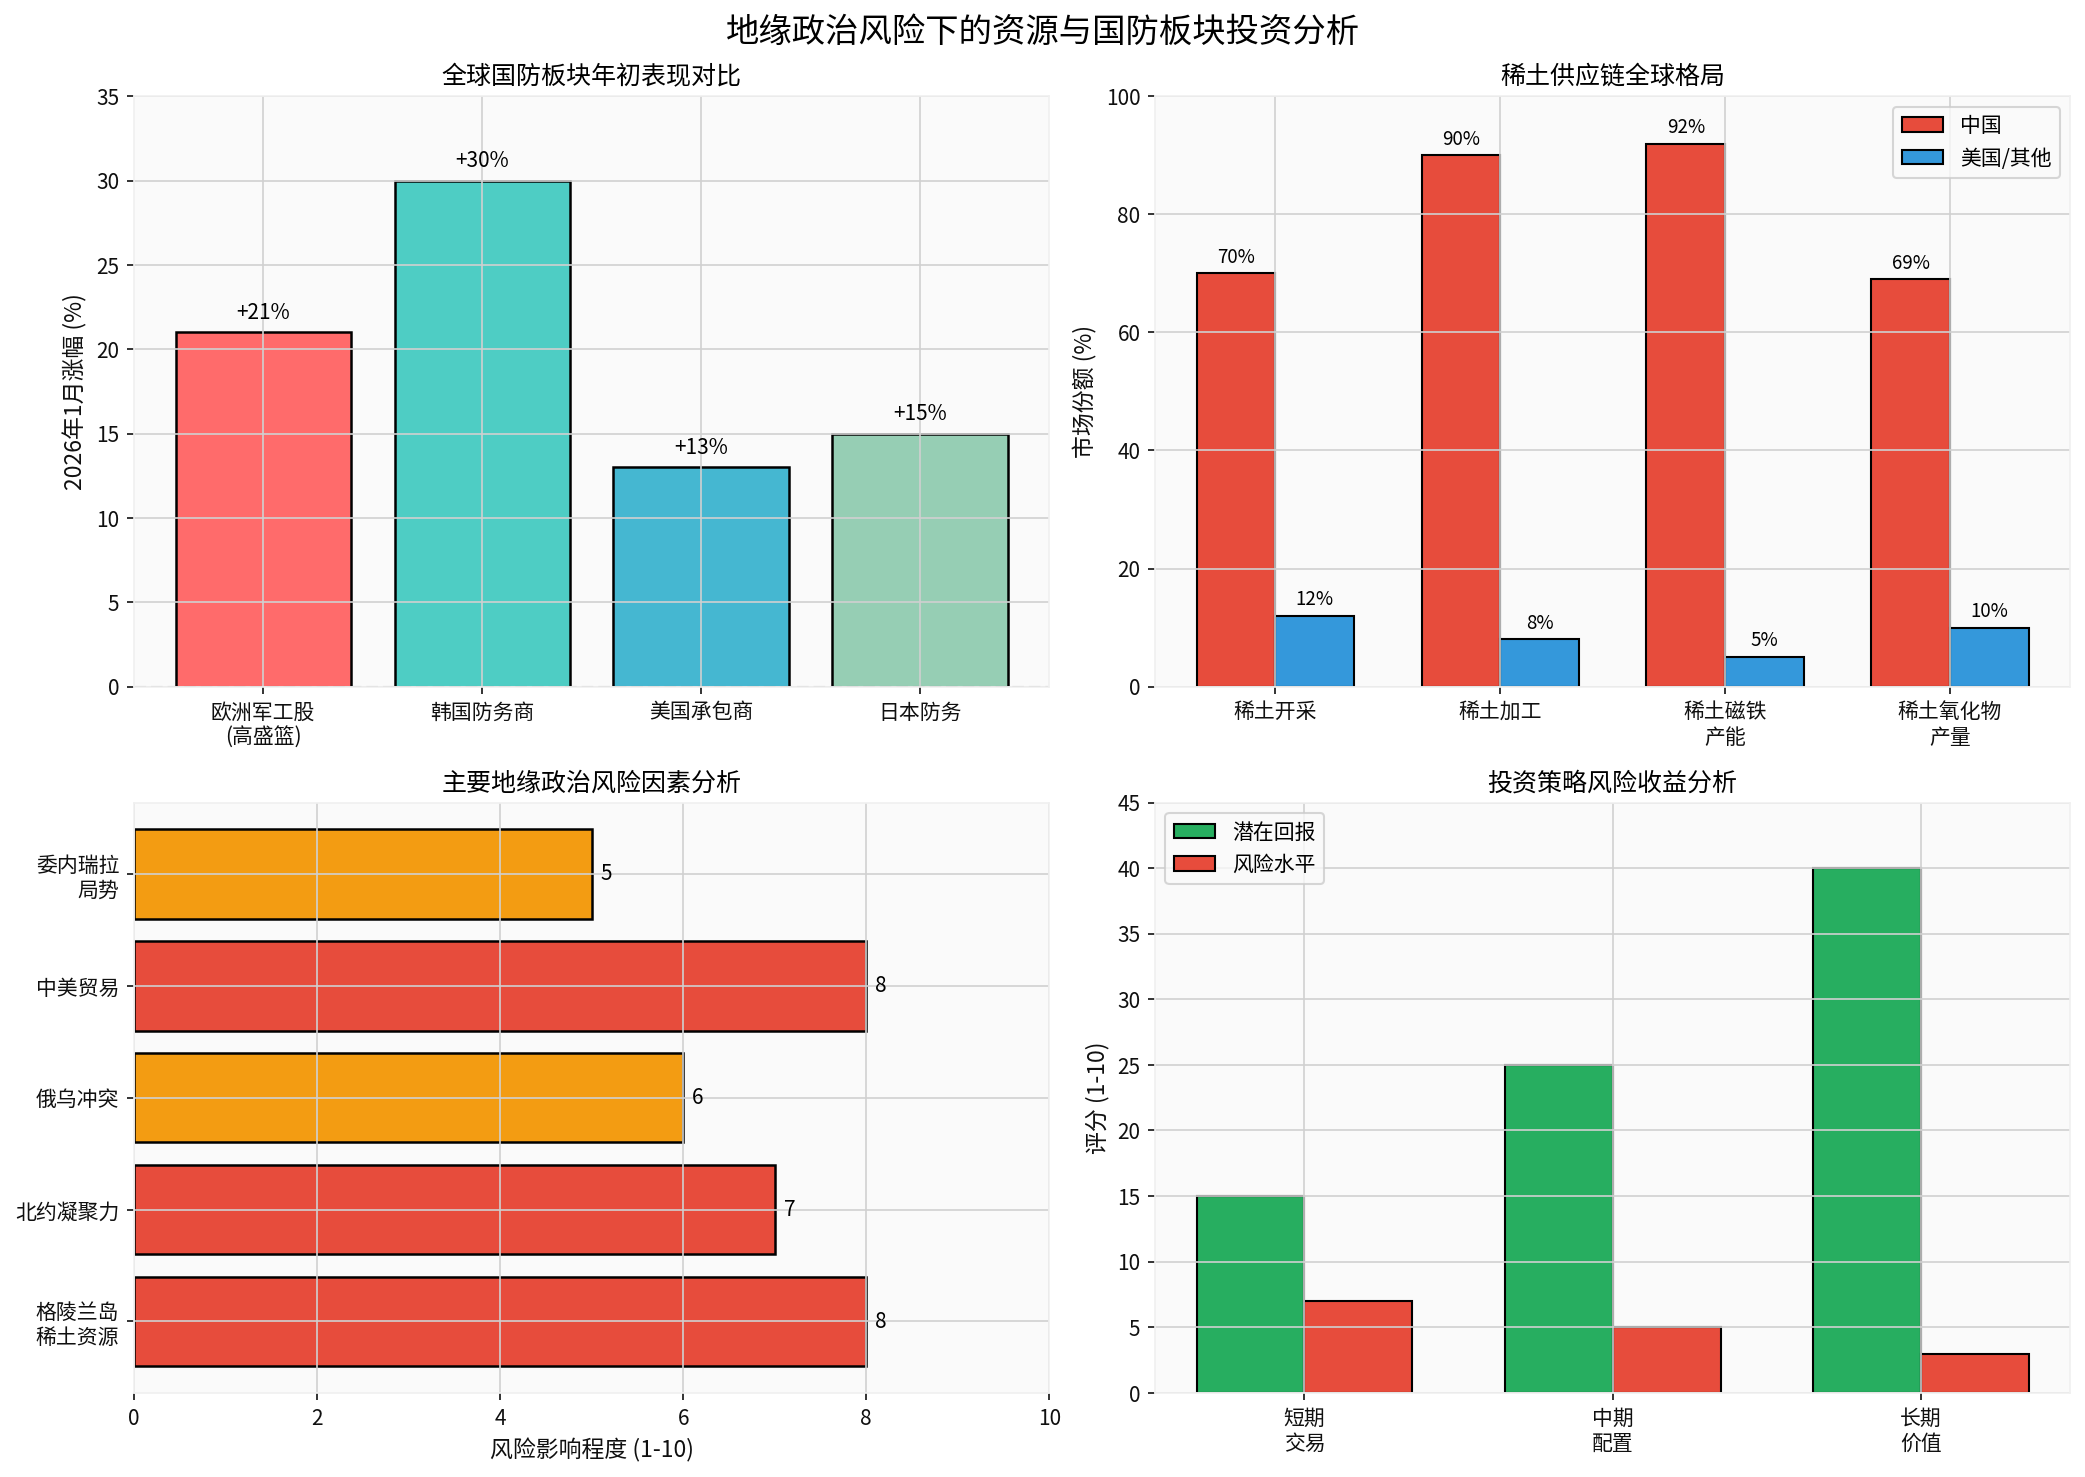
The chart systematically shows investment opportunities against the backdrop of geopolitical risks:
- Top Left: Comparison of Early-Year Performance of Global Defense Sectors— European defense stocks (Goldman Sachs basket) led with a 21% gain in January, while South Korean defense contractors rose 30%, indicating continuous capital inflow into the defense sector.
- Top Right: Global Landscape of Rare Earth Supply Chain— China dominates in mining (70%), processing (90%), magnet capacity (92%), and oxide output (69%), while the US and its allies are accelerating their catch-up efforts.
- Bottom Left: Analysis of Major Geopolitical Risk Factors— The impact of risk factors such as Greenland’s rare earth resources, Sino-US trade frictions, and NATO cohesion are all rated 7-8 out of 10.
- Bottom Right: Risk-Return Analysis of Investment Strategies— Short-term trading has potential return of 15% and risk rating of 7; medium-term allocation has potential return of 25% and risk rating of 5; long-term value investment has potential return of 40% and risk rating of 3.
- Geopolitical Risks Are Reshaping the Global Investment Landscape: The Greenland Island incident, the ongoing Russia-Ukraine conflict, and the intensifying Sino-US game are driving defense spending into a global expansion cycle, with resource supply chain security becoming a national strategic priority.
- Restructuring of Rare Earth Supply Chain Brings Structural Opportunities: China’s dominant position is hard to undermine in the short term, but the US and its allies are accelerating supply chain diversification through policy support, technological innovation, and alliance cooperation. MP Materials, as a core target for the revival of the US rare earth industry, has long-term strategic allocation value.
- The Defense Sector Is Expected to Maintain Strong Performance: The Goldman Sachs European Defense Stock Basket rose 21% in January 2026 after a 90% gain in 2025, indicating continuous capital inflow. European defense stocks, benefiting from concerns over NATO cohesion and demands for autonomy, may be more attractive than their US counterparts.
- Valuations Require Prudent Assessment: The defense sector is already at a historical high, and rare earth companies’ profitability still depends on capacity release. Investments need to focus on earnings verification and policy catalysts.
| Sector | Investment Rating | Core Rationale | Risk Warning |
|---|---|---|---|
| Rare Earth Upstream | Overweight |
Policy support, supply chain restructuring, demand growth | Capacity release falls short of expectations, overvaluation |
Insights are generated using AI models and historical data for informational purposes only. They do not constitute investment advice or recommendations. Past performance is not indicative of future results.
About us: Ginlix AI is the AI Investment Copilot powered by real data, bridging advanced AI with professional financial databases to provide verifiable, truth-based answers. Please use the chat box below to ask any financial question.