S&P 500 Q1 2025 Upside Potential Analysis
Unlock More Features
Login to access AI-powered analysis, deep research reports and more advanced features

About us: Ginlix AI is the AI Investment Copilot powered by real data, bridging advanced AI with professional financial databases to provide verifiable, truth-based answers. Please use the chat box below to ask any financial question.
The S&P 500 index has demonstrated remarkable resilience in 2025, delivering its third consecutive year of double-digit gains. As of January 12, 2026, the index trades at
| Moving Average | Current Value | Signal | Price Position |
|---|---|---|---|
| MA 20 | 6,878.19 | Bullish | Price above MA |
| MA 50 | 6,819.94 | Bullish | Price above MA |
| MA 200 | N/A* | Bullish | Price above MA |
Note: MA200 data incomplete due to lookback period
The
- Currently positioned in the neutral-to-overbought territory(below 70 threshold)
- Indicates strong but not extreme momentum
- No immediate divergence signals detected [0][2]
- MACD Line: 38.42
- Signal Line: 32.23
- Histogram: Positive (6.19)
- Signal: BULLISH— MACD trading above signal line with expanding histogram confirms strong upward momentum [0][2]
| Band | Price Level |
|---|---|
| Upper Band | 7,012.00 |
| Middle (MA20) | 6,878.19 |
| Lower Band | 6,744.39 |
The index is trading in the
┌─────────────────────────────────────────────────────────────┐
│                    S&P 500 PRICE MATRIX                      │
├─────────────────────────────────────────────────────────────┤
│  RESISTANCE LEVELS:                                         │
│    R1 (Psychological):  7,000.00  ████████████████████████  │
│    R2:                  7,062.18                            │
│    R3 (All-time High):  6,986.33                            │
├─────────────────────────────────────────────────────────────┤
│  CURRENT PRICE:         6,977.26                             │
├─────────────────────────────────────────────────────────────┤
│  SUPPORT LEVELS:                                            │
│    S1:                   6,720.43                            │
│    S2 (61.8% Fib):       6,863.55                            │
│    S3 (50% Fib):         6,825.62                            │
│    S4 (38.2% Fib):       6,787.70                            │
└─────────────────────────────────────────────────────────────┘
The technology sector has been the primary catalyst for S&P 500 gains, with
- AI Capital Spending Surge: Unanticipated acceleration in AI infrastructure investments has provided unexpected economic tailwinds [3]
- Cloud Computing Expansion: Enterprise cloud adoption continues to accelerate across sectors
- Productivity Gains: Similar to the late 1990s, AI adoption is driving productivity improvements that support earnings growth [4]
The Federal Reserve has implemented
- Lower Borrowing Costs: Enhanced corporate profitability through reduced debt servicing costs
- Valuation Support: Lower discount rates enhance present value of future earnings
- Consumer Spending: Improved disposable income supports consumption
S&P 500 earnings projections remain robust:
| Period | Earnings Growth | Source |
|---|---|---|
| 2025 (Full Year) | +13% | LSEG [4] |
| 2026 (Projected) | +15%+ | Analyst Consensus [4] |
The passage of the
- M&A Activity Expected Surge: Following two years of 20%+ returns, M&A activity correlation (+68% from 1998-2024) suggests increased deal activity in 2025 [5]
- Industrial Production Strengthening: Corporate restocking cycles remain robust, with companies continuing to replenish inventories [5]
Central banks worldwide are in
| Sector | Daily Change | Status |
|---|---|---|
| Consumer Defensive | +1.88% | 🟢 Leading |
| Technology | +0.89% | 🟢 Strong |
| Financial Services | +0.67% | 🟢 Improving |
| Industrials | +0.57% | 🟢 Rising |
| Utilities | +0.45% | 🟢 Stable |
| Basic Materials | +0.28% | 🟢 Flat |
| Energy | +0.05% | 🟢 Neutral |
| Consumer Cyclical | +0.02% | 🟢 Flat |
| Communication Services | +0.02% | 🟢 Stable |
| Healthcare | -0.94% | 🔴 Underperforming |
| Real Estate | -1.53% | 🔴 Weakest |
| Indicator | Current Reading | Action Signal | Monitor For |
|---|---|---|---|
RSI (14) |
69.63 | Neutral → Overbought >70 | Potential short-term pullback if >70 |
MACD |
Above Signal Line | Bullish | Cross below signal line |
Price vs MA50 |
Above | Bullish | Sustained break below |
Volume |
Average ↑ | Confirms trend | Volume dry-up on advances |
Bollinger Band Position |
Upper half | Strong | Touch upper band with rejection |
- VIX Index: Monitor for spikes above 20 indicating increased tail risk
- Put/Call Ratio: Extreme readings (>1.5) may signal inflection points
- Advance/Decline Line: Breadth deterioration could signal warning
- New Highs/New Lows: Divergences between price and new highs
| Signal | Threshold | Implication |
|---|---|---|
| RSI > 70 for 3+ days | Overbought | Potential correction |
| MACD Death Cross | Signal line crossover | Trend change risk |
| Volume Decline on Up Days | <80% of average | Weak conviction |
| Support Break (MA50) | Close below | Trend in question |
- Entry Points: Monitor pullbacks to MA20 (6,878) or 50% Fibonacci level (6,826)
- Stop Losses: Place below 6,720 (S1 support) or MA50 break
- Take Profits: Target 7,000 psychological level, then 7,062
- Position Sizing: Maintain core exposure; add on significant pullbacks
- Diversification: Consider rotating toward sector breadth (Financials, Industrials)
- Risk Management: Use trailing stops or protective puts for portfolio protection
| Catalyst | Timing | Potential Impact |
|---|---|---|
| Q4 2025 Earnings | January-February | Positive if >13% growth |
| Fed Policy Statement | Ongoing | Rate cut expectations |
| AI Developments | Continuous | Sector leadership |
| Geopolitical Events | Uncertain | Volatility spike risk |
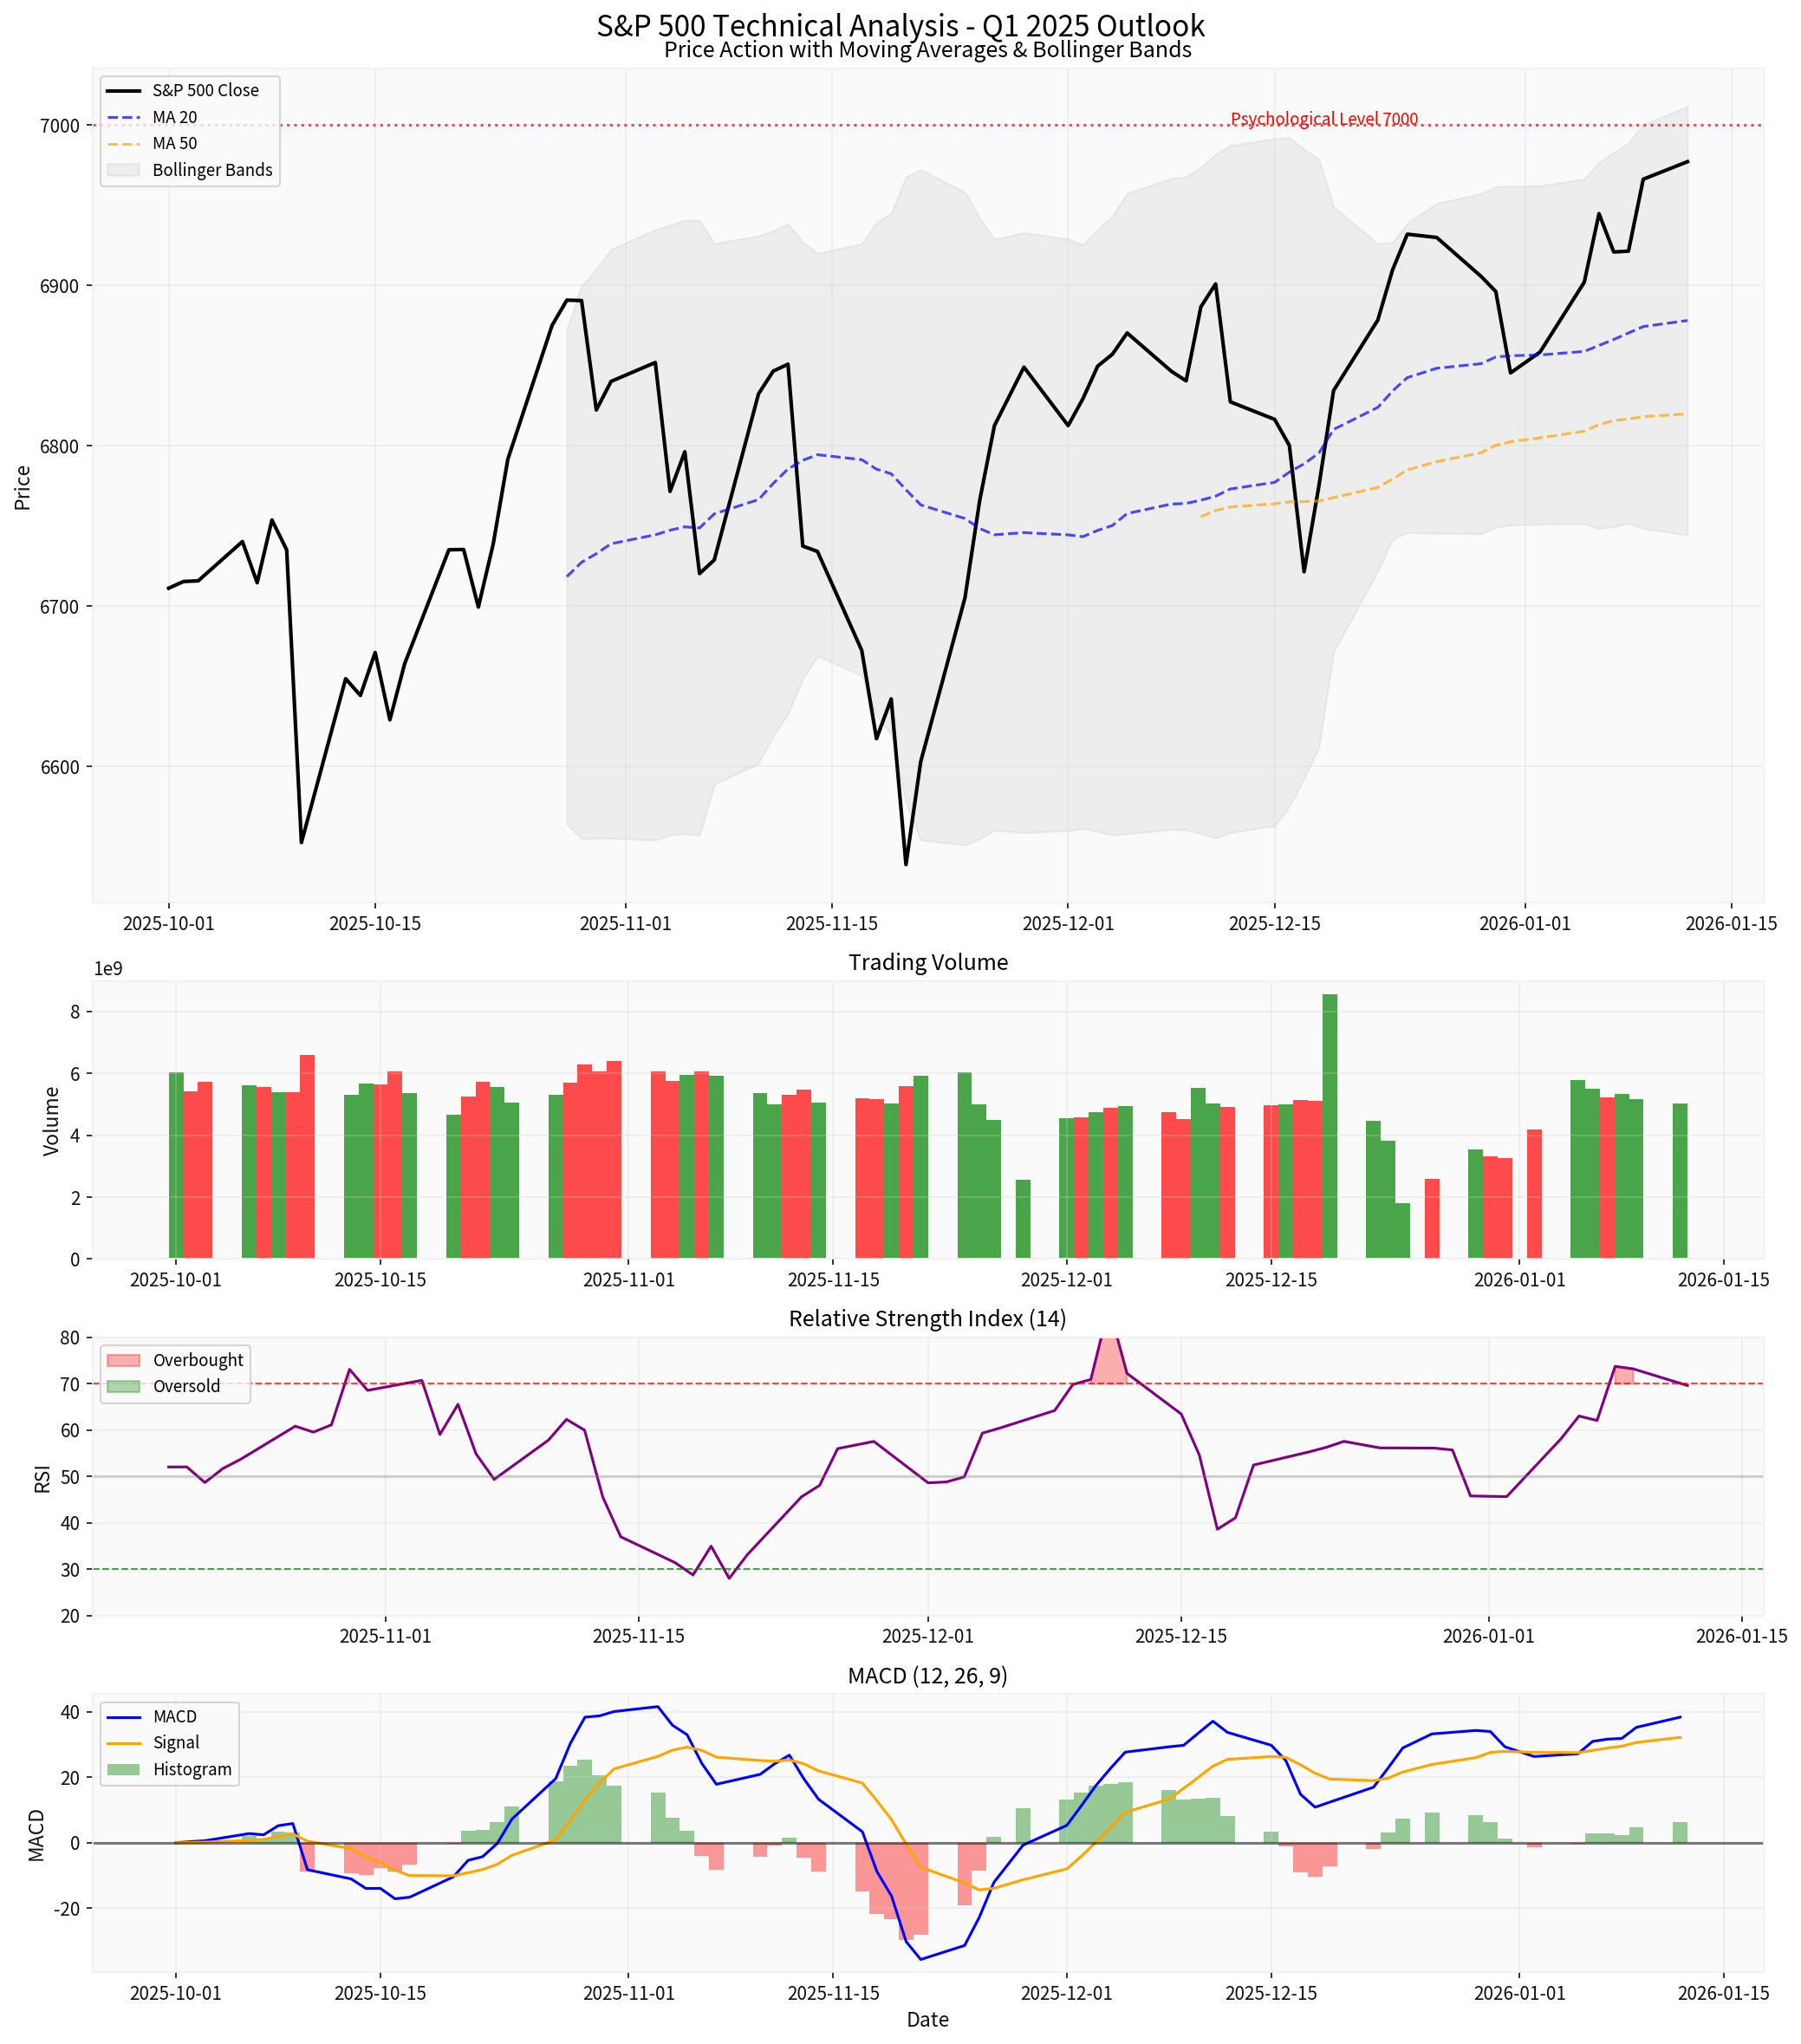
- Price action shows sustained uptrend with higher highs and higher lows
- MA20 and MA50 act as dynamic support levels
- RSI approaching overbought territory but not yet signaling reversal
- MACD histogram expansion confirms bullish momentum
| Target | Probability | Trigger |
|---|---|---|
| 7,000 | High | Sustained momentum, positive catalysts |
| 7,200 | Moderate | Strong earnings, Fed support |
| 7,400 | Lower | Broad earnings acceleration, AI breakthrough |
| Level | Trigger |
|---|---|
| 6,863 (61.8% Fib) | Normal correction |
| 6,720 (S1) | Moderate pullback |
| 6,500 | Technical breakdown |
The S&P 500 demonstrates a
✅
- Price above all key moving averages
- MACD in bullish configuration
- Strong sector breadth (7 of 11 sectors positive)
- Robust earnings growth expectations
⚠️
- RSI approaching overbought territory
- Proximity to psychological 7,000 level
- Potential for short-term consolidation
[0] Market Data - S&P 500 Index (2025-10-01 to 2026-01-13)
[1] Investing.com - S&P 500 Technical Analysis (https://www.investing.com/indices/us-spx-500-technical)
[2] SPDR S&P 500 ETF (SPY) Technical Analysis - SPDR S&P 500 ETF Trust
[3] RBC Wealth Management - U.S. equity returns in 2025: Record-breaking resilience (https://www.rbcwealthmanagement.com/en-us/insights/us-equity-returns-in-2025-record-breaking-resilience)
[4] Reuters - AI spending, strong corporate profits, Fed rate cuts seen as key to 2026 US stock market (https://www.reuters.com/business/ai-spending-strong-corporate-profits-fed-rate-cuts-seen-key-2026-stock-market-2025-12-24/)
[5] Neuberger Berman - Equity Market Outlook 1Q 2025 (https://www.nb.com/en/global/equity-market-outlook/equity-market-outlook-1q2025)
Insights are generated using AI models and historical data for informational purposes only. They do not constitute investment advice or recommendations. Past performance is not indicative of future results.
About us: Ginlix AI is the AI Investment Copilot powered by real data, bridging advanced AI with professional financial databases to provide verifiable, truth-based answers. Please use the chat box below to ask any financial question.