Investment Value Analysis of Citigroup's Cost-Cutting and Transformation Plan
Unlock More Features
Login to access AI-powered analysis, deep research reports and more advanced features

About us: Ginlix AI is the AI Investment Copilot powered by real data, bridging advanced AI with professional financial databases to provide verifiable, truth-based answers. Please use the chat box below to ask any financial question.
Related Stocks
Based on the in-depth analysis above, I now present to you a comprehensive investment value analysis report on Citigroup’s cost-cutting and transformation plan.
Citigroup Inc. (NYSE: C) has entered a critical validation phase for its ‘Project Bora Bora’ transformation plan led by CEO Jane Fraser. The company expects to cut approximately 1,000 jobs this week and plans to further reduce its workforce in 2026[1][2]. This strategic initiative has profound implications for the investment value of bank stocks, with the core consideration for current investment decisions being whether the efficiency gains driven by technology enablement can be successfully converted into shareholder returns.
Citigroup is implementing an ambitious workforce reduction plan. As of the end of September 2025, the company had approximately 227,000 employees[1], with a target to reduce the total workforce to around 180,000 by the end of 2026. This means cutting about 47,000 positions, accounting for
| Metric | Current Level | Target Level | Change Magnitude |
|---|---|---|---|
| Total Workforce | 227,000 | 180,000 | -20.7% |
| Management Layers | 13 | 8 | -38.5% |
| Internal Committees | 60+ | ~0 | Dissolved |
Technology enablement is one of the core pillars of Citigroup’s transformation plan. The company stated: “We will continue to reduce headcount in 2026. These adjustments reflect changes we are making to ensure staffing levels, locations, and expertise align with current business needs; efficiencies gained through technology; and progress on our transformation efforts, which are nearing their target state for Citi”[1].
Specific manifestations of technology enablement include:
- Process Automation:Reducing management layers allows business unit heads to report directly to the CEO, significantly shortening the decision-making chain
- Digital Transformation:Investing in core system upgrades and data analytics capabilities
- Risk Management Technology:Improving data governance and risk monitoring capabilities, which have been recognized by regulators
In December 2025, the
Citigroup’s Q3 2025 financial results (for the quarter ended September 30, 2025) exceeded market expectations[5]:
| Metric | Q3 2025 Actual | Market Consensus | Beat Margin |
|---|---|---|---|
| Earnings Per Share (EPS) | $2.24 | $1.73 | +29.48% |
| Revenue | $22.09B | $21.09B | +4.76% |
Full-year revenue is expected to reach
| Metric | Citigroup © | Peer Average | Difference |
|---|---|---|---|
| P/E | 14.42x | 14.53x | -0.7% |
P/B |
0.99x |
1.66x | -40.3% |
| ROE | 6.94% | 12.57% | -44.8% |
| Dividend Yield | 3.2% | 2.5% | +28.0% |
Jane Fraser has positioned 2026 as the “validation phase”, with the core target of achieving a
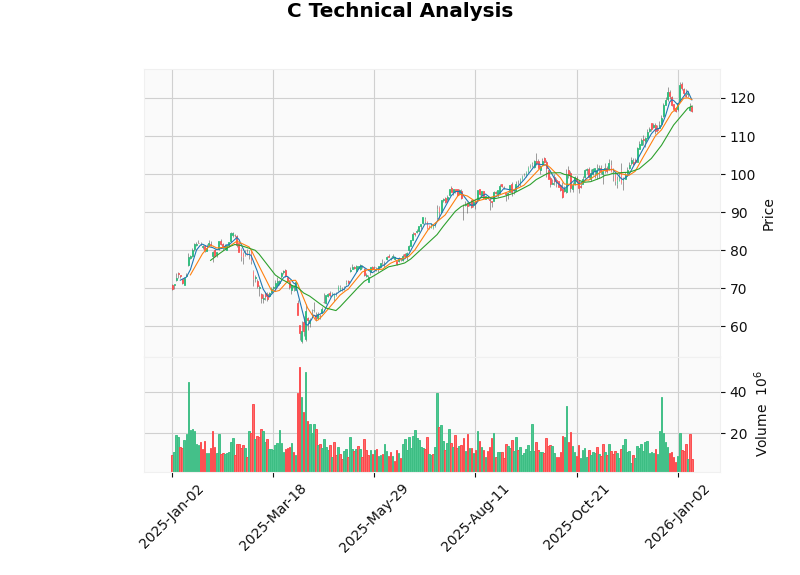
Citigroup’s share price showed strong upward momentum in 2025:
- Current Price:$116.50
- 20-Day Moving Average:$117.84 (Share price is slightly below the short-term moving average)
- 50-Day Moving Average:$109.04 (Share price is above the medium-term moving average)
- 200-Day Moving Average:$91.52 (Share price is significantly above the long-term moving average)
- 52-Week Gain:Approximately 66%
- YTD Performance:-1.94% (Affected by recent pullback)
| Metric | Value | Signal |
|---|---|---|
| MACD | No Crossover | Neutral-Bearish |
| KDJ | K:33.5, D:51.8, J:-2.9 | Bearish |
| RSI (14) | Normal Range | Neutral |
| Beta | 1.17 | Slightly higher volatility than the market |
| 20-Day Annualized Volatility | 26.8% | High |
The conversion of technology-enabled efficiency gains into shareholder returns primarily occurs through the following three paths:
- Direct labor cost savings
- Indirect cost savings from improved operational efficiency
- Streamlined management layers shorten decision-making cycles
- Exit non-core businesses (e.g., IPO of Banamex’s Mexican retail banking business)
- Redirect resources to high-return businesses
- Growth in wealth management business (20% growth rate in 2025)
- Lifting regulatory barriers reduces compliance costs
- Optimizing risk-weighted assets frees up capital
- Allows higher shareholder returns (share repurchases + dividends)
| Catalyst | Expected Timing | Potential Impact |
|---|---|---|
| Banamex IPO | 2026 | Frees up approximately 40,000 employees and releases capital |
| RoTCE reaches 11-12% | 2026 | Supports valuation re-rating to 1.2-1.4x P/B |
| Additional Share Repurchases | Ongoing | Boosts EPS and ROE |
| Full Lifting of Regulatory Restrictions | 2026-2027 | Eliminates the “regulatory discount” |
- Execution Risk:Large-scale layoffs may impact employee morale and service quality
- Macroeconomic Risk:Interest rate environment and credit cycle impact net interest income
- Competitive Risk:Competitors such as JPMorgan Chase are also advancing efficiency improvements
- Uncertainty in Technology Investment Returns:The actual results of digital transformation remain to be verified
| Dimension | Rating | Explanation |
|---|---|---|
Valuation Attractiveness |
★★★★☆ | P/B ratio is only 0.99x, representing a 40% discount |
Earnings Improvement Trend |
★★★★☆ | Q3 EPS beat expectations by 29%, full-year performance is strong |
Certainty of Technology Conversion |
★★★☆☆ | Transformation enters validation phase; sustainability needs to be monitored |
Dividend Return |
★★★★☆ | Dividend yield of 3.2%, higher than peer average |
Catalysts |
★★★★★ | Banamex IPO, lifting of regulatory restrictions, RoTCE target achievement |
- Upside Potential:If the RoTCE target is met and the Banamex IPO is completed, the valuation could re-rate to 1.3-1.4x P/B, corresponding to a share price of $150-$165
- Downside Risk:If the transformation encounters setbacks or the macroeconomy deteriorates, the share price could pull back to the $90-$100 range
- Buy Range:$105-$115 (Near current price)
- Hold Recommendation:For existing investors, it is recommended to hold until the completion of the Banamex IPO
- Stop-Loss Level:$100 (Provides approximately 14% downside protection)
Citigroup’s cost-cutting and technology enablement strategy has achieved initial results, with the roughly 60% share price increase in 2025 confirming the market’s recognition of the transformation direction. Technology-enabled efficiency gains are gradually being converted into improved financial performance through cost savings and business focus. The key validation point is whether the 11-12% RoTCE target can be achieved in 2026.
The current valuation level (especially the approximately 40% P/B discount) has not yet fully reflected the long-term value of the transformation. As regulatory barriers are gradually removed and profitability improves, Citigroup has the dual growth drivers of
[1] Yahoo Finance - “Citigroup to lay off 1000 employees as part of restructuring” (https://finance.yahoo.com/news/citigroup-lay-off-1-000-143107879.html)
[2] Straits Times - “Citi to cut about 1000 jobs this week as CEO trims costs” (https://www.straitstimes.com/business/banking/citi-to-cut-about-1000-jobs-this-week-as-ceo-trims-costs)
[3] TradingView - “Major layoffs extend into 2026 as Citi, Meta, and BlackRock cut jobs” (https://www.tradingview.com/news/invezz:07adb7e92094b:0-major-layoffs-extend-into-2026-as-citi-meta-and-blackrock-cut-jobs/)
[4] Fortune - “The 7 most overlooked CEOs in 2025—and the 5 to watch in 2026” (https://fortune.com/2026/01/07/top-ceos-to-watch-2026-starbucks-target-nike-boeing-citi-lauren/)
[5] Jinling API Market Data
[6] Jinling API Technical Analysis Data
Insights are generated using AI models and historical data for informational purposes only. They do not constitute investment advice or recommendations. Past performance is not indicative of future results.
About us: Ginlix AI is the AI Investment Copilot powered by real data, bridging advanced AI with professional financial databases to provide verifiable, truth-based answers. Please use the chat box below to ask any financial question.