Analysis Report on the Sustainability of Netflix's Countertrend Rally
Unlock More Features
Login to access AI-powered analysis, deep research reports and more advanced features

About us: Ginlix AI is the AI Investment Copilot powered by real data, bridging advanced AI with professional financial databases to provide verifiable, truth-based answers. Please use the chat box below to ask any financial question.
Related Stocks
Based on real-time data, Netflix (NFLX) currently trades at
From a longer-term perspective, Netflix has fallen
| Scenario | Intrinsic Value | Deviation from Current Price |
|---|---|---|
| Bear Case | $49.91 | -43.5% |
| Base Case | $57.80 | -34.5% |
| Bull Case | $77.14 | -12.6% |
Probability-Weighted Valuation |
$61.62 |
-30.2% |
This means that based on the DCF model, Netflix’s current stock price may have
- High Beta Coefficient (1.71): Leading to a weighted average cost of capital (WACC) as high as 15.9% [0]
- High Implied Expectations Reflected in Current Price: Investors need to expect sustained above-expectation growth from the company to support the current price
Despite the overvaluation risk, Netflix’s fundamentals remain solid [0]:
- Return on Equity (ROE): 41.86%—— Top-tier among tech stocks
- Net Profit Margin: 24.05%
- Operating Profit Margin: 29.14%
- Gross margin and cash flow continue to improve
- Current Ratio: 1.33
- Quick Ratio: 1.33
- The company has maintained a net cash position for a long time
- Consensus Rating: Buy(61.5% of analysts recommend Buy)
- Median Target Price: $134.50(implying 52.3% upside potential)
- Target Price Range: $100.00 - $152.00 [0]
-
Q4 2025 Earnings Report (January 20, 2026):
- Market Expected EPS: $0.55 (29.4% YoY growth)
- Expected Revenue: $11.97 billion (16.8% YoY growth)
- Key focuses include the effectiveness of password sharing crackdowns and holiday promotion activities [1][2]
-
Ad Business Growth:
- Ad-tier subscribers have reached 190 million, becoming a key growth driver [2]
- Q4 ad revenue is expected to reach $1.08 billion [1]
- Ad-tier subscribers have reached
-
Rumored Acquisition of Warner Bros. Discovery:
- Potential acquisition price of approximately $83 billion, which would transform Netflix into a comprehensive media group [2]
- However, the acquisition would require taking on approximately $50 billion in new debt, which could alter the capital structure
- High Volatility from High Beta: Stock price volatility is 1.71 times that of the broader market
- Slowing Revenue Growth: Growth in the U.S. and Canada regions has dropped to single digits (penetration rate exceeds 70%) [2]
- Increased Debt Burden: Financial leverage will rise significantly if a large-scale acquisition is completed
- Intensified Competition: Competitors such as Disney+ and HBO Max continue to ramp up efforts
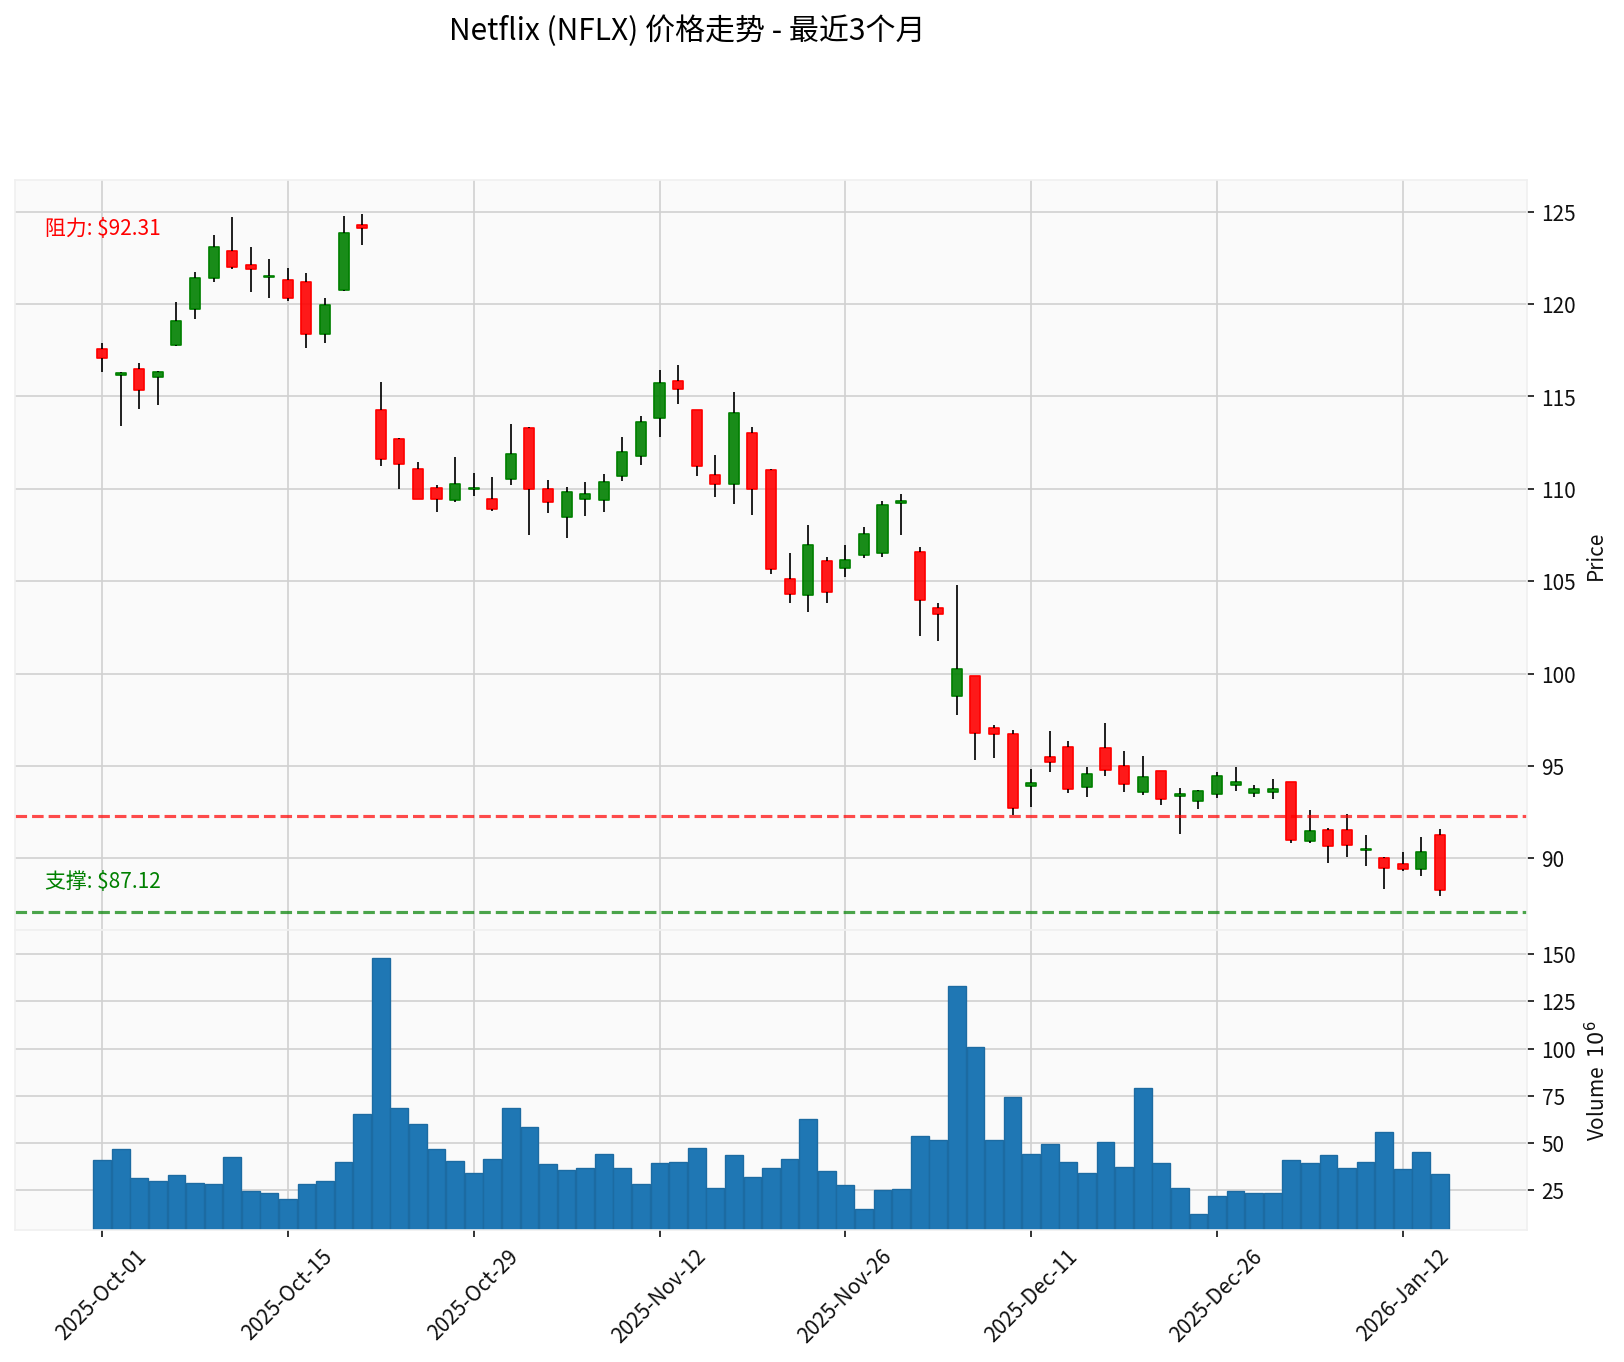
Based on technical indicator analysis [0]:
- KDJ Indicator: K value 17.6, D value 20.8 —— In the oversold zone
- RSI Indicator: Also shows an oversold signal
- MACD Indicator: No crossover signal, but the trend is bullish-leaning
- Beta Coefficient: 1.71 (high volatility)
The current stock price is approaching the key support level of $87.12. If it holds this level, a technical rebound may occur. However, if it breaks below this level, it may further test the 52-week low of $82.11.
Based on the above analysis, my judgments are as follows:
-
Short-Term (1-2 Weeks): Netflix’s countertrend performanceis unsustainable. The DCF valuation model indicates a 30% overvaluation risk for the current stock price, and while technicals show oversold conditions, there is no clear catalyst for upward momentum.
-
Mid-Term (1-3 Months): Depends on Q4 earnings performance. If earnings exceed expectations (especially ad revenue and user growth), combined with potential progress on the WBD acquisition, the stock price may retest levels above $100. If earnings meet or fall short of expectations, the stock price may further decline to the $80-85 range.
-
Long-Term (6-12 Months): If Netflix’s transformation strategy (ad business, live sports, potential mergers and acquisitions) is successfully implemented, fundamental improvements may gradually absorb the current high valuation. However, given the high valuation and uncertainties surrounding the WBD acquisition, investors are advised to remain cautious.
- For risk-tolerant investors: Consider gradually building positions in the $80-85 range, with a target price range of $110-120
- For risk-averse investors: It is recommended to wait for the Q4 earnings report before making decisions, and monitor whether the $87.12 support level is broken
- Position Management: Given the high Beta characteristic, it is recommended to limit Netflix’s position to 10-15% of tech stock holdings
[0] Jinling API Data - Netflix real-time quotes, company profile, technical analysis, financial analysis, and DCF valuation
[1] IG Markets - “Netflix Q4 2025 results preview: what investors should watch” (https://www.ig.com/en-ch/news-and-trade-ideas/netflix-q4-earnings--can-the-streaming-giant-maintain-its-moment-260113)
[2] Financial Content - “Netflix (NFLX) 2026 Deep Dive: From Streaming King to Media Powerhouse” (https://markets.financialcontent.com/wral/article/finterra-2026-1-14-netflix-nflx-2026-deep-dive-from-streaming-king-to-media-powerhouse)
Insights are generated using AI models and historical data for informational purposes only. They do not constitute investment advice or recommendations. Past performance is not indicative of future results.
About us: Ginlix AI is the AI Investment Copilot powered by real data, bridging advanced AI with professional financial databases to provide verifiable, truth-based answers. Please use the chat box below to ask any financial question.