In-Depth Analysis of the Impact of TSMC's 77% Advanced Process Revenue Share on the Global Foundry Competitive Landscape and Company Valuation
Unlock More Features
Login to access AI-powered analysis, deep research reports and more advanced features

About us: Ginlix AI is the AI Investment Copilot powered by real data, bridging advanced AI with professional financial databases to provide verifiable, truth-based answers. Please use the chat box below to ask any financial question.
Related Stocks
Based on the comprehensive data collected, I will provide you with a systematic and in-depth analysis report.
TSMC recorded a net profit of approximately NT$505.7 billion in Q4 2025, representing a 35% year-over-year increase, which exceeded market expectations [0][1]. On a full-year basis, the company maintained strong revenue growth momentum, with year-over-year revenue growth staying above 30% across all quarters of 2025 [0].
- Current Stock Price: $327.11, Market Cap: $1.70 Trillion
- Price-to-Earnings (P/E) Ratio: 27.70x, significantly lower than NVIDIA’s 58.3x and AMD’s 42.5x [0][4]
- Return on Equity (ROE): 34.52%, demonstrating exceptional capital efficiency
- Net Profit Margin: 43.70%, far exceeding the industry average
- Gross Margin: approximately 54%, an absolute leader in the foundry industry [4]
In Q4 2025, TSMC’s advanced process (7nm and more advanced) revenue accounted for 77% of total revenue, a 10-percentage-point increase from 67% in 2024 and a substantial 19-percentage-point jump from 58% in 2023 [2]. This structural change is a milestone:
| Process Node | Revenue Share | Market Position |
|---|---|---|
| 5nm | 35% | Dominant position, over 90% market share |
| 3nm | 28% | 100% market share, record-setting mass production speed |
| 7nm | 14% | Stable market position |
| Mature processes (≥16nm) | 23% | Gradually contracting |
The global foundry industry presents a clear “one dominant, multiple strong” competitive landscape, and TSMC’s leading position is continuously consolidated through its advanced process advantages [2][5]:
| Company | Market Share | Revenue Contribution |
|---|---|---|
| TSMC | 60% | 72% of global revenue |
| Samsung Electronics | 10% | 6.8% |
| SMIC | 6% | 4.8% |
| UMC | 7% | - |
| GlobalFoundries | 5% | - |
According to TrendForce data, excluding TSMC, the total global foundry revenue will only grow by 7.7% in 2026, while TSMC alone contributes an additional 11.3% growth [2]. This fully demonstrates that TSMC has become the core engine of global semiconductor industry growth.
TSMC has established a 2-3 year technological lead in advanced processes, and this advantage is validated by the following data:
| Process | TSMC Yield | Samsung Yield | Gap |
|---|---|---|---|
| 3nm | >80% | ~30% | 50 percentage points |
| 2nm | ~80% | <10% | 70 percentage points |
Samsung has faced yield issues since the 5nm process, with even worse performance in 4nm and 3nm processes. Due to relatively low yields, Qualcomm has shifted subsequent Snapdragon flagship processor orders from Samsung to TSMC [2]. As of Q4 2025, Samsung’s 3nm yield is only about 30%, while TSMC’s 3nm yield has exceeded 80%; Samsung’s 2nm yield is below 10%, while TSMC’s 2nm yield remains around 80% [2].
- Constrained by insufficient competitiveness in advanced processes, the utilization rate of 12-inch wafer capacity is only about 75%
- While focusing on memory chip business, its market penetration in AI advanced process chips lags behind TSMC
- Facing the risk of overcapacity, it is considering an alliance with Intel to catch up with TSMC [5]
- Transforming from CPU manufacturing to the AI field, but facing issues such as capacity delays and slow progress in small-node processes
- Its market share in the AI wafer market is far lower than TSMC’s
- The 18A process (1.8nm) is still in the process of ramping up mass production
- Benefiting from consumer inventory replenishment orders and localization trends, its market share rose to 6% in Q1 2025
- Has cost advantages in mature processes, but has a significant technological gap in advanced processes
- Faces challenges in technological upgrading due to US export controls
TSMC’s leading CoWoS advanced packaging technology has become a key link in AI chip manufacturing. According to TrendForce, global advanced packaging capacity surged 82% year-over-year in 2025 and will continue to grow by 27% in 2026 [2]:
- CoWoS profit margin has exceeded that of advanced processes, mainly due to lower production equipment costs
- The price of a single advanced packaged wafer has risen from approximately $5,000 three years ago to $10,000, and may increase to $17,000 in the future
- TSMC has clearly planned to set up a pilot line for CoPoS technology in 2026, with the goal of mass production from late 2028 to 2029
Although NVIDIA dominates with its high gross margins, the high cost is prompting cloud service giants such as Google, Microsoft, and AWS to develop their own ASIC chips [2]. These companies typically entrust IP design to Broadcom, MediaTek, etc., and then subcontract manufacturing to TSMC, forming a new software-hardware collaborative ecosystem that further strengthens TSMC’s strategic position as the “foundry for AI chips”.
DCF valuation analysis based on three scenarios shows that TSMC’s current stock price has significant valuation upside [0]:
| Scenario | Valuation Price | Upside vs Current Stock Price |
|---|---|---|
| Conservative Scenario | $1,814.44 | +454.7% |
| Base Scenario | $2,032.21 | +521.3% |
| Optimistic Scenario | $2,711.01 | +728.8% |
| Weighted Average | $2,185.89 | +568.2% |
- Conservative Scenario: Zero revenue growth, EBITDA margin of 65.9%, terminal growth rate of 2.0%
- Base Scenario: 21.2% revenue growth, EBITDA margin of 69.3%, terminal growth rate of 2.5% (based on 5-year historical average)
- Optimistic Scenario: 24.2% revenue growth, EBITDA margin of 72.8%, terminal growth rate of 3.0%
| Company | P/E | Notes |
|---|---|---|
| TSMC | 27.7x | Industry benchmark, reasonable valuation |
| NVIDIA | 58.3x | AI chip leader, valuation premium |
| AMD | 42.5x | Driven by both CPU and GPU |
| Samsung Electronics | 13.2x | Dragged down by memory business |
| Intel | Loss | Transformation pain period |
Although TSMC’s P/E ratio is higher than Samsung’s and Intel’s, considering its higher growth expectations, stronger profitability, and more stable market position, the current valuation level is reasonable. The consensus analyst target price is $357.50, representing a 9.3% upside from the current stock price [0].
According to TrendForce, the total capital expenditure of the top 10 global foundries will grow 13.3% year-over-year in 2026, mainly for capacity expansion of advanced processes [2]. TSMC’s global expansion plan includes:
- Taiwan, China:Continue to expand 3nm and 2nm capacity
- Arizona, U.S.:Construction of advanced process fab, capacity ramping up [1]
- Kumamoto, Japan:Mature process fab, already in production
- Dresden, Germany:First fab in Europe
TSMC’s capacity expansion strategy can not only meet the strong demand for AI chips but also enhance supply chain resilience amid geopolitical uncertainties, supporting long-term valuation.
Advanced process revenue share has increased from 58% in 2023 to 77% in 2025, and TSMC is rapidly capturing all incremental growth in the AI chip foundry market. The technological gap has widened from 2 years to 3 years, making it difficult for competitors to catch up in the short term.
The generative AI wave has just begun, and demand for advanced processes from AI chips will persist for many years. As the preferred foundry for major AI chip design companies such as NVIDIA, AMD, and Broadcom, TSMC will fully benefit from this structural trend.
TSMC’s supply bottleneck means that customers need to lock in capacity in advance, which not only ensures capacity utilization but also provides the company with pricing power. Advanced process wafer prices are expected to increase by approximately 5% annually, and the unit price of 3nm wafers may exceed $30,000 [2].
DCF valuation shows a potential upside of 4-7x for the current stock price, and even under conservative assumptions, the valuation shows a strong margin of safety.
Uncertainties in the Taiwan Strait situation may affect the company’s operations and valuation. Customers may shift some orders to Samsung or Intel due to supply chain security concerns.
Intel is accelerating its IDM 2.0 strategic transformation, and if the 18A process is successful, it may pose a threat to TSMC. The potential alliance between Samsung and Intel also deserves attention [5].
The bursting of the AI bubble may lead to a sharp decline in chip demand, affecting the company’s revenue and profit growth. A slowdown in global economic growth may weaken consumer electronics demand.
Large-scale capital expenditure may affect free cash flow and shareholder returns. The company needs to strike a balance between capacity expansion and shareholder returns.
- Support Level: $307.68
- Resistance Level: $331.37
- Trading Range Reference: $307.68 - $331.37
- MACD: No crossover signal, neutral-bullish
- KDJ: K=74.5, D=76.4, J=70.7, slightly overbought
- RSI: Normal range
- 52-Week Gain: +62.38%
- YTD Gain: +2.35%
- 6-Month Gain: +43.05%
-
Impact on Competitive Landscape:TSMC’s 77% advanced process revenue share further consolidates its position as the “global foundry leader”. With over 90% market share for processes below 7nm and 100% market share for 3nm, competitors cannot pose effective challenges in the AI chip and HPC chip fields in the short term.
-
Impact on Valuation:The combination of technological leadership and structural growth in AI demand provides a foundation for TSMC’s valuation premium. DCF valuation shows that the current stock price has significant long-term investment value, with a 4.5x upside even in the conservative scenario.
-
Impact on the Industry:TSMC’s strong position is reshaping the global semiconductor industry structure, with customers highly dependent on TSMC’s advanced process capacity, forming an industry phenomenon similar to a “TSMC premium”. This dependence is both a moat for the company and a potential chip in geopolitical games.
- The 2nm process is expected to enter mass production in the second half of 2025, further expanding technological leadership
- Demand for AI chips remains strong, with high utilization rates of advanced process capacity
- Capacity expansion of CoWoS advanced packaging will become a new profit growth driver
- Mass production of the A16 (1.6nm) process, intensifying technological competition in the angstrom era
- Global capacity layout is gradually improved, with capacity ramping completed for factories in the U.S., Japan, and Germany
- Advanced packaging technology continues to evolve, with commercialization of CoPoS technology
- Silicon photonics and new computing architectures may bring new growth opportunities
- Geopolitical risks and supply chain security will become important considerations
- TSMC is expected to maintain technological leadership, but disruptive technological challenges need to be monitored
[0] Jinling API Data - TSMC Real-Time Quotes, Company Profile, Financial Analysis, DCF Valuation
[1] Yahoo Finance - “The AI Boom Gets Its First Earnings Test of the Year. Watch TSMC Stock.” (https://finance.yahoo.com/m/ebe426ee-5fef-363e-b142-4d38f6abb07f/the-ai-boom-gets-its-first.html)
[2] ESM China/ESMC - “2026 Foundry Market Trend Interpretation: From Advanced Process Competition to Mature Capacity Transfer” (https://www.esmchina.com/news/13773.html)
[3] Sparkco - “TSMC AI GPU Wafer Revenue & Capacity Tracker 2025” (https://sparkco.ai/blog/tsmc-ai-gpu-wafer-revenue-capacity-tracker-2025)
[4] Dongxing Securities - Industry Research Report: “A New Era of Foundry Driven by AI”
[5] SemiWiki - “Samsung Electronics and Intel explore a foundry alliance” (https://semiwiki.com/forum/threads/samsung-electronics-and-intel-explore-a-foundry-alliance-joining-forces-on-everything-from-packaging-to-glass-substrates-to-catch-up-with-tsmc.23494/)
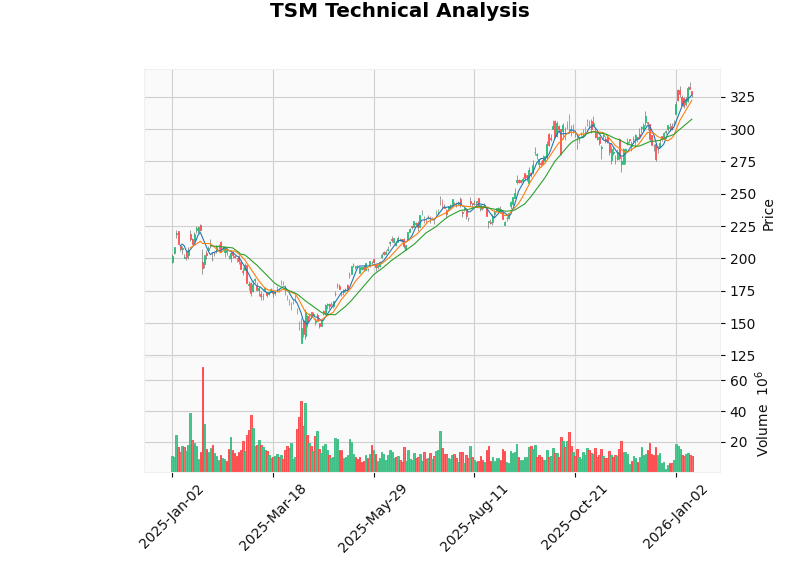
The chart above shows TSMC’s technical analysis trend, including key support level ($307.68) and resistance level ($331.37). The current stock price ($327.11) is in the upper-mid range of the interval.
Insights are generated using AI models and historical data for informational purposes only. They do not constitute investment advice or recommendations. Past performance is not indicative of future results.
About us: Ginlix AI is the AI Investment Copilot powered by real data, bridging advanced AI with professional financial databases to provide verifiable, truth-based answers. Please use the chat box below to ask any financial question.