Analysis of Inventory and Inventory Turnover of Buchang Pharmaceuticals (603858)
Unlock More Features
Login to access AI-powered analysis, deep research reports and more advanced features
About us: Ginlix AI is the AI Investment Copilot powered by real data, bridging advanced AI with professional financial databases to provide verifiable, truth-based answers. Please use the chat box below to ask any financial question.
Related Stocks
Based on the latest financial data and public information, I have conducted a comprehensive analysis of Buchang Pharmaceuticals’ inventory turnover. The detailed report is as follows:
According to Buchang Pharmaceuticals’ 2024 annual report [1] and 2025 semi-annual report [2] data:
| Time Point | Inventory Balance | YoY Change |
|---|---|---|
| End of 2023 | RMB 4.93 billion | — |
| End of 2024 | RMB 4.517 billion |
-8.38% |
| End of June 2025 | RMB 4.661 billion | +3.19% vs. beginning of the year |
| Fiscal Year | Inventory Turnover Ratio | Industry Comparison |
|---|---|---|
| 2020 | 2.52 times/year | Close to industry average |
| 2021 | 2.21 times/year | Below industry average |
| 2022 | 1.62 times/year | Significant decline |
| 2023 | 1.08 times/year | Seriously low |
2024 |
0.86 times/year |
Far below industry average (approx. 3.0 times/year) |
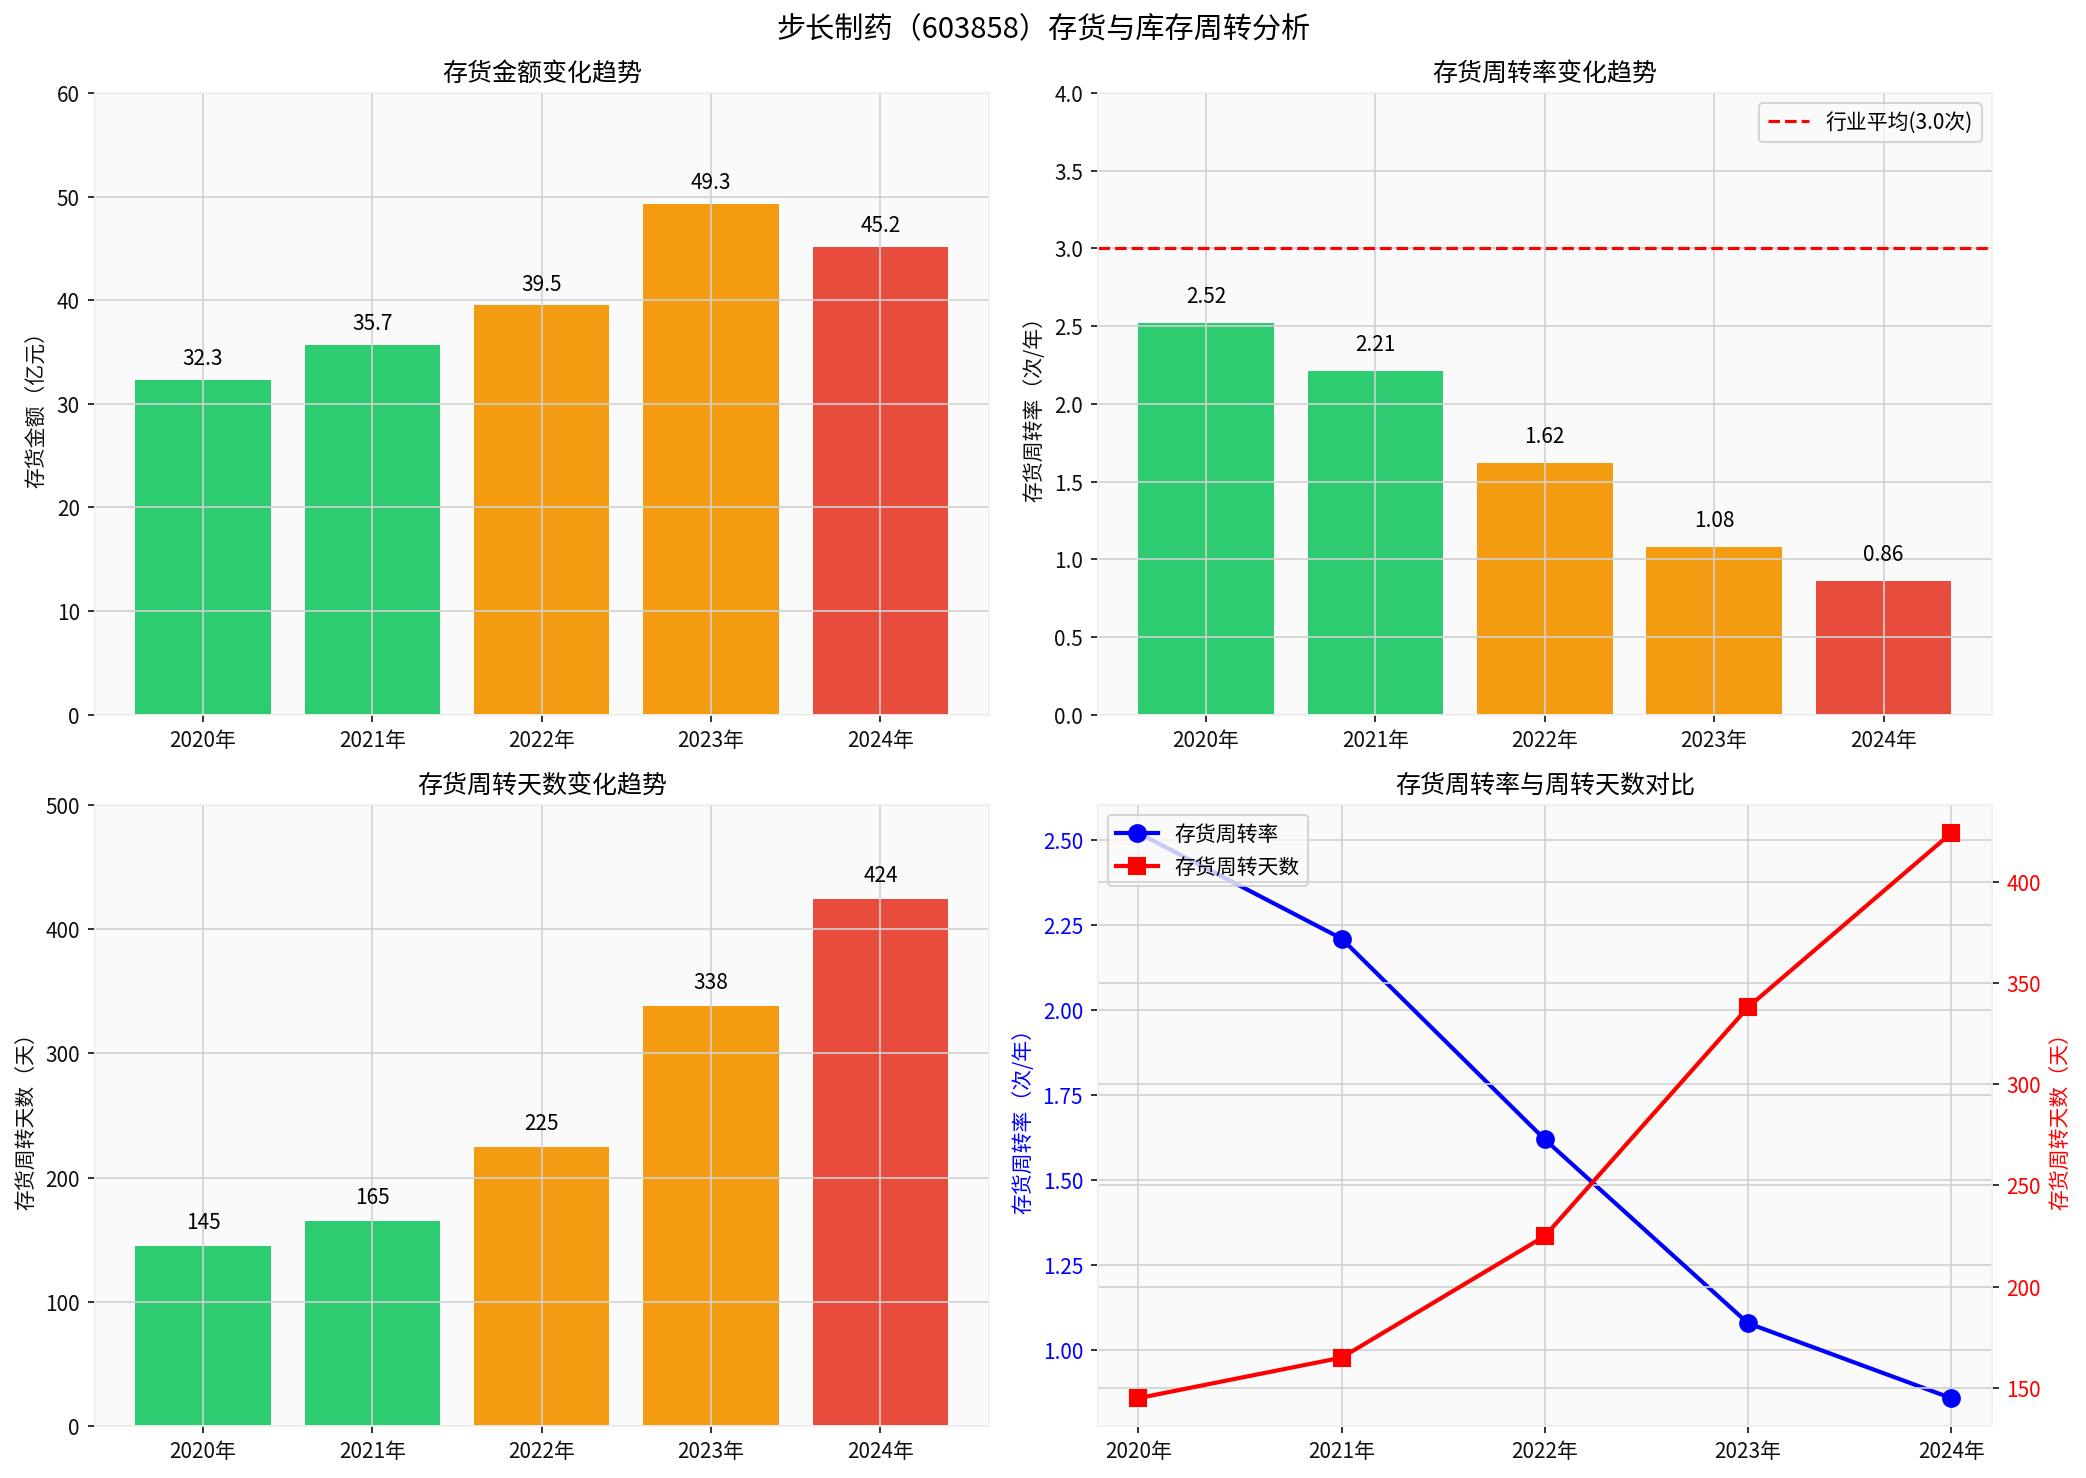
- The inventory turnover ratio has continued to decline from 2.52 times in 2020 to 0.86 times in 2024, representing a 65.9% decrease over five years[3]
- The 2024 inventory turnover ratio was only 0.86 times/year, a gap of 2.14 timescompared to the pharmaceutical industry average of 3.0 times/year
- This means Buchang Pharmaceuticals’ inventory turnover speed is only about 29% of the industry average
| Fiscal Year | Inventory Turnover Days | Notes |
|---|---|---|
| 2020 | 145 days | Approx. 4.8 months |
| 2021 | 165 days | Approx. 5.5 months |
| 2022 | 225 days | Approx. 7.5 months |
| 2023 | 338 days | Approx. 11.3 months |
2024 |
424 days |
Approx. 14.1 months |
- Inventory turnover days have surged from 145 days in 2020 to 424 days in 2024, an increase of 192.4%[3]
- Inventory turnover in 2024 took approximately 14 months, indicating that inventory is stored in warehouses for more than a year on average before being sold
- This reflects a serious insufficiency in the company’s inventory liquidity
According to the 2024 annual report, the inventory composition is as follows [1][2]:
| Inventory Category | Ending Balance | Proportion | Inventory Write-Down Reserve |
|---|---|---|---|
| Raw Materials | RMB 2.735 billion | 62.0% | RMB 2,418,784 |
| Finished Goods | RMB 1.598 billion | 36.2% | RMB 69,257,658 |
| Work in Progress | RMB 190 million | 0.4% | RMB 26.49 million |
| Packaging Materials | RMB 390 million | 0.9% | RMB 1.1596 million |
Total |
RMB 4.362 billion |
100% |
RMB 99.32 million |
- Raw materials account for the highest proportion (62%): Indicates that the company has stockpiled a large amount of raw materials such as Chinese herbal medicines, possibly in response to raw material price fluctuations or supply chain stability concerns
- Finished goods account for 36.2%: The problem of finished goods overstock is prominent
- Total inventory write-down reserve is approximately RMB 100 million: The company has accrued write-down reserves for some inventory
| Assessment Dimension | Indicator Performance | Rating |
|---|---|---|
| Inventory Turnover Ratio | 0.86 times/year (industry average 3.0 times) | ❌ Seriously Low |
| Inventory Turnover Days | 424 days (industry average approx. 120 days) | ❌ Seriously High |
| Inventory Amount Trend | First decline in 2024 | ⚠️ Initial Improvement |
| Inventory Write-Down Reserve | RMB 99.32 million | ⚠️ Impairment Risk Exists |
- Serious fund occupation: RMB 4.5 billion in inventory occupies a large amount of working capital
- Inventory write-down risk: Chinese herbal medicines and finished pharmaceuticals face risks of expiration or price reduction
- Low asset turnover efficiency: Impacts the company’s overall profitability
Based on public information, the main reasons for the slowdown in Buchang Pharmaceuticals’ inventory turnover include [1][2]:
-
Sustained revenue decline:
- 2024 operating revenue was RMB 11.006 billion, a year-on-year decrease of 16.91%
- The contraction of revenue scale has reduced the base for inventory turnover
-
Slowing sales of core products:
- Core products such as Danhong Injection and Naoxintong Capsule are facing market pressures
- The pharmaceutical sector’s revenue decreased by 17.04% year-on-year in 2024
-
Strategic reserve of raw materials:
- The company has made strategic reserves to cope with price fluctuations of Chinese herbal medicines
- Resulting in a high proportion of raw material inventory
- The first-ever decline in inventory balance in 2024 (-8.38%) indicates that the company has begun to take measures
- The net cash flow from operating activities turned positive to RMB 940 million in the first half of 2025 [1]
- The inventory turnover ratio is still declining, requiring further strengthening of inventory management
- Recovery of core product sales
- Impact of raw material price fluctuations on inventory value
[1] 2024 Annual Report Summary of Shandong Buchang Pharmaceutical Co., Ltd. - Sina Finance
(https://money.finance.sina.com.cn/corp/view/vCB_AllBulletinDetail.php?stockid=603858&id=11002602)
[2] 2025 Semi-Annual Report of Shandong Buchang Pharmaceutical Co., Ltd. - Xueqiu
(https://stockmc.xueqiu.com/202508/603858_20250828_YYBD.pdf)
[3] Inventory Turnover Ratio Data Chart of Buchang Pharmaceuticals - Tencent News
(https://inews.gtimg.com/om_bt/O_PJqfD5JBgB3KRIsJdKfca0dsOXCVc8OurCyvQRmVgUAAA/641)
The chart above shows the changing trends of Buchang Pharmaceuticals’ inventory amount, inventory turnover ratio, and inventory turnover days from 2020 to 2024. It is clear from the chart that the inventory turnover ratio has continued to decline, while turnover days have continued to increase. Although the inventory amount decreased in 2024, the turnover efficiency is still far below the industry average.
Insights are generated using AI models and historical data for informational purposes only. They do not constitute investment advice or recommendations. Past performance is not indicative of future results.
About us: Ginlix AI is the AI Investment Copilot powered by real data, bridging advanced AI with professional financial databases to provide verifiable, truth-based answers. Please use the chat box below to ask any financial question.