In-Depth Evaluation Report of Buchang Pharmaceutical's Sales Expenses and Marketing Efficiency
Unlock More Features
Login to access AI-powered analysis, deep research reports and more advanced features
About us: Ginlix AI is the AI Investment Copilot powered by real data, bridging advanced AI with professional financial databases to provide verifiable, truth-based answers. Please use the chat box below to ask any financial question.
Related Stocks
Based on the data and analysis I have collected, I now present to you an in-depth evaluation report on Buchang Pharmaceutical’s sales expenses and marketing efficiency.
According to Buchang Pharmaceutical’s 2025 Q3 report and annual report data[0]:
| Indicator | 2024 Full Year | 2025 First Half | 2025 Q3 Report |
|---|---|---|---|
| Sales Expenses (100 million yuan) | 43.23 | 22.39 | 33.41 |
| Operating Revenue (100 million yuan) | 110.04 | 56.64 | Approx. 84.82 |
| Sales Expense Ratio | 39.28% | 39.54% | 39.40% |
Buchang Pharmaceutical’s sales expense structure presents the following characteristics[0]:
| Expense Item | Amount (100 million yuan) | Proportion | Year-on-Year Change |
|---|---|---|---|
| Market, Academic Promotion and Consulting Fees | 40.33 | 93.28% | Year-on-Year Decrease |
| Employee Compensation | 2.42 | 5.59% | Decrease |
| Advertising and Promotion Fees | 0.27 | 0.63% | Significant Decrease |
| Other | 0.22 | 0.50% | Decrease |
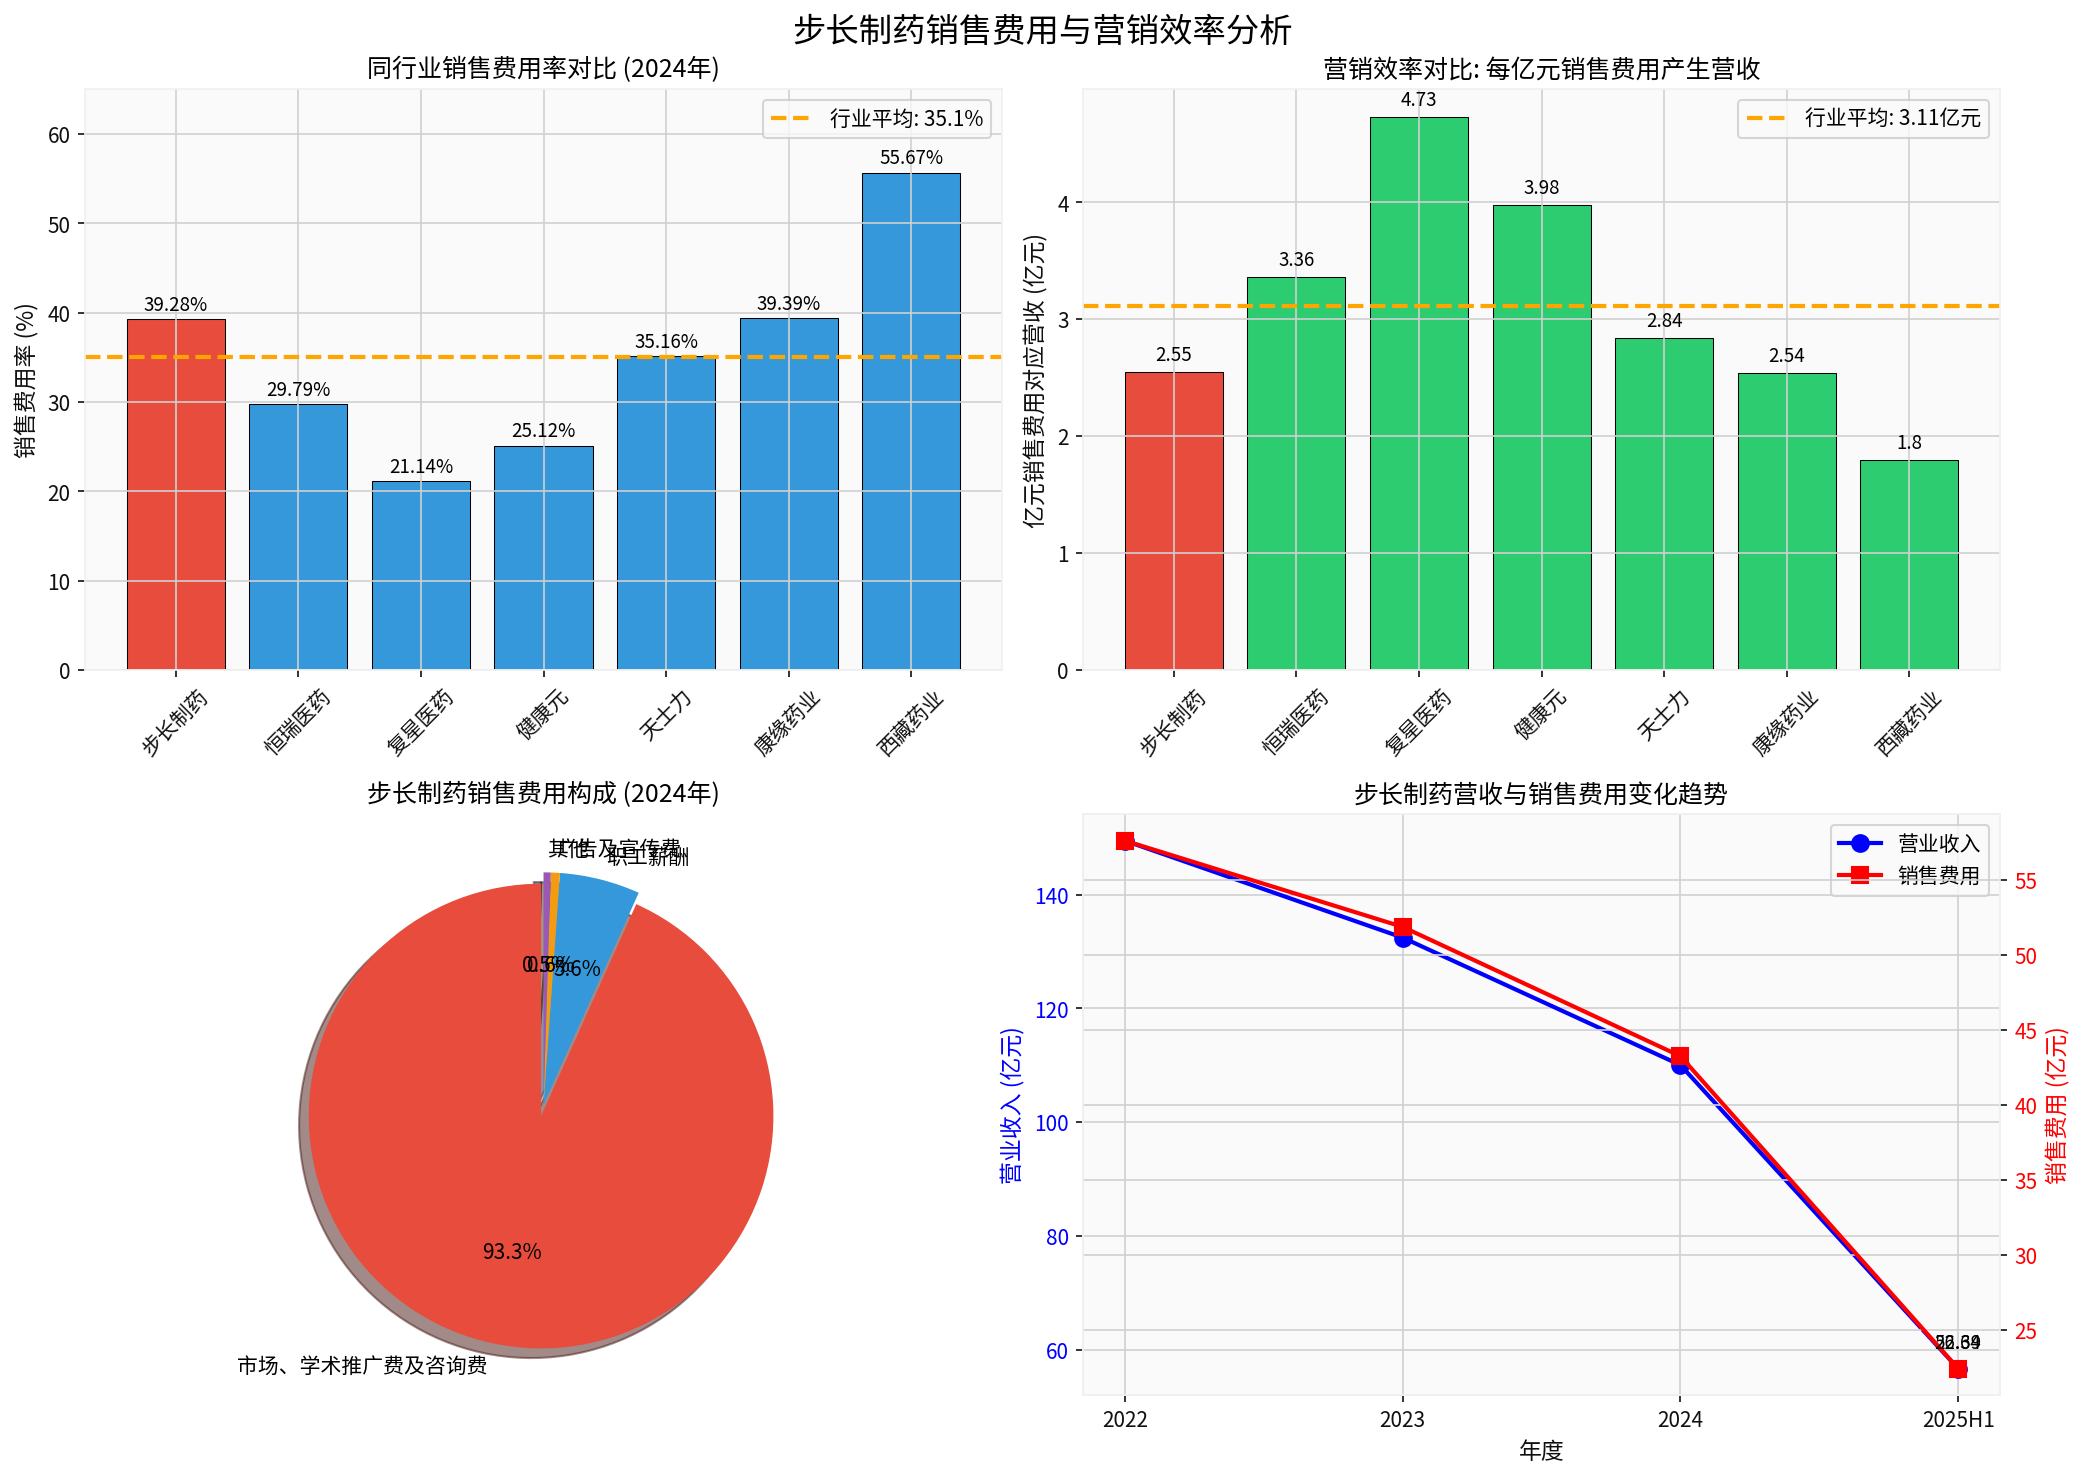
According to 2024 annual report data of comparable peer companies[0]:
| Company | Sales Expenses (100 million yuan) | Sales Expense Ratio | Revenue per 100 Million Yuan in Sales Expenses |
|---|---|---|---|
| Tibet Pharmaceuticals | 15.62 | 55.67% | 180 million yuan |
Buchang Pharmaceutical |
43.23 |
39.28% |
255 million yuan |
| Kangyuan Pharmaceuticals | 15.35 | 39.39% | 254 million yuan |
| Tasly | 29.88 | 35.16% | 284 million yuan |
| Joincare | 39.23 | 25.12% | 398 million yuan |
| Hengrui Medicine | 83.36 | 29.79% | 336 million yuan |
| Fosun Pharma | 86.80 | 21.14% | 473 million yuan |
Among the 7 comparable companies[0]:
- Revenue per 100 Million Yuan in Sales Expenses: Buchang Pharmaceutical ranks 5th with 255 million yuan, lower than the industry average of 312 million yuan
- Sales Expense Ratio: Buchang Pharmaceutical ranks 5th with 39.28%, higher than the industry average of 33.65%
| Evaluation Dimension | Indicator | Value | Industry Evaluation |
|---|---|---|---|
| Input-Output Ratio | Revenue Generated per 100 Million Yuan in Sales Expenses | 255 million yuan | Mid-to-lower tier |
| Cost Burden | Sales Expense Ratio | 39.28% | Relatively High |
| Marginal Contribution | Marketing ROI (Marginal Contribution) | 154.55% | Medium |
| Expense Growth Trend | Sales Expense Ratio Trend | Continually Rising | Negative |
| Year | Operating Revenue (100 million yuan) | Sales Expenses (100 million yuan) | Sales Expense Ratio | Trend |
|---|---|---|---|---|
| 2022 | 149.51 | 57.60 | 38.52% | Revenue↓ Expense Ratio↑ |
| 2023 | 132.46 | 51.85 | 39.15% | Revenue↓ Expense Ratio↑ |
| 2024 | 110.04 | 43.23 | 39.28% | Revenue↓ Expense Ratio↑ |
| 2025H1 | 56.64 | 22.39 | 39.54% | Revenue↓ Expense Ratio↑ |
- Diminishing Marginal Returns: The revenue contribution generated per unit of sales expense continues to decline
- Rigid Cost Characteristics: Academic promotion fees have strong rigidity and cannot be compressed in proportion to revenue decline
- Pressured Market Competitiveness: Product sales are under great pressure, requiring more marketing investment to maintain market share
According to the company’s financial data[0]:
| Profitability Indicator | Value | Industry Comparison |
|---|---|---|
| Net Profit Margin | 0.02% | Extremely Low |
| ROE | 0.02% | Extremely Low |
| Operating Profit Margin | 1.87% | Relatively Low |
| Gross Profit Margin | 59.99% | Relatively High |
In 2024-2025, the pharmaceutical industry is facing increasingly strict compliance supervision[2][3]:
- Impact of the “Two-Invoice System”: Since the implementation of the “Two-Invoice System”, pharmaceutical enterprises have shifted from resolving sales expenses through “invoice passing” to compliant academic promotion models
- Normalized Anti-Corruption: 14 departments including the National Health Commission jointly issued the “2025 Work Points for Correcting Unhealthy Trends in Pharmaceutical Purchase and Sales and Medical Services”, emphasizing “penetrating supervision”[3]
- Measures for the Administration of Pharmaceutical Representatives: The National Medical Products Administration released a draft for comments, strictly limiting the functions of pharmaceutical representatives to pharmaceutical academic promotion
- Compliance Guidelines: In January 2025, the State Administration for Market Regulation released the “Compliance Guidelines for Pharmaceutical Enterprises to Prevent Commercial Bribery Risks”, the first national-level compliance guidance document[3]
| Expense Type | Characteristics | Proportion Trend |
|---|---|---|
| Market/Academic Promotion Fees | Conferences, academic activities, consulting, etc. | Dominant (>80%) |
| Employee Compensation | Labor costs of sales teams | Stable |
| Advertising and Promotion Fees | Brand promotion | Shrinking Trend |
| Other | Channels, business trips, etc. | Shrinking Trend |
The 93.28% proportion of market and academic promotion fees of Buchang Pharmaceutical reflects the typical characteristics of the industry after compliance transformation[2].
| Evaluation Item | Rating | Description |
|---|---|---|
Input-Output Efficiency |
⭐⭐☆ | Mid-to-lower tier, 255 million yuan in revenue per 100 million yuan in sales expenses, lower than the industry average |
Expense Control Capability |
⭐⭐☆ | Weak, sales expense ratio has continued to climb to 39.4% |
Reasonableness of Expense Structure |
⭐⭐⭐⭐ | Good, 93% is academic promotion fees, in line with industry compliance trends |
Revenue Matching Degree |
⭐⭐☆ | Poor, revenue dropped 26% while expense ratio rose 7.4 percentage points |
Contribution to Profitability |
⭐☆☆☆ | Extremely poor, high expense ratio severely erodes profits, net profit margin is only 0.02% |
- Diminishing Marginal Returns: Although the academic promotion model is compliant, the revenue contribution generated per unit of investment continues to decline
- Expense Rigidity: 93% of academic promotion fees are difficult to adjust with business scale, forming a fixed cost burden
- Product Competitiveness: Sustained revenue decline may reflect that products are facing substitution competition or market shrinkage
- Fragile Profit Model: At the current expense ratio level, even if revenue stabilizes, profit space is extremely limited
| Direction | Specific Measures |
|---|---|
Improve Efficiency |
Optimize the input-output evaluation of academic promotion activities to improve precision marketing level |
Product Upgrade |
Increase R&D investment, enhance product competitiveness, and reduce reliance on marketing |
Expense Optimization |
Optimize expense structure within the compliance framework to improve expense utilization efficiency |
Digital Transformation |
Use digital tools to improve marketing efficiency and reduce marginal costs |
[0] Gilin API Data - Buchang Pharmaceutical Financial Analysis and Market Data
[1] Gilin AI Financial Analysis - “Analysis of Reasons for Continuous Decline in Buchang Pharmaceutical’s Performance in the First Half of November 2025” (https://www.gilin.com.cn/essence1107088.html)
[2] Hwuason Tax Firm - “2024 Pharmaceutical Industry Tax Compliance Report” (http://www.hwuason.com/images/uploads/2024/01/12/2024_F6LuJKC.pdf)
[3] Global Law Office - “2024 Year-End Review of Life Sciences and Healthcare Industry Development and Compliance Supervision” (https://www.glo.com.cn/Content/2025/02-05/0917115213.html)
[4] Shandong Buchang Pharmaceutical Co., Ltd. 2024 Annual Report (http://static.cninfo.com.cn/finalpage/2025-04-26/1223325841.PDF)
[5] Shandong Buchang Pharmaceutical Co., Ltd. 2025 Semi-Annual Report (https://stockmc.xueqiu.com/202508/603858_20250828_YYBD.pdf)
Insights are generated using AI models and historical data for informational purposes only. They do not constitute investment advice or recommendations. Past performance is not indicative of future results.
About us: Ginlix AI is the AI Investment Copilot powered by real data, bridging advanced AI with professional financial databases to provide verifiable, truth-based answers. Please use the chat box below to ask any financial question.