In-depth Profitability Quality Assessment Report for Huasheng Tiancheng (600410)
Unlock More Features
Login to access AI-powered analysis, deep research reports and more advanced features
About us: Ginlix AI is the AI Investment Copilot powered by real data, bridging advanced AI with professional financial databases to provide verifiable, truth-based answers. Please use the chat box below to ask any financial question.
Related Stocks
Now I have complete information, let me present the comprehensive profitability quality assessment report for Huasheng Tiancheng.
Based on 2024 annual report data,
| Indicator | Amount | Description |
|---|---|---|
| Operating Revenue | 4.271 billion yuan | +2.57% YoY |
| Operating Profit | 71.94 million yuan | Main business profit margin only 1.68% |
| Net Profit | 24.12 million yuan | Returned to profit from loss |
| Non-Recurring Gains and Losses | 51.22 million yuan | Mainly from investment income and fair value changes |
Net Profit After Deducting Non-Recurring Gains and Losses |
-27.1 million yuan |
Main business in loss |
According to the annual report disclosure, the breakdown of 2024 non-recurring gains and losses is as follows:
| Item | Amount (10,000 yuan) | Proportion of Non-Recurring Gains and Losses |
|---|---|---|
| Fair Value Change Gains and Losses (Stock Investments) | 38.84 | 75.83% |
| Government Subsidies Included in Current Period Profits and Losses | 28.92 | 56.46% |
| Other Non-Operating Income and Expenses | 10.77 | 21.03% |
| Gains and Losses from Asset Disposals | 2.71 | 5.29% |
| Impact of Income Tax | -11.66 | -22.76% |
| Impact of Minority Shareholders’ Equity | 6.21 | 12.12% |
Total |
51.22 |
100% |
- Fair value change gains and losses are the largest contributor, accounting for 75.83%, mainly from the stock price increase of Telink Semiconductor (688591) held by the company
- Government subsidies account for 56.46%, reflecting the company’s high dependence on subsidies
- After deducting income tax and the impact of minority shareholders’ equity, the net non-recurring gains and losses amount to 51.22 million yuan
Comprehensive assessment is based on the following three dimensions:
| Assessment Dimension | Scoring Criteria | Huasheng Tiancheng’s Score |
|---|---|---|
| Proportion of Non-Recurring Gains and Losses | <10% = 4 points, <30% = 3 points, <50% = 2 points, <100% = 1 point | 0 points (212% > 100%) |
| Net Profit After Deducting Non-Recurring Gains and Losses | >0 = 3 points, <0 = 0 points | 0 points (Loss of 27.1 million yuan) |
| Net Profit Margin | >3% = 2 points, <3% = 1 point | 1 point (0.56%) |
Overall Score |
Full score 10 points |
1/10 points |
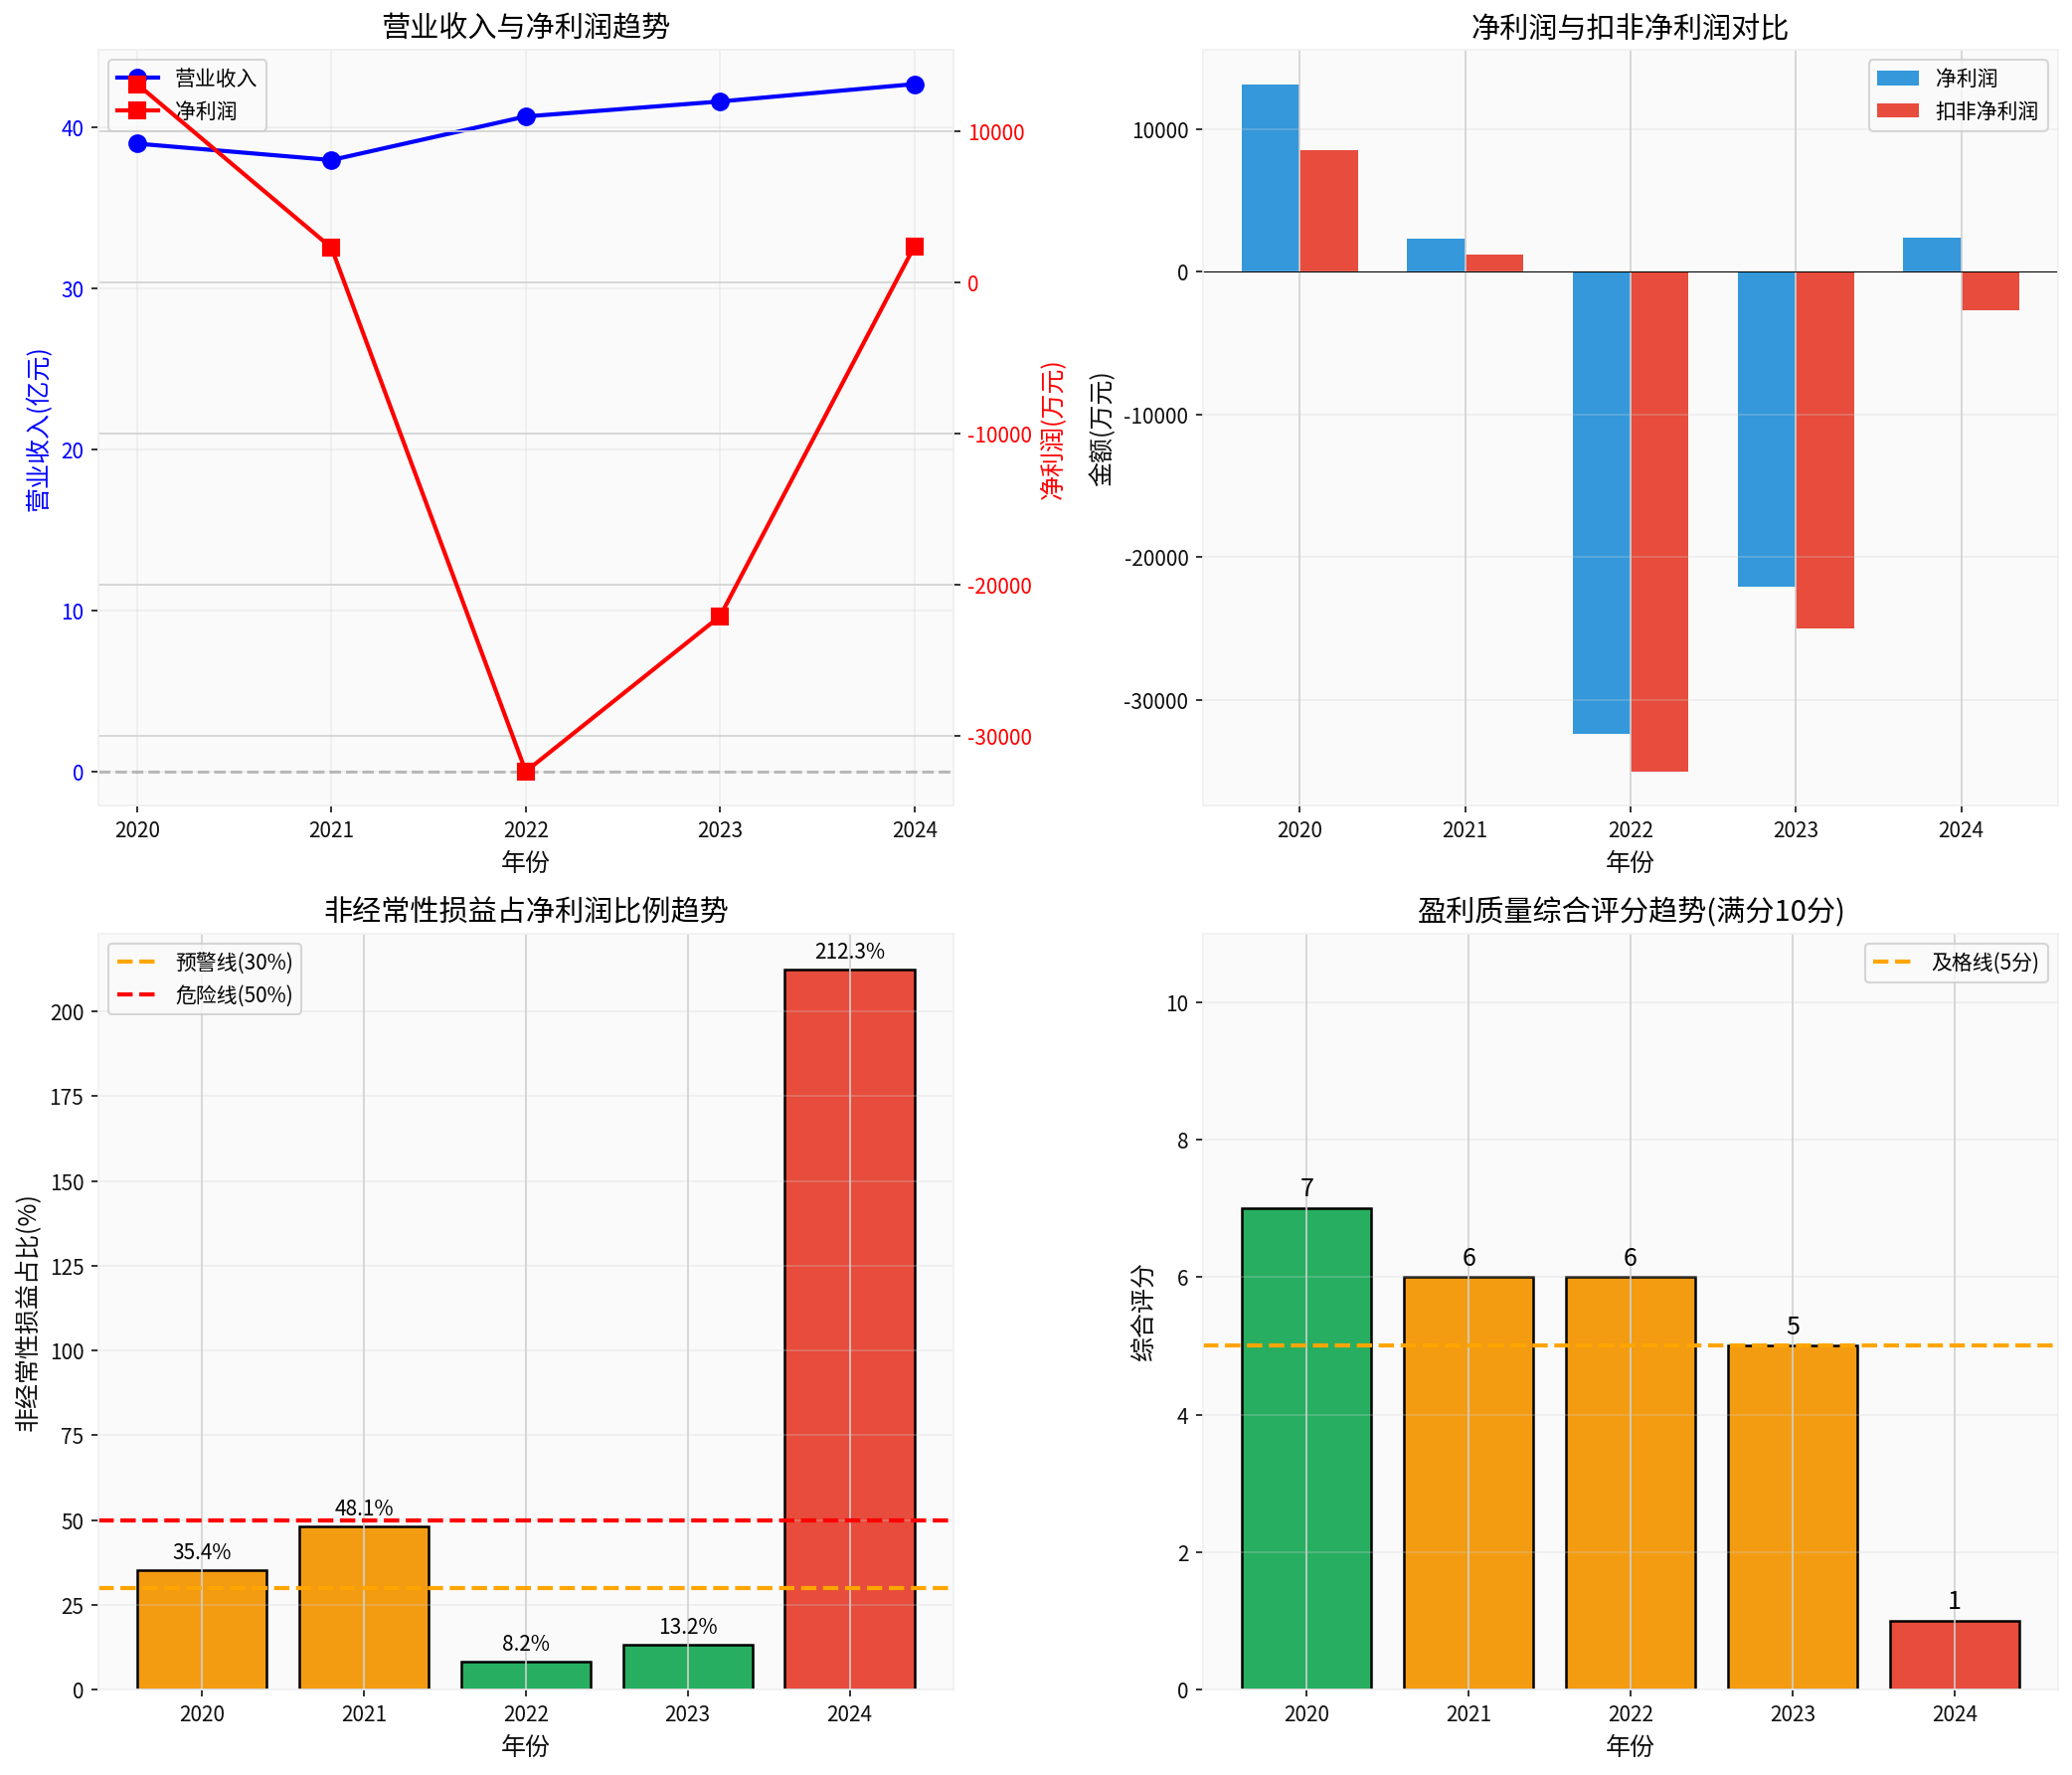
| Year | Net Profit After Deducting Non-Recurring Gains and Losses (10,000 yuan) | Proportion of Non-Recurring Gains and Losses | Score | Rating |
|---|---|---|---|---|
| 2020 | 85.00 | 35.36% | 7 points | 🟡 Good |
| 2021 | 12.00 | 48.06% | 6 points | 🟡 Good |
| 2022 | -350.00 | 8.18% | 6 points | 🟡 Good |
| 2023 | -250.00 | 13.24% | 5 points | 🔴 Poor |
| 2024 | -27.10 | 212.33% | 1 point | 🔴 Poor |
- Continuous Deterioration: The profitability quality score dropped from 7 points in 2020 to 1 point in 2024
- Net profit after deducting non-recurring gains and losses was in loss for 4 out of 5 consecutive years: Only barely positive in 2021
- 2024 saw a record high proportion of non-recurring gains and losses: A significant deterioration from 13.24% in 2023
- Operating profit margin is only 1.68%, which is at a low level in the software industry
- Gross margin of cloud computing products dropped from 28.73% in 2020 to 21.01% in 2024
- Gross margin of IT solutions business is only 9.62%
- The company holds 7.42% equity (17.86 million shares) of Telink Semiconductor
- Fluctuations in Telink Semiconductor’s stock price directly determine Huasheng Tiancheng’s profit performance
- Fair value change gains are expected to be 200-250 million yuan in H1 2025, but net profit after deducting non-recurring gains and losses still remains in a loss of 65-95 million yuan
- Unrealized gains from Telink Semiconductor’s stock price increase are not sustainable
- The company maintains 900-1000 million yuan of trading financial assets all year round, leading to high risk of profit fluctuations
- Once the stock price pulls back, performance will drop significantly
Regarding the “83.31%” you mentioned, search results indicate that it may refer to:
- Net profit after deducting non-recurring gains and losses in H1 2025 was -83.31 million yuan: The loss narrowed compared to -271 million yuan in the same period of 2024
- Net profit after deducting non-recurring gains and losses improved by 83.31% YoY: In terms of absolute value, the loss magnitude is indeed decreasing
| Indicator | Amount | YoY Change |
|---|---|---|
| Operating Revenue | 3.172 billion yuan | +6.54% |
| Net Profit Attributable to Parent Company | 358 million yuan | +267.43% |
| Net Profit After Deducting Non-Recurring Gains and Losses | Approximately 50 million yuan (Q3 single quarter) | Significant improvement |
- ⚠️ Profitability of main business is still unstable: Although net profit after deducting non-recurring gains and losses turned positive in Q3 2025, its sustainability remains to be seen
- ⚠️ Overvaluation: Current P/E ratio is 44.89x, P/B ratio is 5.65x, and the stock price has already factored in expectations
- ⚠️ High dependence on investment income: Poor profit quality with high risk of performance fluctuations
- ✅ Layout of AI computing power business has achieved results, with in-depth cooperation with Huawei Ascend ecosystem
- ✅ Spun off U.S. cloud computing company GDI for listing on Nasdaq, with a valuation of US$398 million
- ✅ IPOs of invested enterprises such as Telink Semiconductor and Bosichuang have brought capital appreciation
[0] Jinling AI Financial Database - Huasheng Tiancheng (600410.SS) Financial Data
[1] 2024 Annual Report of Beijing Huasheng Tiancheng Technology Co., Ltd. (https://file.finance.qq.com/finance/hs/pdf/2025/04/26/1223324852.PDF)
[2] Eastmoney - Huasheng Tiancheng H1 2025 Profit Forecast Announcement (https://finance.eastmoney.com/a/202507143456354894.html)
[3] Caifuhao - Dual-Driven by Computing Power + Ecosystem, Huasheng Tiancheng Faces New Opportunity for Valuation Reassessment (https://caifuhao.eastmoney.com/news/20260112233144807447190)
[4] Tiger Finance - Behind Huasheng Tiancheng’s 137% Surge in One Month (http://m.laohucaijing.com/News/149582/)
[5] Sina Finance - Huasheng Tiancheng Financial Indicators (https://vip.stock.finance.sina.com.cn/corp/go.php/vFD_FinancialGuideLine/stockid/600410/displaytype/4.phtml)
Insights are generated using AI models and historical data for informational purposes only. They do not constitute investment advice or recommendations. Past performance is not indicative of future results.
About us: Ginlix AI is the AI Investment Copilot powered by real data, bridging advanced AI with professional financial databases to provide verifiable, truth-based answers. Please use the chat box below to ask any financial question.