In-Depth Analysis of TSMC (TSM) Investment Value: Growth Momentum of AI Chip Business and Long-Term Market Position
Unlock More Features
Login to access AI-powered analysis, deep research reports and more advanced features
About us: Ginlix AI is the AI Investment Copilot powered by real data, bridging advanced AI with professional financial databases to provide verifiable, truth-based answers. Please use the chat box below to ask any financial question.
Related Stocks
Based on the comprehensive data collection and analysis above, I present to you an in-depth research report on
TSM released its Q4 2026 earnings report on January 15, 2026, which once again confirms the continued surge in demand for AI chips [1][3]. Key highlights are as follows:
| Indicator | Data | YoY Change |
|---|---|---|
| Quarterly Revenue | $33.311 Billion | +25.5% YoY |
| Net Profit | $16.0 Billion | +35% YoY |
| Gross Margin | 62.3% | Above Expectations |
| EPS | $3.09 | 9.57% Above Expectations |
| 2026 CapEx Guidance | $54-$56 Billion | 32% Increase from 2025’s $41 Billion |
Management provided guidance on the earnings call that
- NVIDIA Blackwell Architecture: TSMC is the exclusive foundry for H100/H200/GH200; approximately 2 million H200 GPUs have been pre-ordered in the Chinese market [2]
- AMD MI300 Series: Volume production is ramping up rapidly, with expected increased orders on the N3 process in 2026
- Custom Chips by Cloud Computing Giants: Apple’s Baltra (2027), Google TPU, Microsoft Maia, and Amazon Trainium all rely on TSMC’s advanced manufacturing processes [4][5]
- Apple (expected for iPhone 2027 chips)
- NVIDIA (Rubin architecture GPU)
- AMD, Qualcomm, Broadcom, Intel, etc. [6]
- Arizona wafer fab (to have 2nm capacity in 2028)
- Expansion of advanced packaging (CoWoS) capacity in Taiwan
- Ramping up N2 production lines at the Kaohsiung fab
| Valuation Metric | Value | Industry Comparison |
|---|---|---|
| Market Capitalization | $1.77 Trillion | 3rd Largest Semiconductor Company Globally |
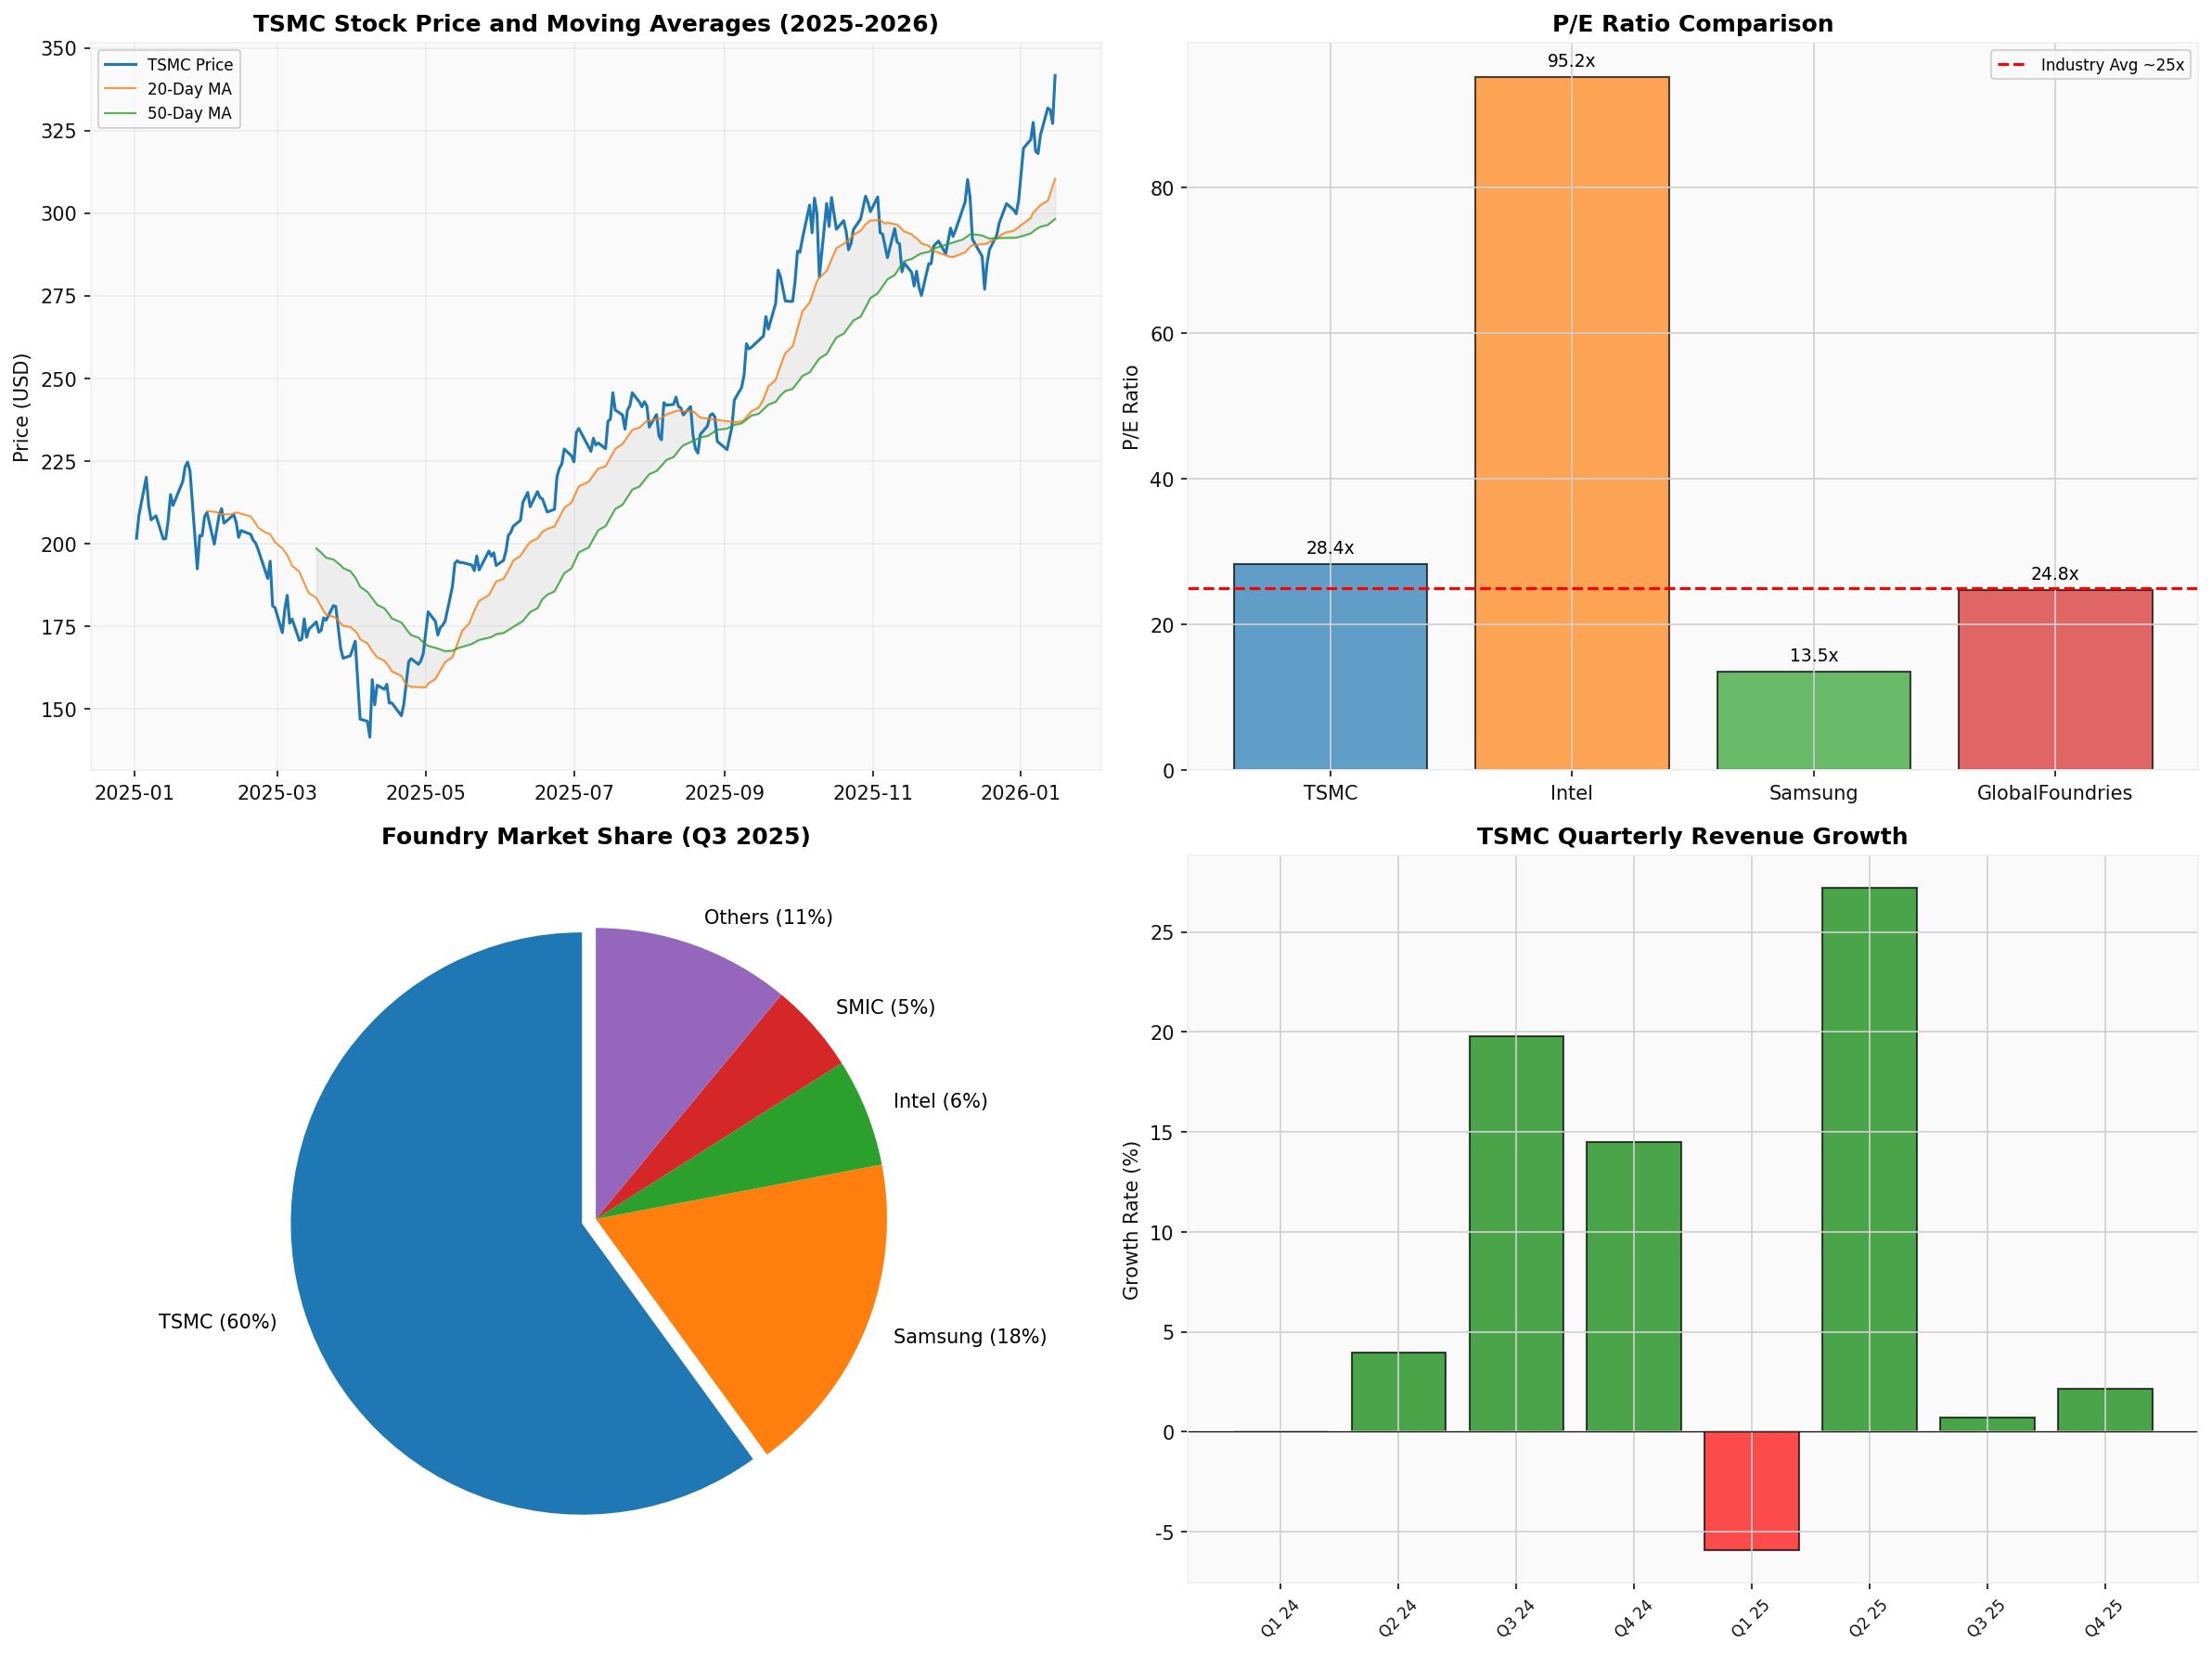
| P/E (TTM) | 28.36x | Higher than Industry Average of ~25x |
| P/B | 9.00x | Higher than Historical Average |
| Stock Performance (YTD) | +6.89% | +65.20% Increase Over the Past Year |
Based on three scenario analyses using the DCF model [0]:
| Scenario | Intrinsic Value | vs. Current Price |
|---|---|---|
| Bear Case | $1,806.68 | +428.8% |
| Base Case | $2,022.49 | +492.0% |
| Bull Case | $2,698.16 | +689.8% |
Probability-Weighted Valuation |
$2,175.78 |
+536.9% |
- WACC: 8.7%
- Terminal Growth Rate: 2.0-3.0%
- EBITDA Margin: 65.9-72.8%
- Revenue CAGR: 0-24.2%
- Oligopoly Pattern: ~74% market share in advanced manufacturing processes (7nm and below) [7]
- AI Super Cycle: Order visibility extends to 2027
- Strong Pricing Power: Gross margin of over 62% proves strong bargaining power
- Abundant Free Cash Flow: 2024 FCF of approximately $87 Billion
- Valuation Premium: 28x P/E already reflects most growth expectations
- Geopolitical Risks: Cross-Strait tensions may impact the supply chain
- Customer Concentration: Top 10 customers account for approximately 70% of revenue
| Company | Market Share (Q3 2025) | Technology Node | Strengths/Weaknesses |
|---|---|---|---|
TSMC |
60% |
2nm Mass-Produced | Technology Leadership, High Yield, Perfect Ecosystem |
| Samsung | 18% | 2nm GAA | Vertically Integrated, but Yield <40% [8] |
| Intel | 6% | 18A (~1.8nm) | IDM 2.0 Transformation, Yield Exceeds 60% [8] |
| SMIC | 5% | 7nm | Main Player in China’s Domestic Substitution |
- SF2 (2nm) Yield is Only Approximately 40%, far lower than TSMC N2’s ~80% [8]
- Loss of Major Customers: Qualcomm and AMD have moved flagship chip orders back to TSMC [6]
- Disadvantage of Vertical Integration: Competes with customers (e.g., smartphones vs. Apple/Xiaomi)
Samsung’s only strategic value lies in its
- Potential Customers: May take on some AI chip orders from non-Chinese customers
- In-House Products: Intel Xeon and GPUs will switch to in-house foundry services
- Market Landscape: May surpass Samsung to become the second-largest foundry
- IDM 2.0 transformation requires several years of verification
- Capacity ramp-up speed is slower than TSMC’s
- Customer concerns about being a “frenemy” (both competitor and supplier)
SMIC continues to expand in 7nm and above nodes, mainly serving
| Company | Self-Developed Chips | Manufacturing Node | Impact Assessment |
|---|---|---|---|
| Apple | A Series/M Series/Baltra | 3nm (N3E) → 2nm | Deeply Tied to TSMC |
| TPU v5/v6 | 4nm → 3nm | Key Foundry Customer | |
| Microsoft | Azure Maia | 5nm → 3nm | Incremental Demand |
| Amazon | Trainium/Inferentia | 5nm → 3nm | Continuous Order Expansion |
| Meta | MTIA | 5nm | Customized Demand |
- Customer Diversification: Transformed from mobile/PC to cloud computing/AI; customer base increased from 4 (Fab 18, 2020) to 45 (Fab 18, 2025) [4]
- Expanded Order Scale: NVIDIA is expected to surpass Apple as the largest N3 customer in Q4 2027 [4]
- Reduced Pilot Production Costs for Advanced Nodes: Major customers like Apple bear the early yield learning costs for new nodes [4]
- Enhanced Pricing Power: HPC customers are less price-sensitive and accept TSMC’s premium pricing
- Risk of Order Loss: If large customers increase the penetration of self-developed chips, they may reduce reliance on third-party GPUs
- Customization vs. Standardization: Tech giants prefer custom chips, which may compress the general-purpose GPU market
- Bargaining Power Shift: In the long term, customers may demand more favorable prices or exclusive capacity
- Self-developed chips still require TSMC’s foundry services (Apple accounts for ~20% of TSMC’s revenue [4])
- The total growth of AI chips is much faster than the speed of customer internalization
- TSMC’s manufacturing process leadership makes it a “must-choose” rather than an “optional” supplier
| Dimension | Assessment | Rating |
|---|---|---|
| AI Growth Momentum | Strong, CAGR 50%+, visibility to 2027 | ★★★★★ |
| Valuation Rationality | High but supported by fundamentals | ★★★☆☆ |
| Competitive Landscape | Expanded technological leadership, deeper moat | ★★★★★ |
| Impact of Customer Self-Development | Short-term positive, long-term needs monitoring | ★★★★☆ |
Comprehensive Rating |
Buy/Hold |
★★★★☆ |
- Current Price: $341.64
- Analyst Consensus Target Price: $377.50 (+10.5%) [0]
- DCF Probability-Weighted Valuation: $2,175.78 (+536.9%)
- Reasonable Valuation Range: Based on 25-30x forward P/E, the 2026 reasonable range is $380-$420
- Macroeconomic Risks: If a bubble bursts in AI capital expenditure, orders will be directly affected
- Geopolitical Risks: Escalation of U.S.-China tech war may impact high-end chip shipments
- Increased Competition Risk: If Intel’s 18A enters mass production successfully, it may divert some orders
- Technology Route Risk: Changes in Chiplet/advanced packaging technology routes may alter the competitive landscape
- Quarterly changes in AI revenue share in earnings reports
- Comparison of actual CapEx expenditure vs. guidance
- Order guidance from major customers (NVIDIA/Apple/AMD)
- Technology yield progress of competitors (Samsung/Intel)
[1] Yahoo Finance - “Chip stocks jump as Nvidia supplier TSMC dismisses bubble fears” (https://finance.yahoo.com/news/chip-stocks-jump-as-nvidia-supplier-tsmc-dismisses-bubble-fears-142119829.html)
[2] Yahoo Finance - “Nvidia Seeks TSMC Talks as China Orders Outpace H200” (https://finance.yahoo.com/news/nvidia-seeks-tsmc-talks-china-155912134.html)
[3] Business Times Online - “TSMC’s Blockbuster Results Ignite Global Chip Rally” (http://business.times-online.com/times-online/article/marketminute-2026-1-15-tsmcs-blockbuster-results-ignite-global-chip-rally-as-ai-demand-reaches-fever-pitch)
[4] SemiAnalysis - “Apple-TSMC: The Partnership That Built Modern Computing” (https://newsletter.semianalysis.com/p/apple-tsmc-the-partnership-that-built)
[5] LinkedIn - “Apple Develops In-House AI Chip ‘Baltra’ for 2027” (https://www.linkedin.com/posts/edsonbellido_ai-aiinfrastructure-apple-activity-7413278052459139072-f1at)
[6] EE Times - “TSMC to Lead Rivals at 2-nm Node, Analysts Say” (https://www.eetimes.com/tsmc-to-lead-rivals-at-2-nm-node-analysts-say/)
[7] Mordor Intelligence - “Semiconductor Foundry Market Size & Share Analysis” (https://www.mordorintelligence.com/industry-reports/semiconductor-foundry-market)
[8] Economy.ac - “Intel’s 1.8-Nanometer-Class Yield Reversal to 60%” (https://economy.ac/news/2026/01/202601286779)
[0] Jinling AI Financial Database (Real-Time Market, Financial Analysis, DCF Valuation, Technical Indicators)
Insights are generated using AI models and historical data for informational purposes only. They do not constitute investment advice or recommendations. Past performance is not indicative of future results.
About us: Ginlix AI is the AI Investment Copilot powered by real data, bridging advanced AI with professional financial databases to provide verifiable, truth-based answers. Please use the chat box below to ask any financial question.