Reddit Discussion: Range Fade Strategy Analysis for Sideways Markets
Unlock More Features
Login to access AI-powered analysis, deep research reports and more advanced features
About us: Ginlix AI is the AI Investment Copilot powered by real data, bridging advanced AI with professional financial databases to provide verifiable, truth-based answers. Please use the chat box below to ask any financial question.
This analysis is based on a Reddit discussion posted on November 12, 2025, at 9:36 AM EST [0], where a user described their range fade strategy using 5-minute boundaries and RSI divergence for sideways market conditions. The timing of this discussion aligns with notably choppy market conditions, where major indices showed mixed performance - S&P 500 down 0.25%, NASDAQ down 0.67%, while Dow Jones gained 0.50% [0]. This fragmented market environment, with sector performance ranging from Communication Services (+1.38%) to Energy (-1.22%), creates ideal conditions for range-bound trading strategies [0].
The current market environment exhibits characteristics that make the discussed range fade strategy particularly relevant. The divergence between major indices, with technology-heavy NASDAQ declining while industrial-focused Dow Jones advanced, creates the type of choppy conditions where traditional trend-following approaches struggle [0]. Sector performance further illustrates this fragmentation, with Communication Services and Basic Materials outperforming while Technology and Energy sectors underperformed [0].
The range fade strategy combines two critical technical elements:
- 5-minute boundary identificationfor defining trading ranges
- RSI divergence confirmationto validate reversals and avoid false breakouts
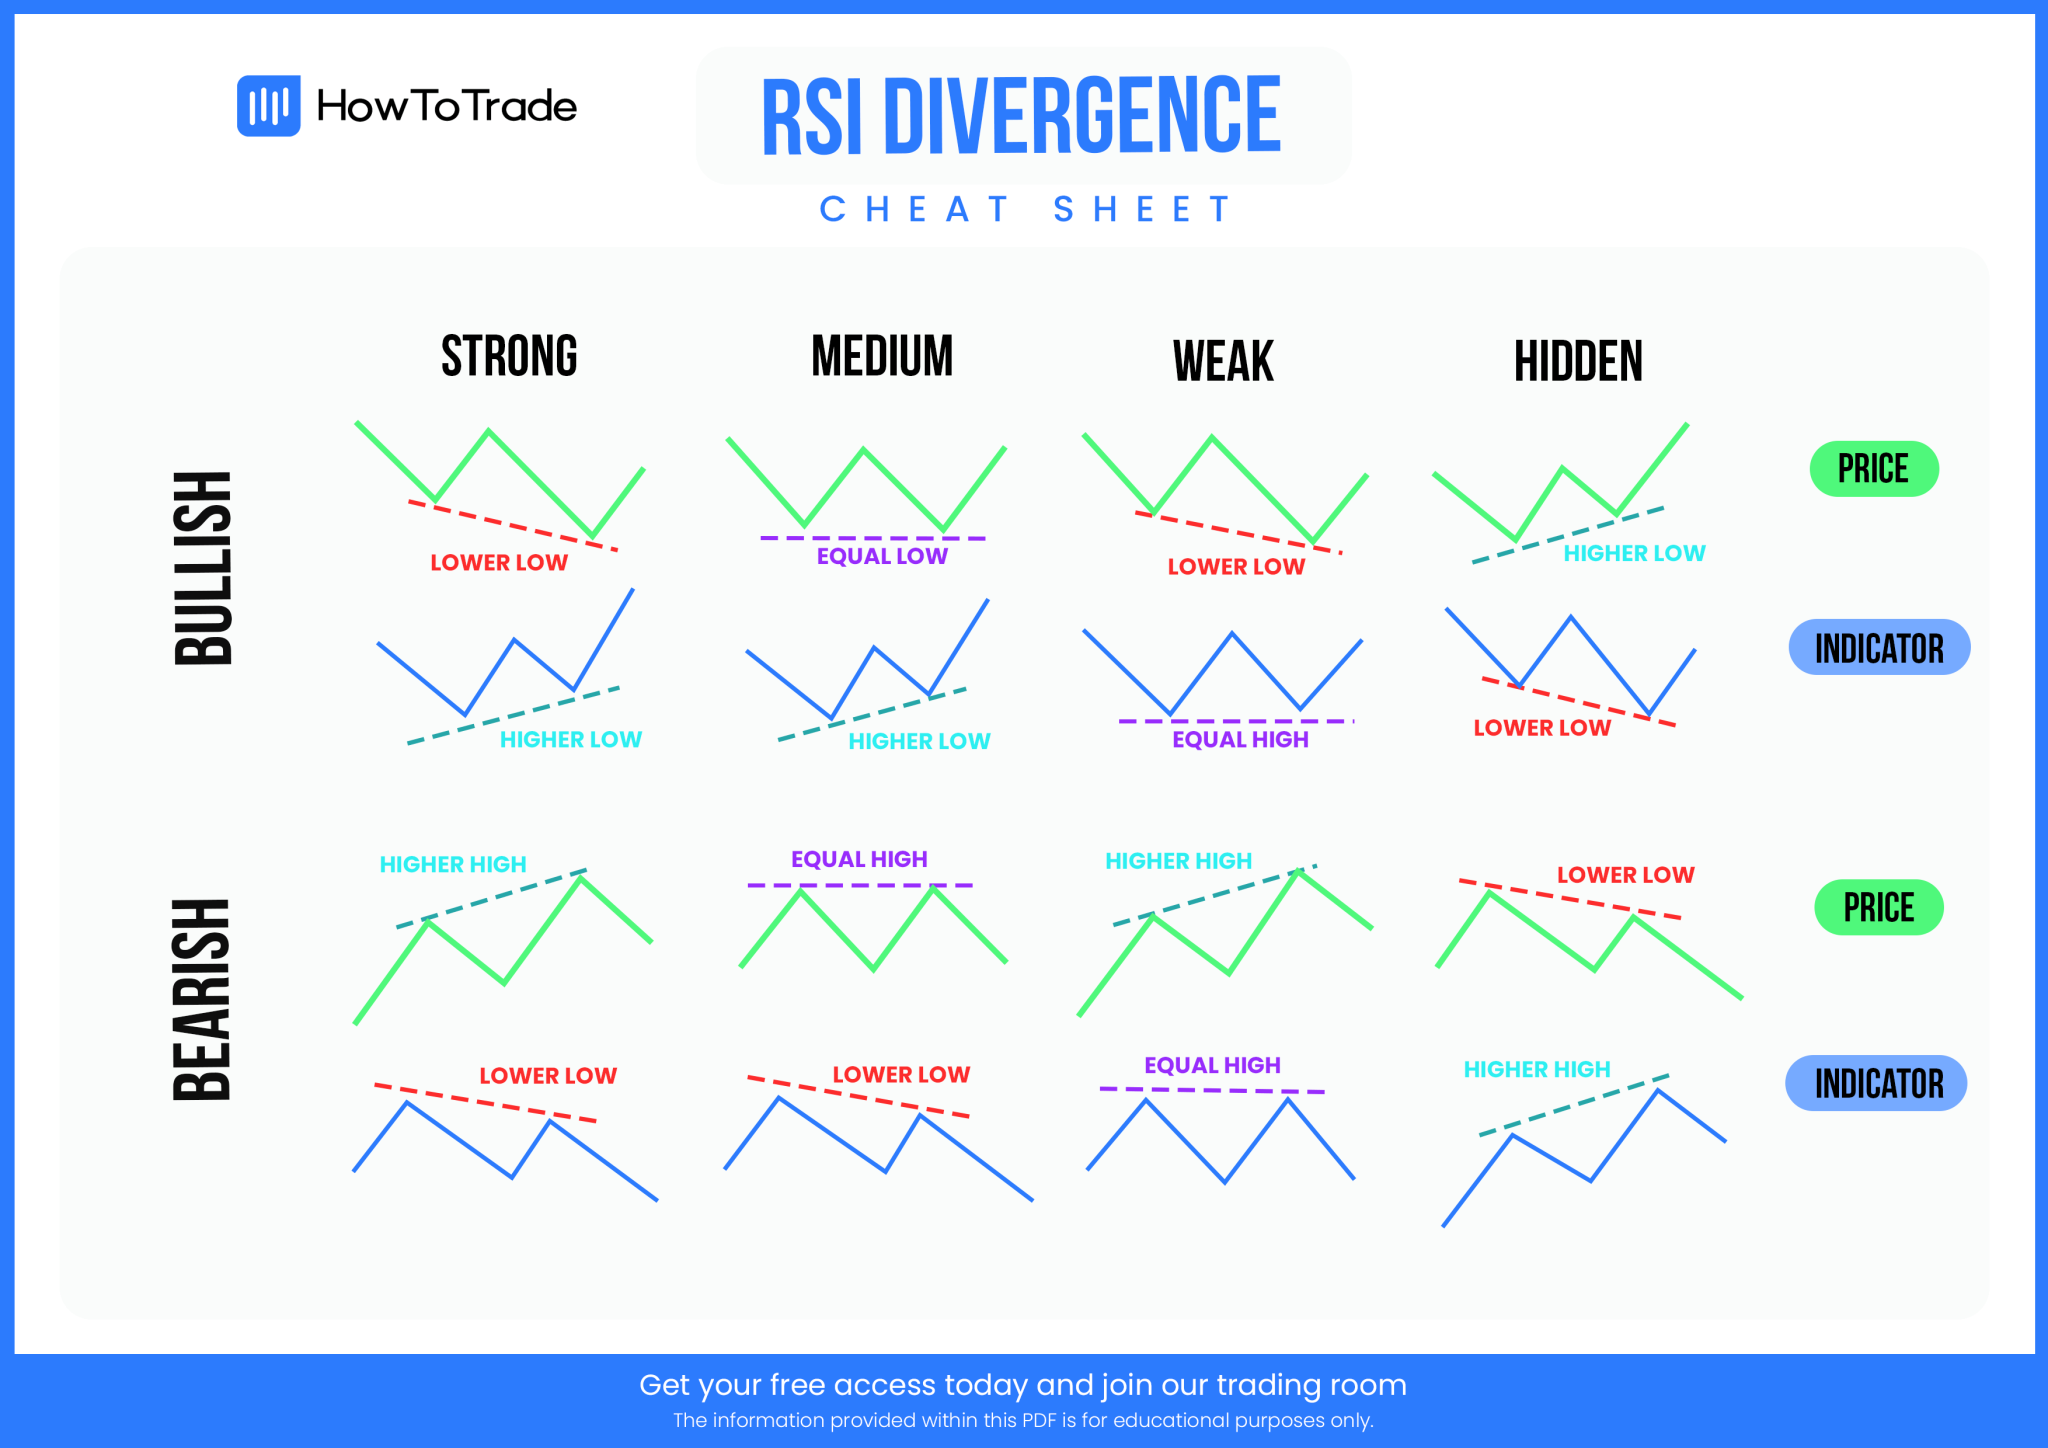
According to technical analysis resources, RSI divergence on 5-minute charts is particularly valuable for catching momentum shifts before they become obvious to broader market participants [1]. This approach aims to identify bullish divergence (price making lower lows while RSI makes higher lows) and bearish divergence (price making higher highs while RSI makes lower highs) [1].
Current market conditions feature elevated volatility driven by geopolitical tensions, evolving monetary policy expectations, and ongoing asset valuation concerns [2]. This environment creates the choppy conditions where range-bound approaches become more suitable than trend-following strategies [3]. The strategy’s focus on avoiding fake breakouts addresses a common challenge in sideways markets, where false signals can lead to significant losses.
The discussion reveals several important connections between market structure and trading strategy:
-
Index Divergence as Range Indicator: The mixed performance across major indices serves as a natural indicator of sideways conditions, making range trading strategies more appropriate than directional bets [0].
-
Sector Rotation Impact: The significant variation in sector performance (+1.38% in Communication Services vs. -1.22% in Energy) creates rotational dynamics that contribute to choppy price action at the index level [0].
-
Timeframe Optimization: The 5-minute chart focus reflects an understanding that shorter timeframes are more sensitive to momentum shifts in range-bound markets, while longer timeframes may show misleading trends [1].
The range fade strategy’s success depends on several market conditions currently present:
- Elevated but contained volatilitythat creates trading opportunities without breaking ranges
- Sufficient liquidityduring active trading sessions for effective boundary testing
- Clear momentum divergencesignals that precede actual price reversals [1]
-
False Breakout Risk: Even with RSI divergence, sideways markets can produce sudden breakouts that result in significant losses. The analysis indicates that major economic releases or central bank announcements can abruptly end sideways conditions [2].
-
Whipsaw Patterns: Rapid price reversals in choppy markets can trigger multiple stop-losses, particularly during low-volume periods or when cross-market correlations break down [0].
-
Strategy Adaptation Risk: The current market regime may shift suddenly, rendering range-bound strategies ineffective. Monitoring of the VIX index and volume patterns is essential for early detection of regime changes [2].
-
Optimal Trading Sessions: The strategy may be most effective during periods of high liquidity and moderate volatility, typically during overlapping trading sessions when multiple markets are active [0].
-
Sector-Specific Applications: Certain sectors showing clearer range patterns (like the current divergence between Technology and Healthcare sectors) may offer better risk-reward ratios for the range fade approach [0].
-
Momentum Divergence Signals: Current market conditions with elevated volatility increase the frequency of meaningful RSI divergences, potentially providing more high-quality trading signals [1].
Users should monitor several factors that could significantly impact sideways trading strategies:
- Rising VIX levelsmay indicate the end of sideways conditions
- Decreasing volume patternsoften precede breakouts from trading ranges
- Cross-market correlation breakdownsmay signal changing market dynamics
- Major economic calendar eventscan trigger sudden trend movements [2]
The Reddit discussion highlights a range fade strategy that is particularly well-suited to current market conditions characterized by index divergence, sector rotation, and elevated volatility. The strategy’s combination of 5-minute boundary identification and RSI divergence confirmation addresses key challenges in sideways markets [0].
However, several critical information gaps remain:
- Specific RSI period settings are not disclosed, which is crucial for strategy effectiveness
- Risk management parameters including stop-loss levels and position sizing rules are absent
- No historical backtesting results are provided to validate the approach
- Market condition filters for determining when to apply the strategy versus staying out of the market are unclear [0]
The current market environment with S&P 500 ranging between 6,829.62 and 6,869.91, NASDAQ between 23,278.30 and 23,564.09, and significant sector performance variation creates the type of choppy conditions where this strategy could be applicable [0]. However, users should be aware of the inherent risks in range-bound trading and implement proper risk management protocols.
Insights are generated using AI models and historical data for informational purposes only. They do not constitute investment advice or recommendations. Past performance is not indicative of future results.
About us: Ginlix AI is the AI Investment Copilot powered by real data, bridging advanced AI with professional financial databases to provide verifiable, truth-based answers. Please use the chat box below to ask any financial question.